INTRODUCTION
An increase of carbon dioxide in the atmosphere, which mainly comes from fossil fuel emissions from energy production processes, is considered a major contributor to global climate change, rising sea levels, and increased acidity of oceans. As coal-burning power plants will be an important part of energy production in the foreseeable future, reducing emissions from these plants is critical for global sustainability.
For carbon capture applications, there have been intensive efforts to develop new classes of zeolite-like materials based upon porous metal-organic framework (MOF) materials (Wang et al., Reference Wang, Cote, Furukawa, O’Keeffe and Yaghi2008a; Park et al. Reference Park, Ni, Côte, Cho, Huang, Uribe-Romo, Chae, O’Keeffe and Yaghi2006; Britt et al. Reference Britt, Tranchemontagne and Yaghi2008; Chapman et al., Reference Chapman, Halder and Chupas2009; Pérez-Pellitero et al., Reference Pérez-Pellitero, Amrouche, Siperstein, Pirngruber, Nieto-Draghi, Chaplais, Simon-Masseron, Bazer-Bachi, Peralta and Bats2010). The salient structural features of MOFs are large pores with small apertures that are essential in catalytic, ion-exchange, gas storage, and gas separation applications. Current MOF research is focused on incorporating different transition metal ions and organic units into the framework structure, with the goal of modifying the pore size and shape in these materials, and identifying new or improved catalytic and adsorption properties.
Zeolitic imidazolate framework (ZIF) materials are a new class of MOF materials that use imidazolate ligands to bind to tetrahedral M(II) ions (M = Co, Cu, Zn, Mg, etc.) (Park et al. Reference Park, Ni, Côte, Cho, Huang, Uribe-Romo, Chae, O’Keeffe and Yaghi2006; Lewis et al., Reference Lewis, Ruiz-Salvador, Gómez, Rodriguez-Albelo, Coudert, Slater, Cheetham and Mellot-Draznieks2009; Wu et al., Reference Wu, Zhou and Yildirim2007). These are porous crystalline materials with a cage-like tetrahedral network. In the ZIF architecture, M 2+ ions typically play the role of silicon, and the imidazolate anions form bridges that mimic the role of oxygen in natural aluminosilicate zeolites. The resulting structure provides bond angles that are similar to those found for Si-O-Si in zeolites.
Bis(2-methylimidazolyl)-zinc, C8H10N4Zn or (CH3C3 H2N2)2Zn (commonly known as the ZIF-8), is one of the 20 ZIF family members that were first reported by Park et al. (Reference Park, Ni, Côte, Cho, Huang, Uribe-Romo, Chae, O’Keeffe and Yaghi2006). ZIFs have been reported to readily adsorb H2 and CO2. Their tunable pore size and high thermal stability are a result of the strong bonding between the imidazolate linker and the metal center. It was reported by Wu et al. (Reference Wu, Zhou and Yildirim2007) that at high H2 loading, the ZIF-8 structure is capable of holding up to 28 H2 molecules (4.2% mass fraction). This material also has high-capture efficiency for CO2 (Wang et al., Reference Wang, Cote, Furukawa, O’Keeffe and Yaghi2008a; Park et al., Reference Park, Ni, Côte, Cho, Huang, Uribe-Romo, Chae, O’Keeffe and Yaghi2006).
As X-ray powder diffraction is a nondestructive method for characterization, determination of standard reference diffraction patterns for sorbent materials plays a critical role for the research community that investigates efficient solid sorbent materials for the CO2 capture process. We report the high-resolution experimental powder diffraction pattern for the ZIF-8 material for inclusion in the Powder Diffraction File (PDF).
EXPERIMENTALFootnote 1
The ZIF-8 sample was obtained from Sigma-Aldrich Chemical Corp. under the commercial name of Basolite

Figure 1. Thermogravimetric analysis of ZIF-8 up to 1000 °C.
Z1200 (Lot S45328-308). Sample loading into the capillaries used for data collection was performed inside a dry box with flowing Ar. Activation of ZIF-8 was performed under vacuum at 200 °C for 2 h. The thermal stability of the sample was studied using thermogravimetric analysis (TGA). Figure 1 shows the TGA results of ZIF-8 up to 1000 °C. The thermal stability of the sample was established up to about 350 °C. The X-ray pattern of the sample heat-treated at 500 °C indicates that this sample has decomposed mainly to ZnO.
Small-angle neutron scattering (SANS) measurements were made on a small amount of ZIF-8 powder encapsulated between two layers of a polyamide film (Glinka et al., Reference Glinka, Barker, Hammouda, Krueger, Moyer and Orts1998). The SANS measurements indicate porous features of 100 Å and larger within the powder grains. Depending on the uncertain powder packing density, these pores comprise 3 to 4% of the sample volume and have an associated surface area of 8 to 12 m2/cm3. While not affecting the high-resolution XRD structure analysis (and separate from the 11.6-Å porosity detected by XRD), this intermediate pore morphology probably provides the CO2 access to the finest pores.
High resolution synchrotron X-ray powder diffraction data were collected at 293 K using beamline 11-BM at the Advanced Photon Source (APS), Argonne National Laboratory using an average wavelength of 0.412210 Å. Discrete detectors covering an angular range from −6° to 16° with respect to the nominal 2θ were scanned over a 34° 2θ range, with data points collected every 0.001° in 2θ at a scan speed of 0.01°/s. The instrumental optics of 11-BM incorporate two platinum-striped mirrors and a double-crystal Si(111) monochromator, where the second crystal has an adjustable sagittal bend (Wang et al., Reference Wang, Toby, Lee, Ribaud, Antao, Kurtz, Ramanathan, Von Dreele and Beno2008b). The diffractometer is controlled via EPICS (Dalesio et al., Reference Dalesio, Hill, Kraimer, Lewis, Murray, Hunt, Watson, Clausen and Dalesio1994). A vertical Huber 480 goniometer positions 12 perfect Si(111) analyzers and 12 Oxford-Danfysik LaCl3 scintillators, with a spacing of 2° in 2θ (Lee et al., Reference Lee, Shu, Ramanathan, Preissner, Wang, Beno, Von Dreele, Lynn, Kurtz, Antao, Jiao and Toby2008). Capillary samples are mounted by a robotic arm and spun at ≈90 Hz (Preissner et al., Reference Preissner, Shu, Toby, Lee, Wang, Kline and Goetze2011). Data are normalized to incident flux and collected while continually scanning the diffractometer 2θ arm. A mixture of National Institute of Standards and Technology standard reference materials, Si (SRM™ 640c) and Al2O3 (SRM™ 676) is used to calibrate the instrument, where the Si lattice constant determines the wavelength for each detector. Corrections are applied for detector sensitivity, 2θ offset, and small detector wavelength differences in, before merging the data into a single set of intensities evenly spaced in 2θ.
The high-resolution pattern of ZIF-8 was fitted using the Rietveld refinement technique (Rietveld, Reference Rietveld1969) with the software suite GSAS (Larson and von Dreele, Reference Larson and Von Dreele1992). The reference pattern was obtained with a Rietveld pattern decomposition technique. In this technique, the reported peak positions are derived from the extracted integrated

Figure 2. (Color online) Rietveld refinement results: the row of tick marks indicates the calculated peak positions. The difference pattern is plotted at same scale as the other patterns up to 5°2θ. At 5°2θ, the scale has been magnified 20 times. At 2θ values higher than 10.7°, the scale has been magnified 50 times.
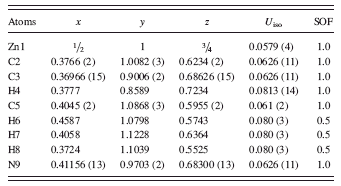
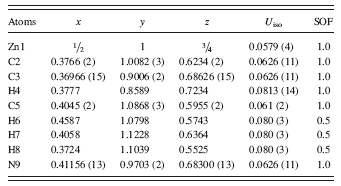
TABLE I. Atomic coordinates and displacement factors for C8H10N4Zn (cubic I-43m, with a = 17.01162(6) Å, V = 4932.08 Å3, and Z = 12). SOF represents site occupancy factor.

intensities and positions calculated from the lattice parameters. When peaks are not resolved at the resolution function of the diffractometer, the intensities are summed, and an intensity-weighted d-spacing is reported. Therefore, these patterns represent ideal specimen patterns. They are corrected for systematic errors both in d-spacing and intensity.
RESULTS AND DISCUSSION
Crystal structure
Figure 2 gives the results of the Rietveld refinement of the ZIF-8 sample. Tick marks indicate peak positions for the main ZIF-8 phase (bottom tick marks) and a small ZnO impurity (top tick marks). The difference pattern is plotted on the same scale as the other patterns up to 5°2θ. At 5°2θ, the scale has been magnified 20 times. At 2θ values higher than 10.7°,

Figure 3. (Color online) Crystal structure of C8H10N4Zn, ZIF-8, showing the large pore in a unit cell and a six-member aperture. The ZnN4 groups are shown with tetrahedral configurations (The dark spheres in the methyl groups and in the five-membered rings which are not part of the ZnN4 groups are carbon; the terminating spheres that are not filled are hydrogen). The size of the N, C, and O atoms and the pore were drawn with different scale.
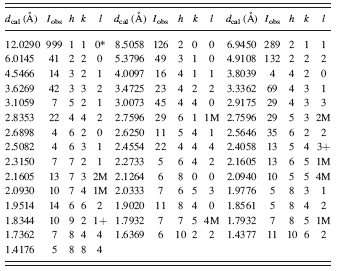
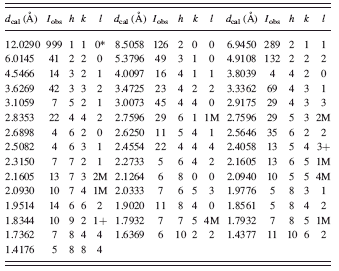
TABLE II. Diffraction pattern for C8H10N4Zn (ZIF-8) (cubic I-43m, with a = 17.01162(6) Å, V = 4932.08 Å3, and Z = 12).

the scale has been magnified 50 times. The refinement results are as follows: R wp = 0.0711, Rp = 0.0571, χ2 = 1.295 (28 variables, 20 999 observations), R(F) = 0.0509, and R(F 2) = 0.0646. The sample was found to contain 0.68(2) mass % of ZnO. Because of our preheat treatment of the sample prior to the synchrotron experiment, no H2O or other solvent molecule was found in the pores.
Based on the refinement results, the space group of C8H10N4Zn was confirmed to be cubic I-43m (Wang et al., Reference Wang, Cote, Furukawa, O’Keeffe and Yaghi2008a), with a = 17.01162(6) Å, V = 4932.08 Å3, and Z = 12. Table I gives the atomic coordinates and displacement factors for the atoms in the structure. Figure 3 depicts the crystal structure of ZIF-8, showing the large pore and a six-member aperture. The ZnN4 groups are shown as tetrahedra. This phase was found to be highly porous (low theoretical density of 0.92 g/cm3). ZIF-8 contains one nanosized cavity per unit cell; the cavity is located at the center of the cell and has a diameter of about 11.6 Å (the largest diameter that fits into the framework without contacting the van der Waals internal surface), with 3.5-Å diameter pores (Park et al., Reference Park, Ni, Côte, Cho, Huang, Uribe-Romo, Chae, O’Keeffe and Yaghi2006; Moggach et al., Reference Moggach, Bennett and Cheetham2009). Connected to each large nanopore are eight smaller channels.
High-resolution X-ray powder diffraction pattern
The high-resolution reference pattern is given in Table II. In this pattern, the symbols “M” and “+” refer to peaks containing contributions from two and more than two reflections, respectively. The symbol * indicates that the particular peak has the strongest intensity of the entire pattern and has been designated a value of “999.” The intensity values reported are integrated intensities rather than peak heights. This pattern has been submitted for inclusion in the PDF.
ACKNOWLEDGMENTS
Use of the Advanced Photon Source at Argonne National Laboratory was supported by the U. S. Department of Energy, Office of Science, Office of Basic Energy Sciences, under Contract No. DE-AC02-06CH11357. This work utilized facilities supported in part by the National Science Foundation under Agreement No. DMR-0454672.


