1. INTRODUCTION
Exploding wire systems have a long history in modern science, starting from the observation of a metallic wire length shortening after intense electrical currents through the wire at the end of the nineteenth century (Nairne, Reference Nairne1780) until more actual works, such as the use of exploding wires as explosive initiators (Liverts et al., Reference Liverts, Ram, Sadot, Apazidis and Ben-Dor2015). Some of the most unusual applications of an exploding wire system are controlled generation of large volumes of linear plasma (Smith et al., Reference Smith, Enright and Bodger2007), or the use of a wire as coil for a high voltage transformer (Sinton et al., Reference Sinton, Hammond, Enright and Bodger2009). One of the most promising technological applications of the exploding wire system is the generation of metallic nanopowders (Kotov, Reference Kotov2003), were some works dealing with Aluminum (Al) nanopowders show a dependence on the particle size with the deposited energy (Sindhu et al., Reference Sindhu, Sarathi and Chakravarthy2008).
On the other hand, with small groups of wires it is possible to reach very high pressures when the wires are properly arranged and surrounded by a dense medium such as water (Efimov et al., Reference Efimov, Fedotov, Gleizer, Gurovich, Bazalitski and Krasik2008; Krasik et al., Reference Krasik, Grinenko, Sayapin and Gurovich2006, Reference Krasik, Grinenko, Sayapin, Efimov, Fedotov, Gurovich and Oreshkin2008), and these pressures had been experimentally proven enhanced by the presence of a metallic pressure reflector close to the wire arrangement (Gilburd et al., Reference Gilburd, Efimov, Fedotov Gefen, Gurovich, Bazalitski, Antonov and Krasik2012). Exploding wires are the capital in the Sandia Z facility, because of the arrangement of hundreds of tungsten (W) wires in a circular shape to create a cylindrically imploding plasma which leads to one of the most intense artificial X-ray generators known today (Sinars et al., Reference Sinars, Cuneo, Yu, Lebedev, Cochrane, Jones, MacFarlane, Mehlhorn, Porter and Wenger2006). Such complicated systems are challenging to simulate and understand properly, the coupling between the electrical circuit delivering the energy and the plasma formation and evolution in the wire systems as one of the difficult problems (Jennings et al., Reference Jennings, Cuneo, Waisman, Sinars, Ampleford, Bennett, Stygar and Chittenden2010). Challenge is worth due to the insight in very special states of matter obtained in facilities with access to these devices, as the first experimental probing of the dense liquid deuterium insular-to-metal transition in the Sandia laboratory demonstrates (Knudson et al., Reference Knudson, Desjarlais, Becker, Lemke, Cochrane, Savage, Bliss, Mattsson and Redmer2015). With different scales on the range of possible energies delivered to the wire, exploding wires systems has been used to probe metallic properties near the boiling point (Chandler et al., Reference Chandler, Hammer, Sinars, Pikuz and Shelkovenko2002), explore the equation of state, and conductivity of non-ideal plasmas (Sheftman & Krasik, Reference Sheftman and Krasik2010; Stephens & Neuber, Reference Stephens and Neuber2012), and the generation of metallic elements X-ray spectra (Burkhalter et al., Reference Burkhalter, Oozier and Nagel1977).
Exploding wire process, therefore, has been extensively researched in many areas, from which a picture of the temporal process of plasma conversion from a cold, solid core has emerged within the years. From this description, the electrical energy transferred to the wire appears as an important parameter, as plasma properties show a strong dependence from this magnitude (Vijayan & Rohatgi, Reference Vijayan and Rohatgi1985; Sarkisov et al., Reference Sarkisov, Struve and McDaniel2005), while the surrounding medium influences the final energy deposition to the wire. Increase in medium density is followed by an increase in the deposited electrical energy on the wire thanks to the neutralization of voltage breakdown of the metallic vapor in denser media (Ter-Oganesyan et al., Reference Ter-Oganesyan, Tkachenko, Romanova, Mingaleev, Shelkovenko and Pikuz2005).
Exploding wire temporal evolution starts with the initial Joule heating of the solid wire, followed by the generation of metallic vapor from the wire surface that became plasma due to the electrical field between the wire poles. Then the, current is transferred to the plasma (Duselis & Kusse, Reference Duselis and Kusse2003), and the remaining solid core is transformed by the plasma wave traveling inwards, meanwhile electrical energy transfer is halted due to the low resistance of the plasma sheath surrounding the wire core.
This work is devoted to the experimental observation of electrical energy transference from the circuit to the wire solid or liquid core after plasma formation for copper (Cu), tungsten, and molybdenum (Mo) wires. It is distributed as follows: after this section, Section 2 deals with the experimental setup and data analysis, meanwhile in Section 3, results are presented, and in the last section some conclusions are presented.
2. EXPERIMENTAL SETUP
ALEX experimental construction is a typical exploding wire setup. The wire is surrounded by atmospheric air and has a fixed length of 3 cm. Two capacitors of ~1.1 µF each are connected in parallel with a high voltage source, which in these experiments delivered a maximum of 25 kV. Spark gap trigger separates this circuit section from the exploding wire supports, which finishes with the earth pole connection.
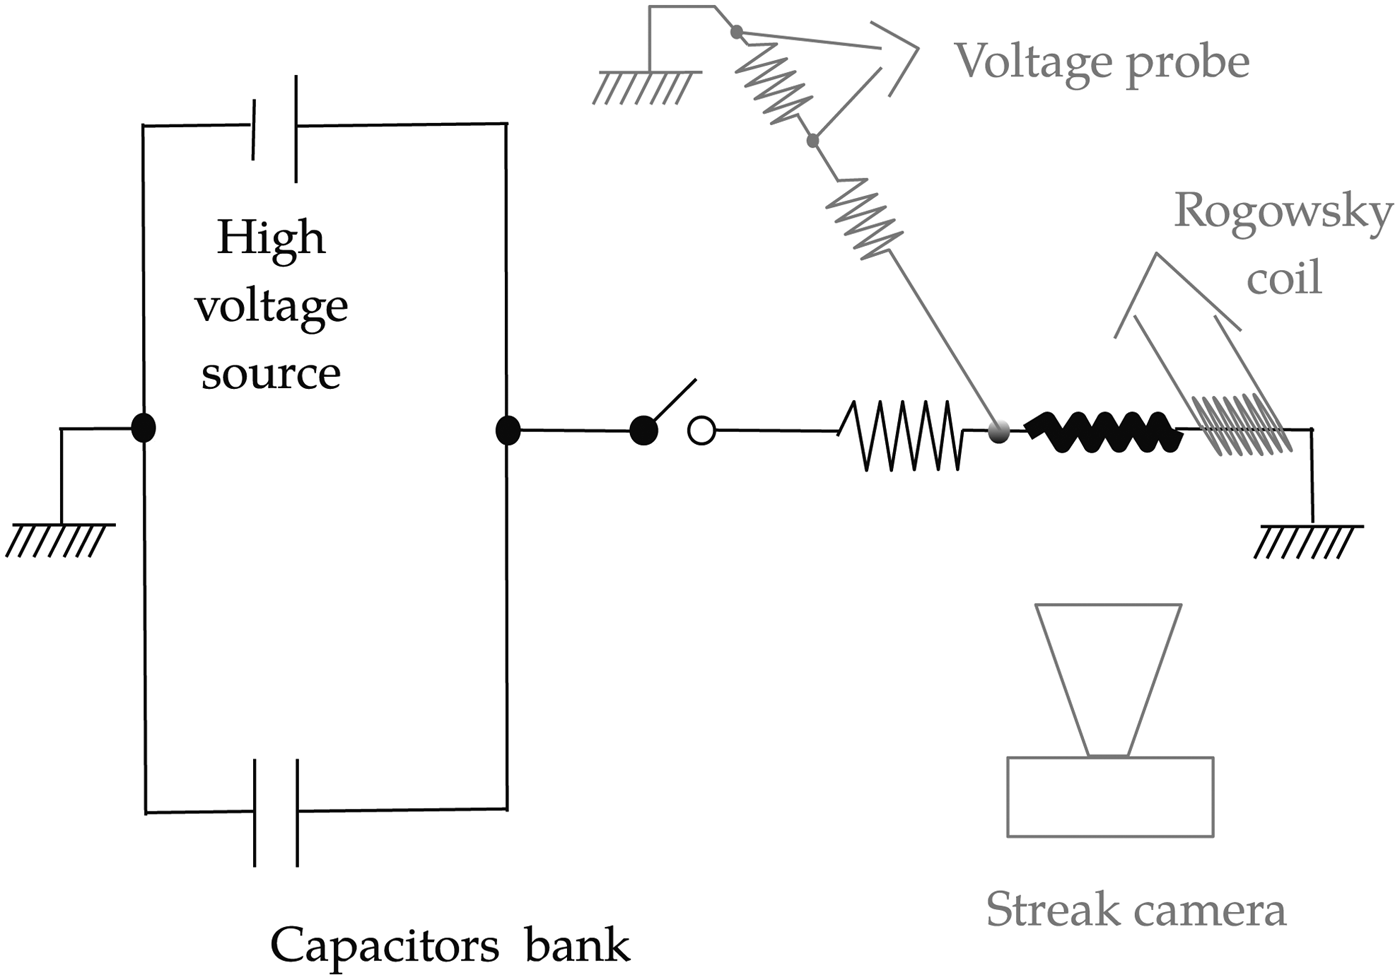
In order to diagnose both the electrical circuit and plasma formation, some probes had been attached to the main circuit, see Figure 1. A resistive divider as voltage probe and a Rogowski coil for current measurements were placed in direct contact with the wire holders, in order to observe the voltage and current values in the wire. The two sensors had been intentionally placed close to the wire holders, in order to prevent the interference of other parts of the circuit with the signals and to overcome the difficulties in the data interpretation, such as the significant current loses observed in (Jennings et al., Reference Jennings, Cuneo, Waisman, Sinars, Ampleford, Bennett, Stygar and Chittenden2010). Both probes had been made and calibrated in the laboratory, with the intensity derived from the Rogowski coil signal by means of numerical integration. In addition, to allow the synchronization with other optical sensors, a fast photodiode signal (rise time ~1 ns) is synchronized and recorded with the electrical signals. Finally, a streak camera focused on the wire allows the recording of the plasma wire expansion using visible light plasma emissions.

Fig. 1. ALEX electrical and probes scheme.
Digital streak camera photos are first scaled from pixel to space–time coordinates and then the radius is obtained using a simple Octave script that also approximates the radial expansion to the function ![]() $r = \sqrt {{\rm \beta} \cdot t}, $ a result obtained by considering the self-similar wire plasma expansion, as it has been proved to be a good approximation earlier (Bennett, Reference Bennett1969), despite problems with the validity of the self-similar hypothesis in such system (Bennett, Reference Bennett1961).
$r = \sqrt {{\rm \beta} \cdot t}, $ a result obtained by considering the self-similar wire plasma expansion, as it has been proved to be a good approximation earlier (Bennett, Reference Bennett1969), despite problems with the validity of the self-similar hypothesis in such system (Bennett, Reference Bennett1961).
From this radial approximation and within the self-similar hypothesis for pressure, density, and velocity of the plasma expansion, the kinetic energy of the plasma expansion can be estimated using the formula:
where β is the previously defined constant, ρ is the air density as it is against this fluid that the expansion is made, and l w, the wire length (Bennett, Reference Bennett1958).
On the other hand, more complicated calculations are to be made with the electrical signals as the voltage registered by the resistive divider is the addition of two terms, one the voltage that is dynamically consumed in the exploding wire process and other, voltage used by the static parts of the circuit. Therefore, it is necessary to remove this last term from the resistive divider signal.
To do so, the total inductance of the circuit is to be frequently used, as the wire inductance can be considered negligible. In the work presented here, a different method has been employed and the resulting signal has a clear reduction in the noise level, so it is worth to dedicate a few words to its description.
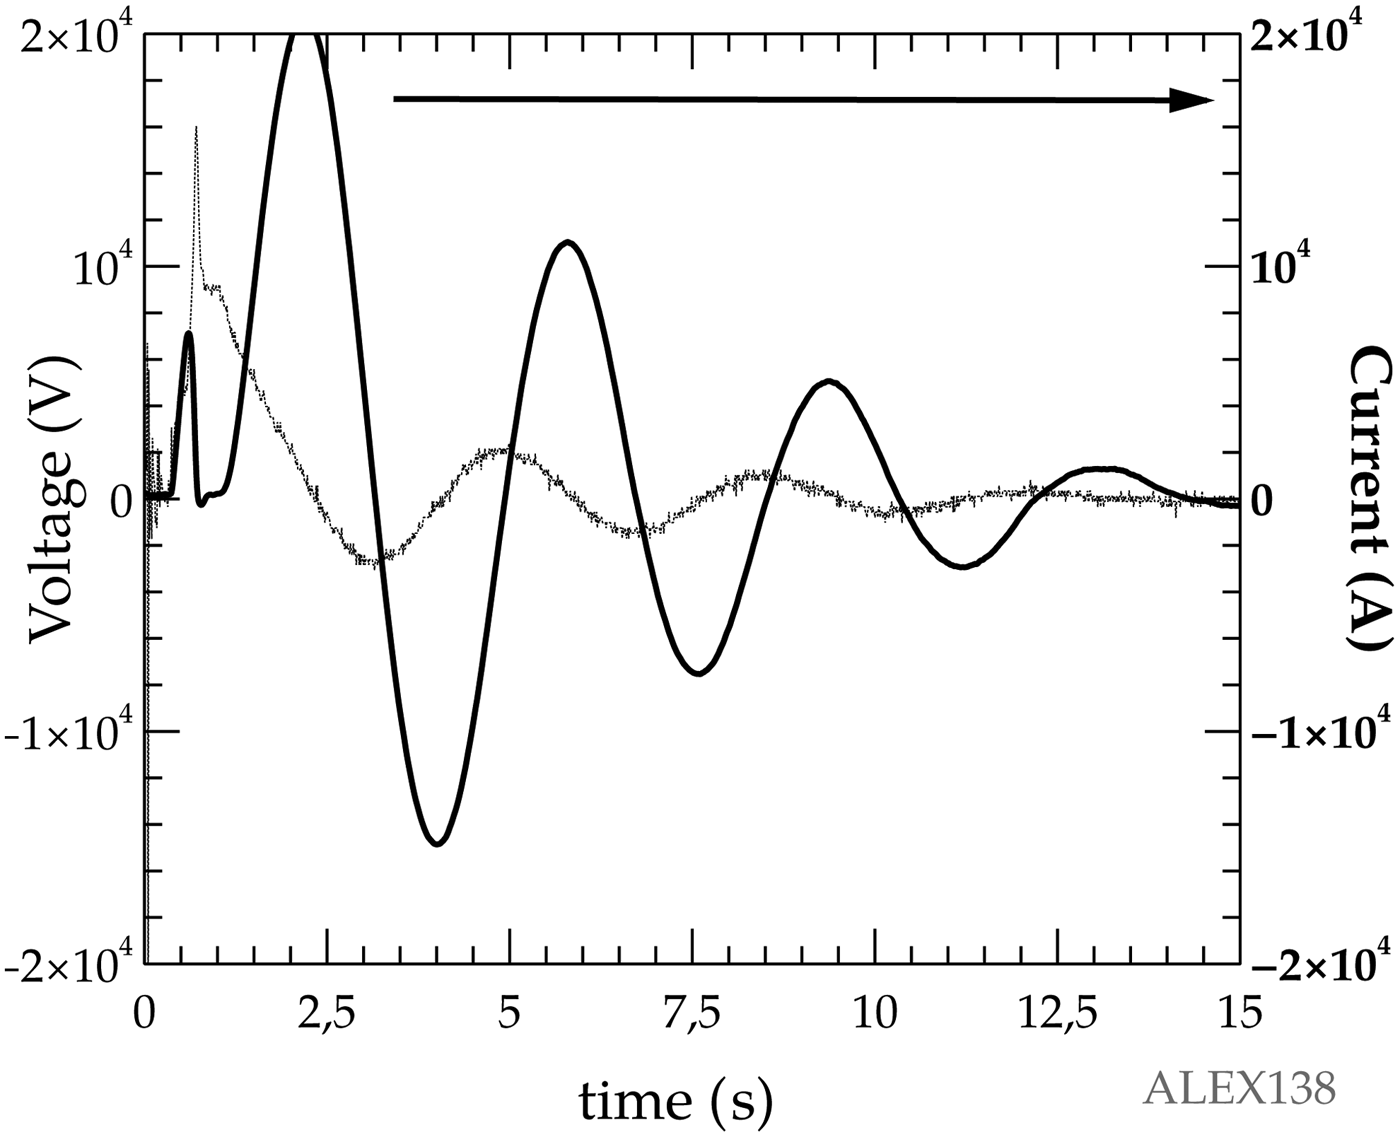
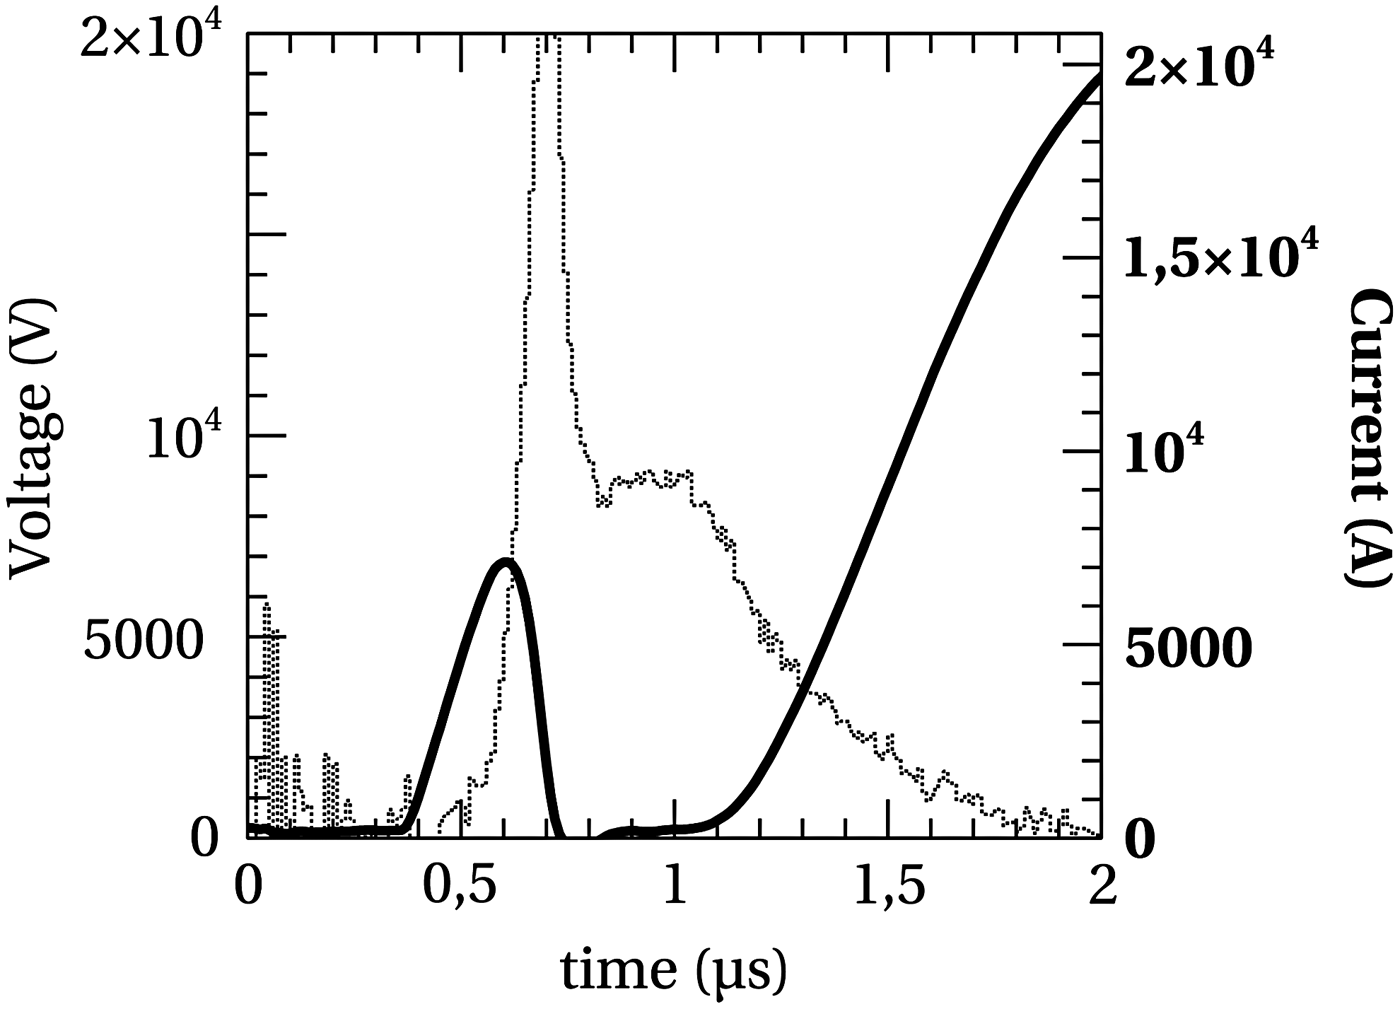
Let us consider the voltage and current signals recorded by the sensors, of which a typical example is presented in Figure 2. Then it is possible to realize that the last part of the voltage time evolution is dominated by a simple exponential decay, that can be calculated by ![]() $l \cdot \displaystyle{{\partial I} \over {\partial t}} + r \cdot I$, with l and r as the constant inductance and resistance of the static circuit part, formed mainly by the wire holders and the space between them, meanwhile I is the current that passes through the metallic wire. As both the values of the current and its derivative are simultaneously measured, it is possible to adjust the values of l and r so as to make the measured final voltage signal coincide with the previous expression by means of a minimal square regression, and then subtract this voltage value from the total, in order to obtain the voltage circulating through the wire, as Figure 3 shows, is far from an oscillation, due to the highly dynamic nature of the exploding wire process. As was typical in our experiments, the so called dark current pause (Bibbo et al., Reference Bibbo, Giovambatista, Gomez, Olivieri, Tibaldi, Bernal, Pouzo and Bilbao1998) is clearly observed.
$l \cdot \displaystyle{{\partial I} \over {\partial t}} + r \cdot I$, with l and r as the constant inductance and resistance of the static circuit part, formed mainly by the wire holders and the space between them, meanwhile I is the current that passes through the metallic wire. As both the values of the current and its derivative are simultaneously measured, it is possible to adjust the values of l and r so as to make the measured final voltage signal coincide with the previous expression by means of a minimal square regression, and then subtract this voltage value from the total, in order to obtain the voltage circulating through the wire, as Figure 3 shows, is far from an oscillation, due to the highly dynamic nature of the exploding wire process. As was typical in our experiments, the so called dark current pause (Bibbo et al., Reference Bibbo, Giovambatista, Gomez, Olivieri, Tibaldi, Bernal, Pouzo and Bilbao1998) is clearly observed.

Fig. 2. Typical total voltage (points) and current (continuous) traces.

Fig. 3. Wire voltage (points) and current (continuous) signals. Notice the change in time scale.
With these two magnitudes it is possible to obtain interesting derivate magnitudes, namely in this work, the power that circulates through the exploding wire, and its resistance and resistivity. Power can be easily calculated, as it is the integral of the product of the voltage and current magnitudes. Resistance and resistivity cannot be calculated directly, as some assumptions and approximations are needed for their deduction from the measured values of voltage and current.
Exploding wire systems possess an inductance that changes in time, therefore the wire voltage can be written as:
where L and R are the wire inductance and resistivity, respectively. Resistance can then be obtained as follows:
Consequently, taking the typical values into account for the relevant magnitudes, negligibility of the subtraction terms in the above equation is obvious after some trivial algebra. Therefore, resistance can be approximated from the value obtained by considering the wire as resistor only.
Estimation of resistivity is not so easy, as the concept itself is more complex. Note that the electric field is:
where V is the scalar potential and A the vector potential. Then, the voltage difference along a given path is:
 $$\Delta {V_{{\rm AB}}} = - \int_A^B \left( {{\bf E} + \displaystyle{{\partial {\bf A}} \over {\partial t}}} \right) \cdot {\rm d \bf l}.$$
Since the current diffuses from the boundary, it holds that during diffusion, on the axis
Therefore, using a path along the axis of the wire, see Figure 4, and assuming that the axial coordinate (z) is an ignorable coordinate we get
where l w is the length of the wire. Further, using an Ohm's law for the wire (whereas is solid, liquid, gas, or plasma),
where μ is the resistivity and j is the current density, it is possible to obtain:
From the above equation a lower limit to the resistivity of the wire may be deduced. Assuming that during the rise of the current, when the current is diffusing towards the axis, the current density on the axis is lower than the mean value of the current density on the whole wire, that is (j z)axis <I/s w, with s w the section of the wire, therefore:
A legitimate question arose with the plasma presence, because then the electric field between the electrodes could be approximately zero, an apparent contradiction with the previous equation. But although at the border of the plasma it is possible to think that resistivity approaches zero, μ ≈ 0, using Eq. (5) the final result is:
Now, it is clear that the voltage across the boundary is almost due to the electromotive force (emf) caused by the electromagnetic induction (Faraday's law of induction). Note that the emf is due to both the movement of the boundary and simultaneous current diffusion through the wire, since both produce a variation of the magnetic flux enclosed by the border. Therefore, Faraday induced voltage is a missing parameter, following Figure 4 such voltage can be calculated as the integral of the electric field along the closed line that forms the hatched rectangle in the figure. So in the vertical lines, it is legitimate the assumption of electric field as negligible, but on the horizontal lines this is not the case as current density is distributed along the surface, forcing its final value to be different from zero. Therefore, Faraday induced voltage and then the electric potential between the electrodes is nonzero despite the fact that there is an expanding plasma between them.
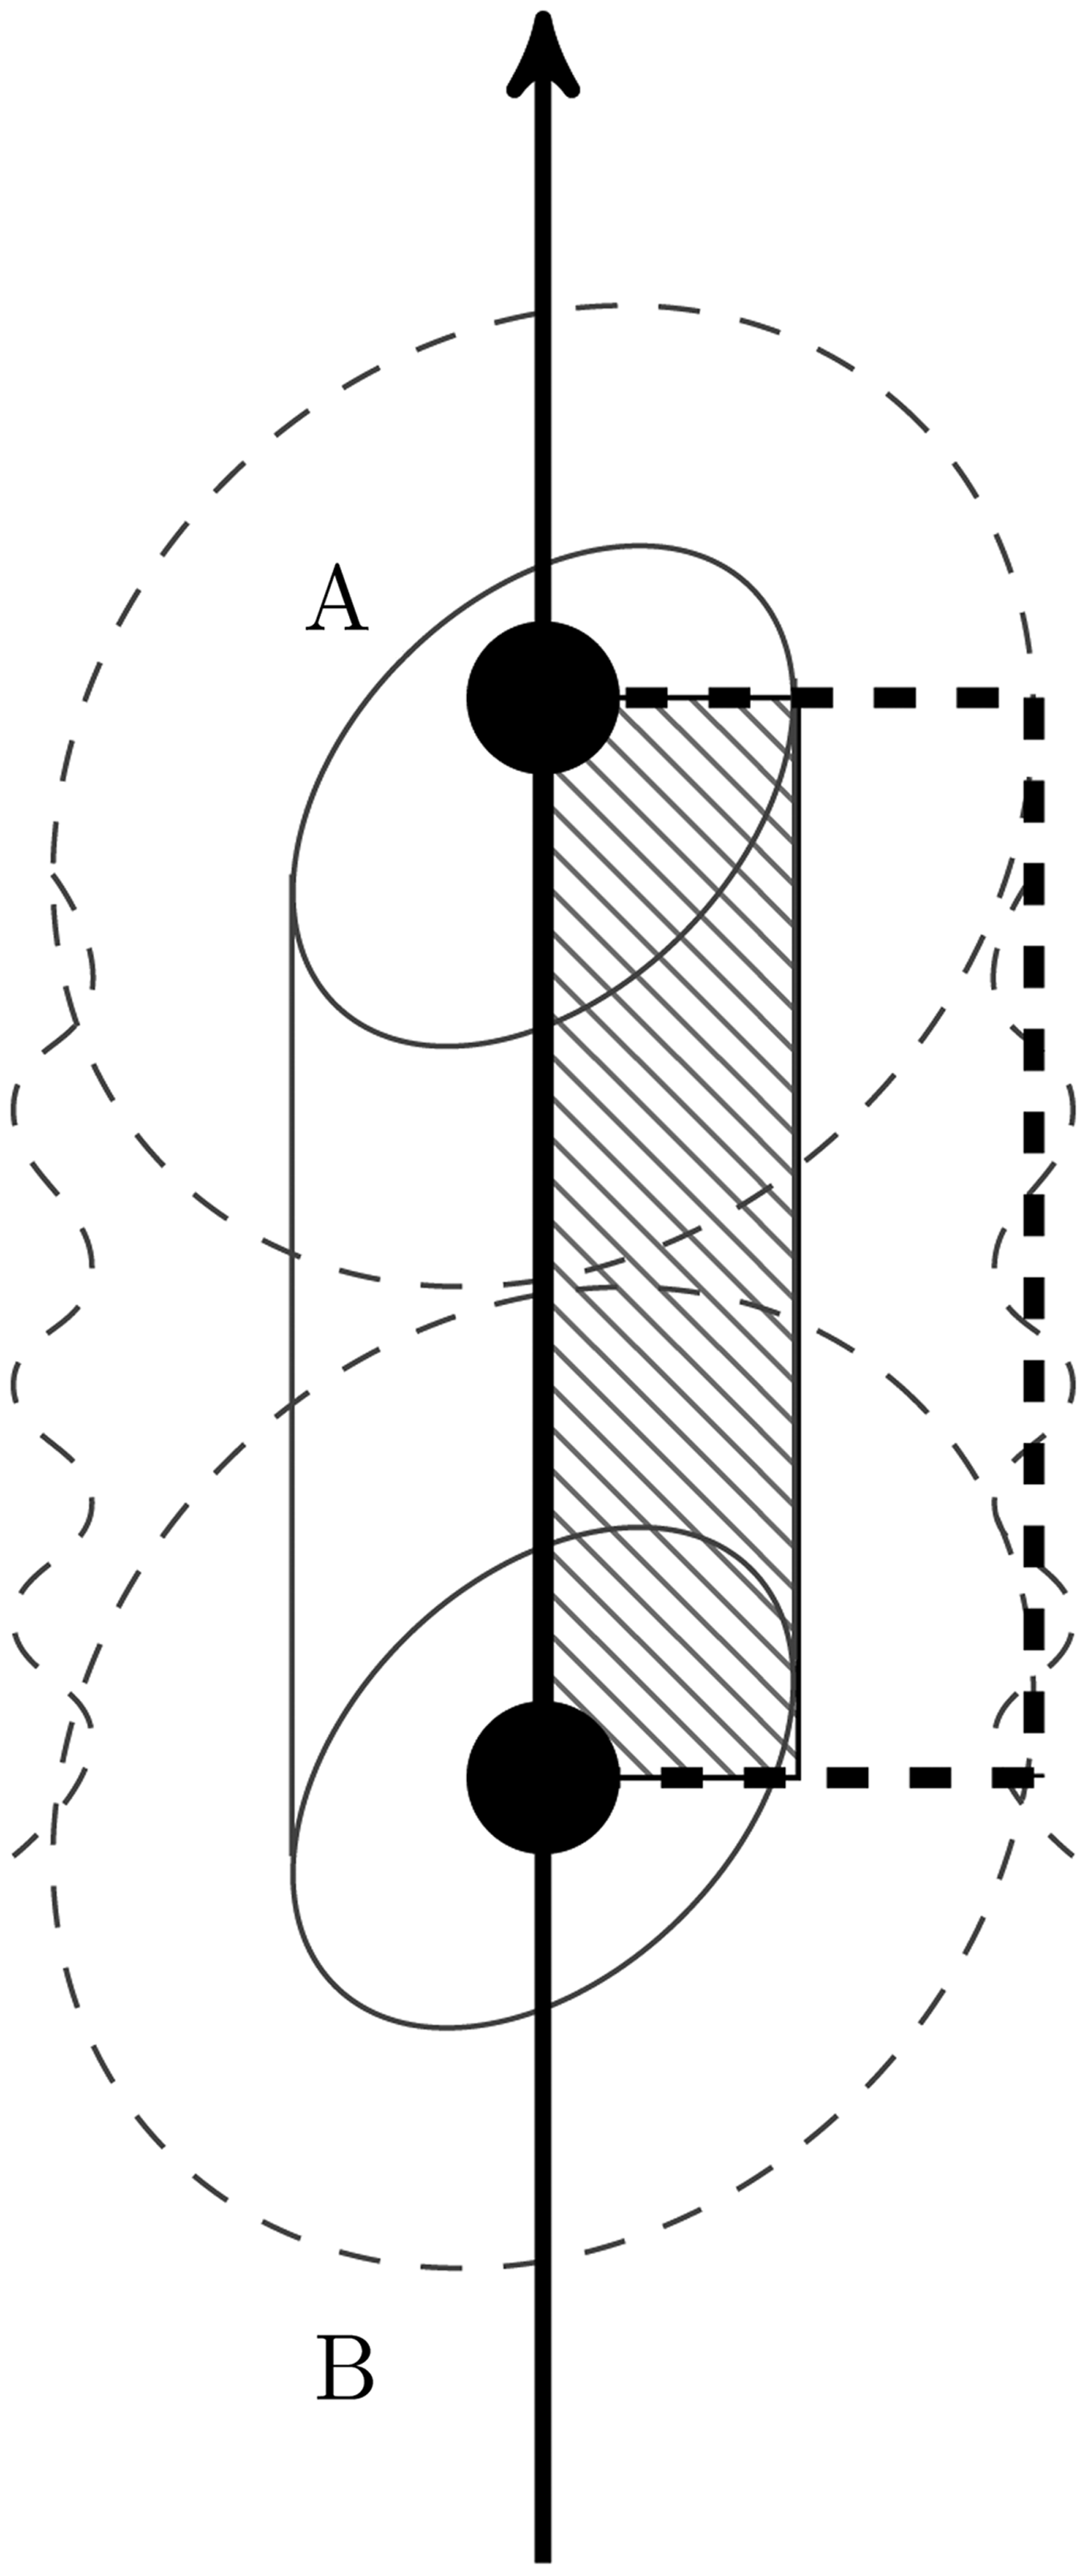
Fig. 4. Wire resistivity scheme. Continuous thick line, internal integration path; dashed thick line, external.
3. RESULTS AND DISCUSSION
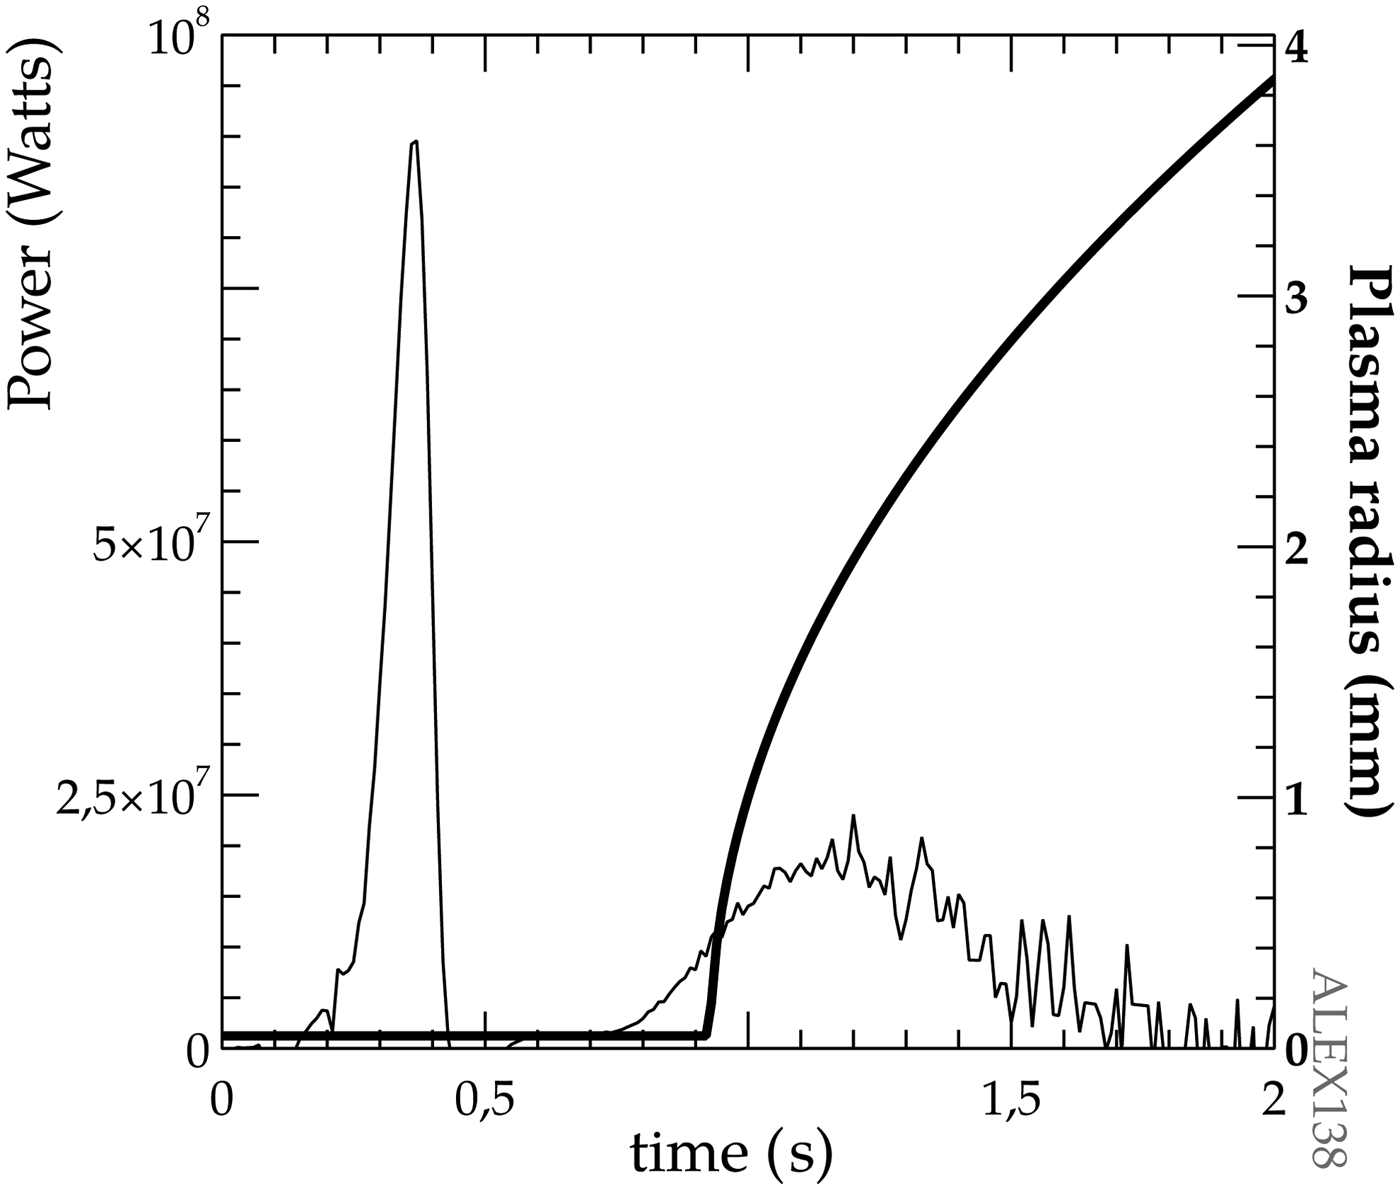
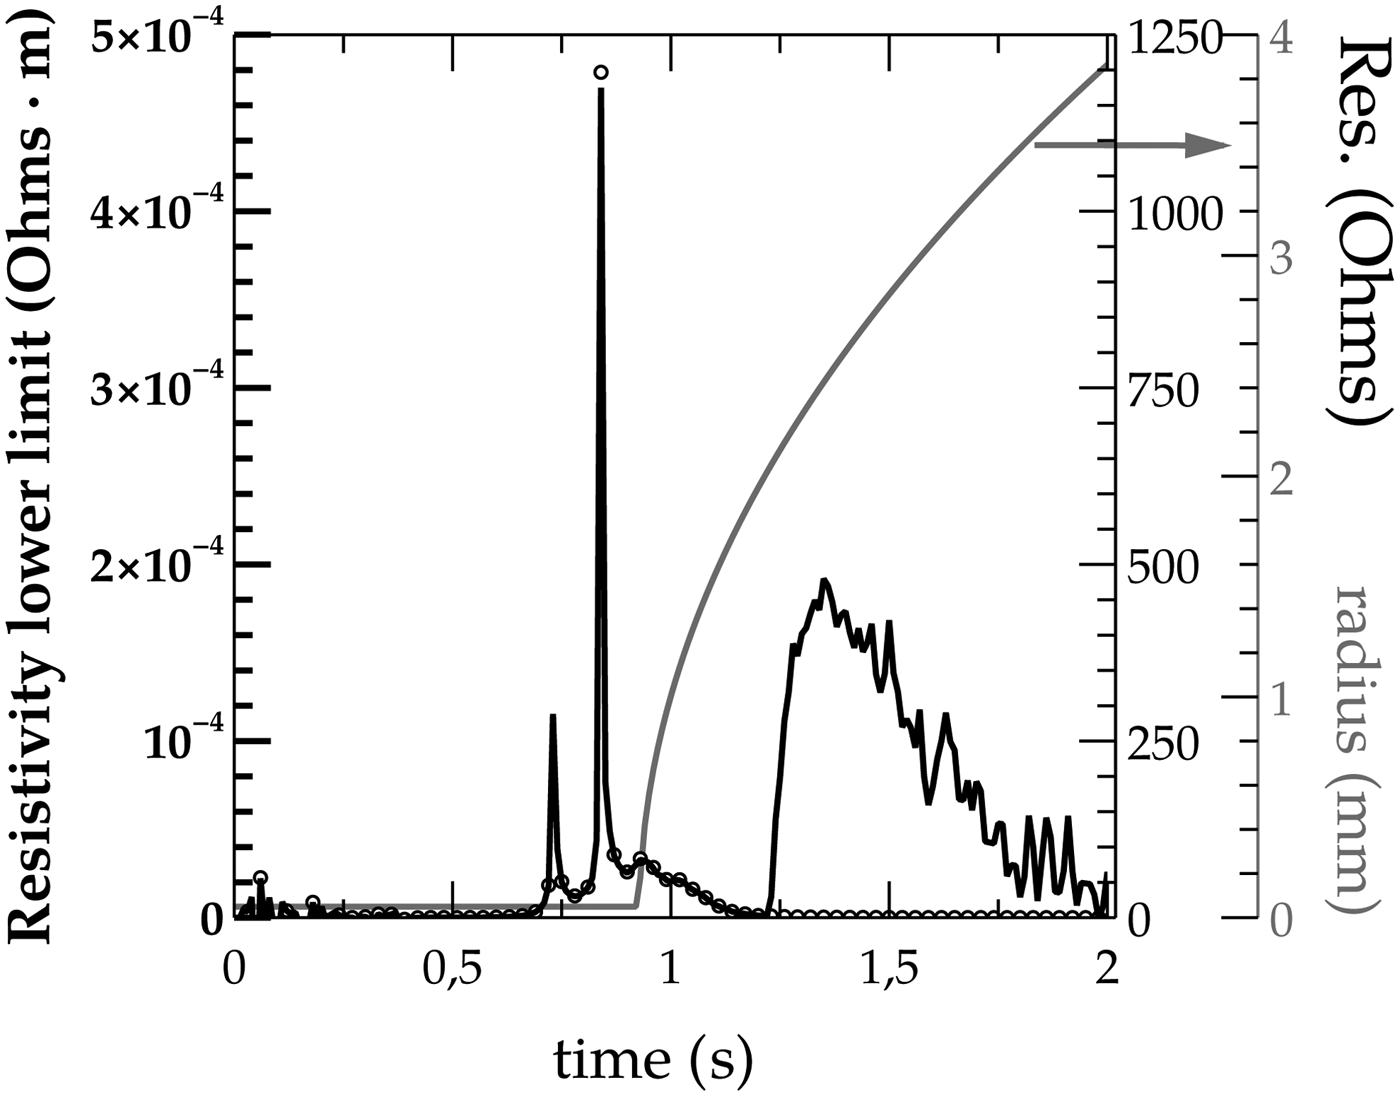
Under the experimental conditions of the experimental series of this work, a significant amount of electrical energy is delivered to the wire after the beginning of the plasma expansion, as Figure 5 shows for a typical situation presented for a Cu wire of 100 µm of diameter when the capacitors were charged to 10 kV. Simultaneously, the low limit resistivity is too high to pertain to a plasma with values of an order of magnitude higher than the usual in a plasma, as measured by Esaulov et al., Reference Esaulov, Johnson, Safronova, Safronova, Kantsyrev, Weller and Ouart2011. Figure 6 shows the measured values of resistivity for the previous experiment. These two measurements clearly indicate that after plasma generation the wire system is still absorbing the electrical energy.

Fig. 5. Electrical power (thin line) and radius (thick line) on a typical experiment. Notice the presence of delivered power after the radial expansion of the plasma has started.

Fig. 6. Resistivity (continuous line), resistance (points), and radius (gray line). Visible is the initial resistivity peak as the wire is heated.
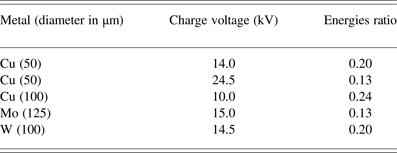
On the other hand, measurements of the kinetic energy with the method explained above, imply that the kinetic energy released to the wire must be done instantaneously, and without further energy additions to the moving material. This first condition, realistically means that the energy deposition rate is much faster than that of the following expansion, meanwhile the second one is to be applied to the portion of the wire that expands or moves; therefore, the fact that the measured kinetic energy is always smaller than the total electrical energy delivered to the wires, see Table 1, can be understood under the assumption that not all the wire mass take part on the self-similar kinetic release of energy observed in the streak images. Implicit in the data from the table is an absence of correlation between kinetic energy of the plasma and electrical energy delivered to the wire, indicating that the relation between both energies depend on more parameters.
Table 1. Metals and their energies ratios
On the other hand, as Table 2 indicates, the skin depth of the employed metals is either shorter or on the same order of the wire's diameters. Under such conditions, the ablative model affirms that the wire should ablate fast and in a continuous manner, in contradiction with the previous statements about the wire ablation mass.
Table 2. Skin depth and diameters of the employed wires

Indirect estimation of the wire fraction still on the core after the plasma generation is obtained from the ratio of two energies in this work. Namely, ratio of energy at the first power peak to the sum of the energy necessary to vaporize the wire with the self-similar kinetic energy and, as Figure 7 shows, this fraction is not very large, in coincidence with previous works (Sinars et al., Reference Sinars, Hu, Chandler, Shelkovenko, Pikuz, Greenly, Hammer and Kuss2001; Chandler et al., Reference Chandler, Hammer, Sinars, Pikuz and Shelkovenko2002). On the other hand, considering the ablation model outlined in the previous paragraphs, the fraction of energy absorbed by the wire should be larger for smaller diameters of the same material, because the ablated part of the wire is larger. However, the experimental results of this paper demonstrates the opposite behavior as the fraction of energy absorbed by Cu wire is significantly larger for the thicker diameters of 100 µm. In addition, although all the energy fractions are concentrated in a relatively small area, there is a clear tendency to be smaller as the larger the capacitors voltage gets, therefore as the initial energy increases the energy fraction decreases. Such behavior is not easy to understand within the frame of the ablation model, as an increase of the initial energy available to make the plasma should be followed by a larger amount of energy in the first power peak, and conversely a larger value of fraction energy presented in Figure 7.
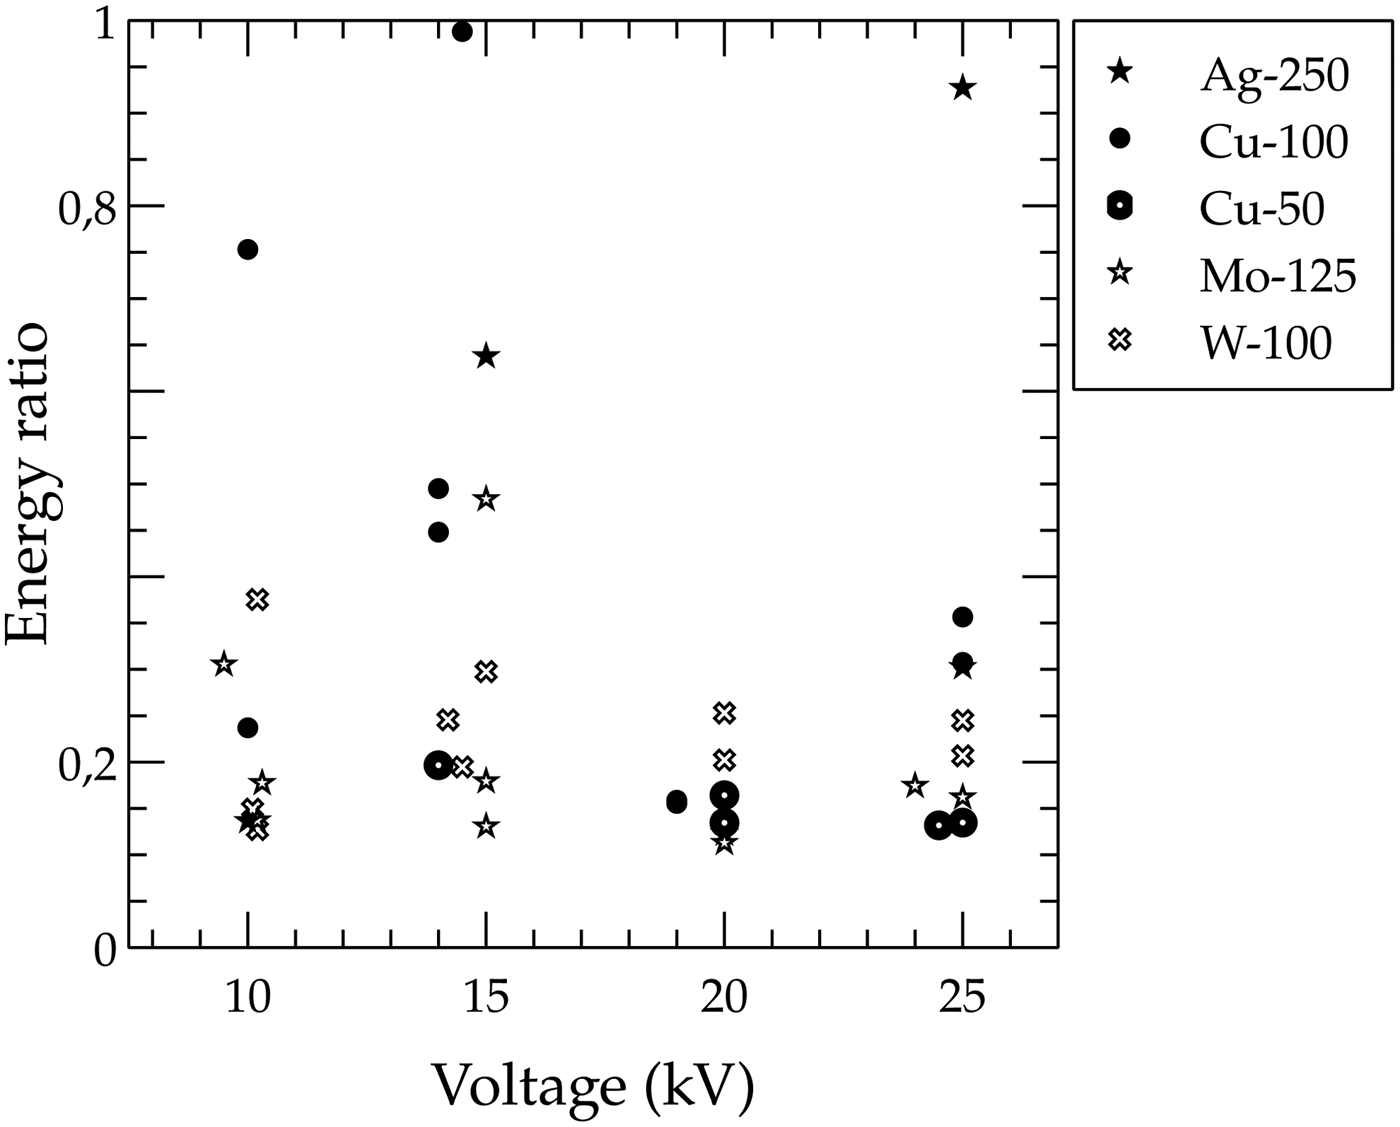
Fig. 7. Ratio of energies delivered in the first power peak to energy necessary to create and accelerate the plasma. Symbol legend indicates material and diameter in micrometers.
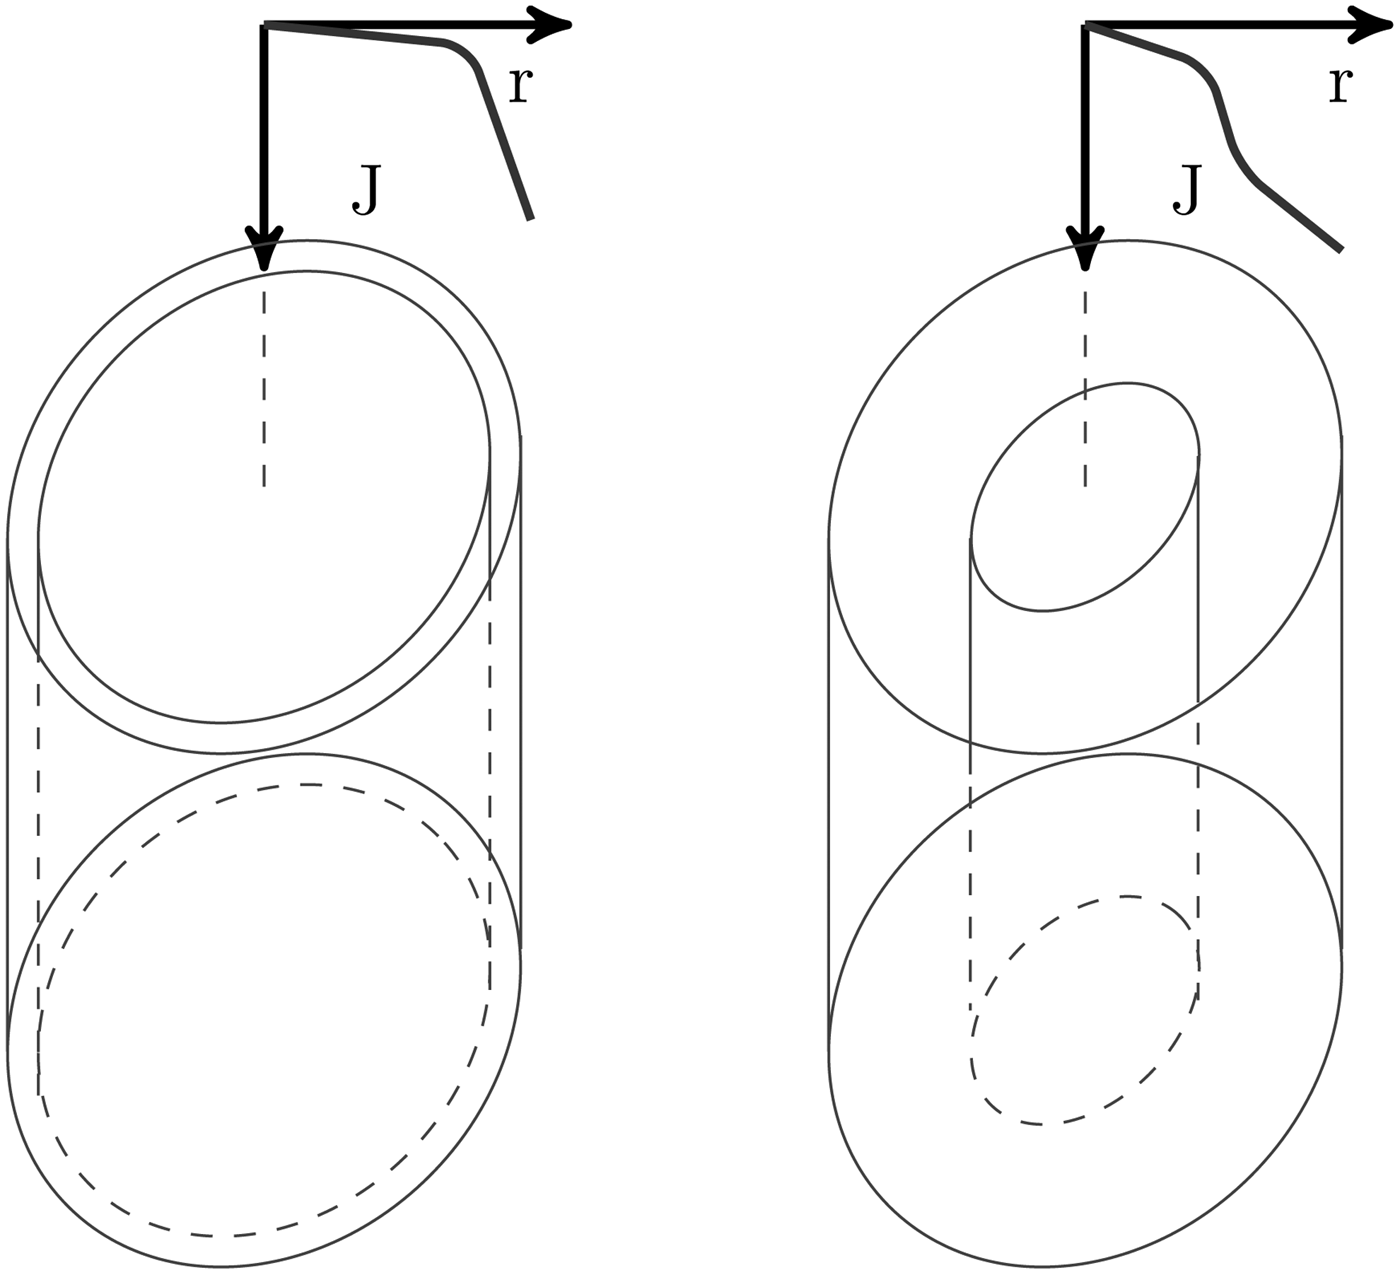
In order to overcome these contradictions and from the experimental results shown here, we interpret them with a two stages ablation process. These processes start with the Joule heating of the wire surface because of the current circulating through it, frequently called the Ohmic phase. As the current value increases, the surface of the metallic wire becomes liquid and from there, it evaporates and creates a gas and finally a plasma region, meanwhile there is still a solid or liquid metallic wire core. With the calculated values for the skin depth shown on Table 2, current density on the wire system should be diffused through the entire the volume. Therefore, the current distribution will be mainly a function of the resistivity difference between the plasma and non-plasma parts of the wire system, effectively halting the current absorption of the non-plasma part due to its much higher resistivity. Our experimental data otherwise, indicates that there is a dynamical current diffusion time that is much larger than the one calculated for the stationary case. Such larger diffusion time allows for the inner solid core to maintain its current fraction for a longer period, therefore absorbing electrical energy despite of the external plasma presence. In our understanding, this means that there is a second plasma generation phase, fueled by the remaining electrical current flowing through the inner solid or liquid metallic core, see Figure 8.

Fig. 8. Illustration of the two stages ablation process in a metallic wire, with the current density overimposed.
4. CONCLUSIONS
In this paper, new experimental data on the exploding wire phenomena focused on the created plasma dynamics and its relation with the wire core behavior are presented. Such data first allow for the confirmation with diverse chemical elements and energies of previous observations on the auto-similarity of the radial temporal expansion of the plasma, extracted from its self-generated light, confirming data scattered across different previous works (Bennett, Reference Bennett1958, Reference Bennett1961; Chandler et al., Reference Chandler, Hammer, Sinars, Pikuz and Shelkovenko2002). On the other hand, the combination of experiments on the exploding wire electrical circuit with plasma dynamic radial expansion obtained from streak data shows the existence of electrical energy transferred to the non-plasma part of the exploding wire, independent of its thermodynamical state.
ACKNOWLEDGEMENTS
The authors thank the fruitful discussions with A. R. Piriz and the technicians of the Engineering School of Ciudad Real and the INEI Institute, David Bocharán Murillo and Pedro Giménez de los Galanes García Muñoz for their help with the experimental facility. This work has been performed partially with financial support of the Spanish Ministerio de Economía y Competitividad project reference ENE2013-45661-C2-1-P and by the JCCLM of Spain (Grant No. PEII 11-0056-1890).


