I. INTRODUCTION
In the last decade visible light communication (VLC) systems have got a huge attention. The goal is to unite the lighting and the data transmission (e.g. Wi-Fi) systems. The light-emitting diode (LED) light sources can be modulated and it makes these sources capable to communications. If the lighting system is turned into a communication link, the existing data communication system can be replaced by the VLC system. VLC can be much safer than a Wi-Fi because it cannot intercept from the next room. Lights do not go through the walls therefore the VLC systems can be easily separated and the interference between the two systems is negligible. The spectrum of the visible light is not restricted by any regulation, which makes the system design easier. We have to only keep in mind the eye safety regulation and the lighting system standards. Because the VLC is used together with the existing lighting systems it is not easy to find a suitable cooperation between the two systems. Lighting systems intend to use the energy as efficiently as possible therefore it is not allowed e.g. an on-off keying (OOK) modulation which is turned on only half of the time period. We have to use those kinds of modulation formats, which modulate the LEDs and change the light emission minimally. The other drawback of VLC is the capacitance of the LED source. LEDs are designed for constant lighting and not with fast changes. Because of their physical structure, high brightness power LEDs have a huge capacitance. It can be decreased but an additional electrical circuit is needed. The phosphor layer of the white LEDs highly degrades the LED frequency response.
Critical points of a VLC system are the modulation formats and the disturbances e.g. from the lighting system. Because the VLC and indoor lightening will work parallel, we have to know how the indoor lightening will affect the data transmission. Fluorescent and LED lamps have a driving circuit which causes undesirable modulation on the emitted light [Reference Moreira, Valadas and de Oliveira Duarte1–Reference Hauske and Jondral3]. The amplitude and frequency of these components have to be investigated to minimize their effects to the VLC system. Type of the modulation is one of the most important points of a VLC system. High data rate transmission requires complex modulation formats e.g. quadrature amplitude modulation (QAM), phase shift keying (PSK) which make the system more complex and more sensitive for any other light disturbances. However the easiest OOK is not desirable, because it is turned off half of the time.
In earlier works OOK, pulse width modulation (PWM) and pulse position modulation (PPM) were studied and compared [Reference Kumar and Lourenco4, Reference Hayesa, Ghassemlooya and Seedb5], because of the system simplicity. However, these modulations are sensitive for the ambient lights and interferences. To decrease their effect different coding [Reference Chow, Yeh, Liu and Huang6], filtering [Reference Funahashi, Kobayashiy, Okaday and Katayama7], and channel estimation [Reference Verma, Shandilya and Singh8–Reference Le Minh, Ghassemlooy, O'Brien and Faulkner12] are applied and used in the receiver circuit [Reference Verma, Shandilya and Singh8, Reference Zhao and Vongkulbhisal9]. Channel estimation can be done by orthogonal frequency division multiplexing (OFDM) easily, but it increases the system complexity. Higher order modulation formats e.g. M-QAM, M-PSK, are usually applied in OFDM transmission [Reference Kim and Jung10, Reference Elgala, Mesleh, Haas and Pricope11, Reference Elgala, Mesleht and Haast13]. In our paper we examined these modulation formats using a subcarrier as in a radio over fibre system. This solution makes the system easier and cheaper than an OFDM based one and can decrease the system sensitivity for the interferences such as in the case of a sub-carrier PPM transmission [Reference Kumar and Lourenco4]. The performance of a sub-carrier based M-QAM or M-PSK transmission will be shown in Section IV. The error free performance of the link will be scaled by the distance instead of the commonly used signal to noise ratio (SNR). In field application the maximal distance versus. bit error rate (BER) gives better system description. On the other hand the SNR can be calculated from the BER and vice versa, therefore, we think scaling with the distance is better.
We examined all of the former mentioned problems. In Section II we studied different indoor light sources and their disturbances. The amplitude and the frequency of the disturbances from different light sources were measured and compared. Our results were compared with earlier works and we observed some major deviations in the electrical spectrum. In Section III the bandwidth of the applied LED is investigated. In Section IV the typical modulation schemes were compared and we tried to find the most suitable one for the VLC. The OOK modulation was examined too as a reference one for the other complex modulation forms. In the experimental work two kinds of receivers were tested. A fast response receiver (up to 1 GHz), which contains a small photodiode, needs a lens to focus the light into the photodiode. If the light beams are not collimated the focus point will change depending on the transmitter and the receiver distances. Therefore the system is not mobile or an automatic focusing mechanism should be built into the receiver. To avoid this high cost system, we changed the photodiode to a larger one. In this case the receiver will be more mobile, but the large active area of the photodiode causes large built in capacitance, therefore the system response will be slower.
II. DISTURBING LIGHT SOURCES
All light sources, which are not transmitting our data, emit disturbing signals and noise so they degrade the quality of the signal transmission. The disturbing light sources can be sorted into two main groups. The natural light sources e.g. sun belongs to the first group and the artificial light sources e.g. incandescent lights are in the other group. VLC systems are designed for indoor use therefore the effect of the sun is marginal but it is not negligible in a DC coupled receiver. The DC component of the detected signal by natural lights can be filtered out easily with a capacitor, therefore in the following investigations the effect of this group element will be left out of the further considerations.
The second group contains the artificial light sources such as fluorescent lights, incandescent lights, and compact fluorescent lights. Presently as the LED lighting systems are not used widely, the VLC systems works parallel with these conventional lightening solutions. Consequently, the disturbance caused by artificial lighting cannot be neglected. Presumably, this situation will not be changed in the near future due to the enormous cost by replacing the existing lighting systems by applying LEDs. Therefore it is important to know the place of the interferences coming from the artificial light and can disturb the communication. These interferences were investigated already in [Reference Moreira, Valadas and de Oliveira Duarte1–Reference Hauske and Jondral3]. The result of our examination differs in some points from the results of the before mentioned literatures. It is because the manufacturing technology of the fluorescent lights changed in the last decade. A DC coupled detector was used for the measurements which can detect signals up to 4 MHz (−3 dB point). To minimize the natural light effect, which cause DC component and any possibility of interfering lights, the measurements were made in a dark room. The compact fluorescent lights (CFL) and incandescent lamps were 40 cm far from the detector and they were in the same axis with it. In the measurements we used the laboratory fluorescent light, which was built in the ceiling, therefore the distance between them was 220 cm. That does not affect the results of the measurements because, the ceiling lamps are designed to light a large area so its emitted light is much higher than that of the other tested lamps.
A) Incandescent lights
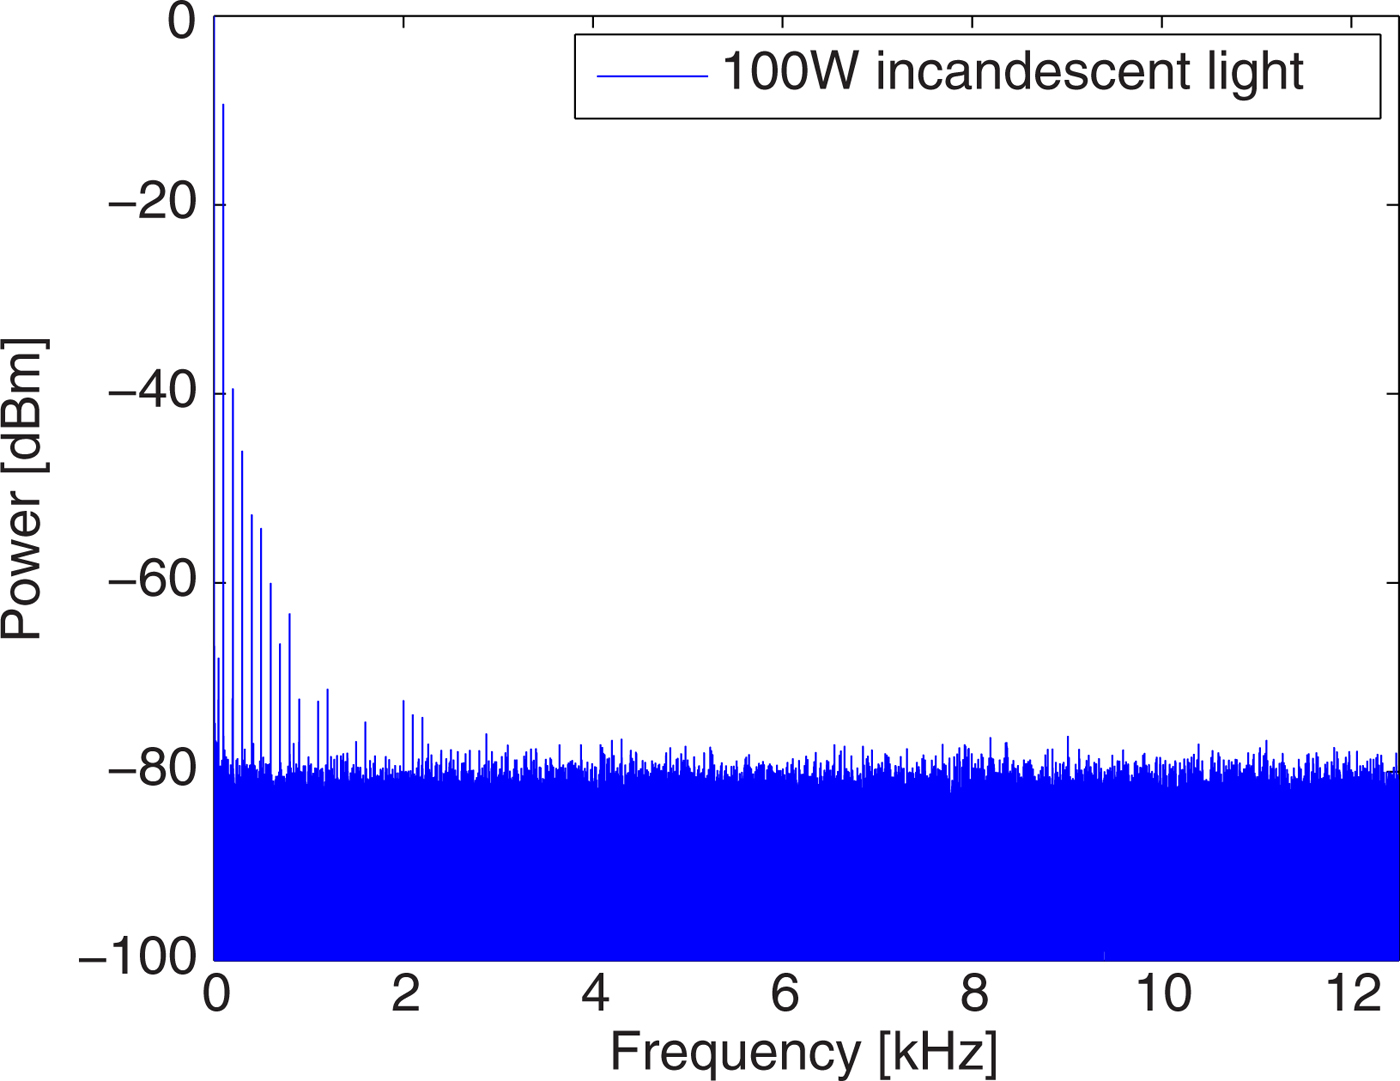
These lamps do not contain any driving circuit. Therefore only the disturbances from the main power supply can be detected in their spectrum. In the spectrum the odd harmonics of the supply frequency (50 Hz) appear because of the nonlinearity of the bulbs. The levels of the harmonics reach the noise floor at 1 kHz. These low frequency interferences can be neglected because these frequencies are not suitable for high data rate (minimum 1 Mbps) transmission. Therefore the spectrum of the transmitted data will be far from these frequencies and will not interfere with the signal. The measured spectrum of an incandescent light can be seen in Fig. 1.

Fig. 1. An incandescent light emitted frequency components. It contains the odd harmonics of the supply power frequency.
B) Fluorescent and compact fluorescent lights
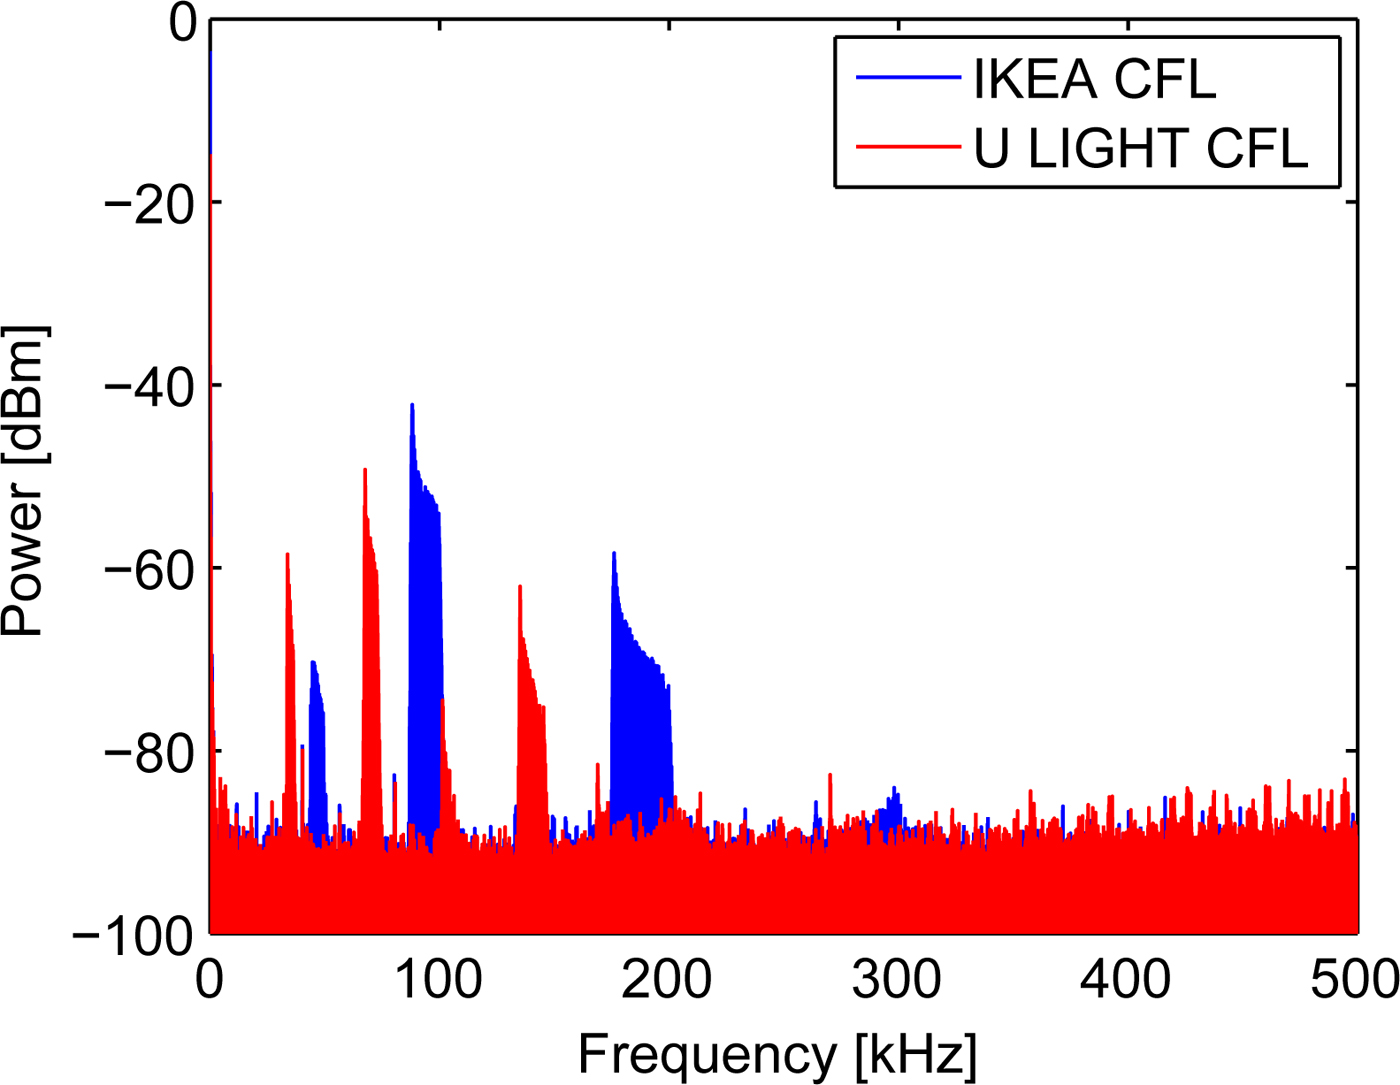
The measured fluorescent and CFL [Reference Moreira, Valadas and de Oliveira Duarte1–Reference Hauske and Jondral3] have two ranges in the spectrum where the disturbing components can be found. In the low frequency range the harmonics of main power supply frequency (50 Hz) are present like in the case of the incandescent light. In the range of kHz the disturbing components come from the driving circuit of the light bulbs. They go up to 20 kHz, if a conventional driver is used. However these components can reach 1 MHz, if a more energy efficient electronic ballast is used for the light bulb. Fluorescent and CFL lights were measured too and their spectra were quite different. The fluorescent light, which was set up at the ceiling, have disturbing components at about 90 kHz. Odd and even harmonics of it also are in the spectrum up to 270 kHz (Fig. 2). The spectrum did not contain the harmonics of the main power supply, which was detected in any other examined light bulbs. In the case of the measured CFL bulbs the power supply odd harmonics can be detected up to 500 Hz similar to the incandescent lights. The driving ballast that caused the interfering signal components of the spectrum are different for every CFL bulb, but the common thing is that in all spectra the disturbing components are under 250 kHz. The driving ballast not only disturbs single frequencies but also frequency ranges. The width of it depends on the frequency. The width of some noisy ranges is only 3 kHz while the other noisy parts can be 10 kHz wide. The gaps (~40 kHz) between the disturbed frequency ranges can be used for signal transmission. In that case the VLC systems have to be very carefully designed and a strict regulation is needed for the proper operation. If another CFL is used, or the manufacturer changes the electronics of the CFL, then the places of the disturbing frequencies will change too (Fig. 3). It can cut-off the communication link in the worst case. The measurements showed that the information signal should be placed to higher carrier frequencies than 250 kHz. In that case the communication failures can be decreased or avoided.
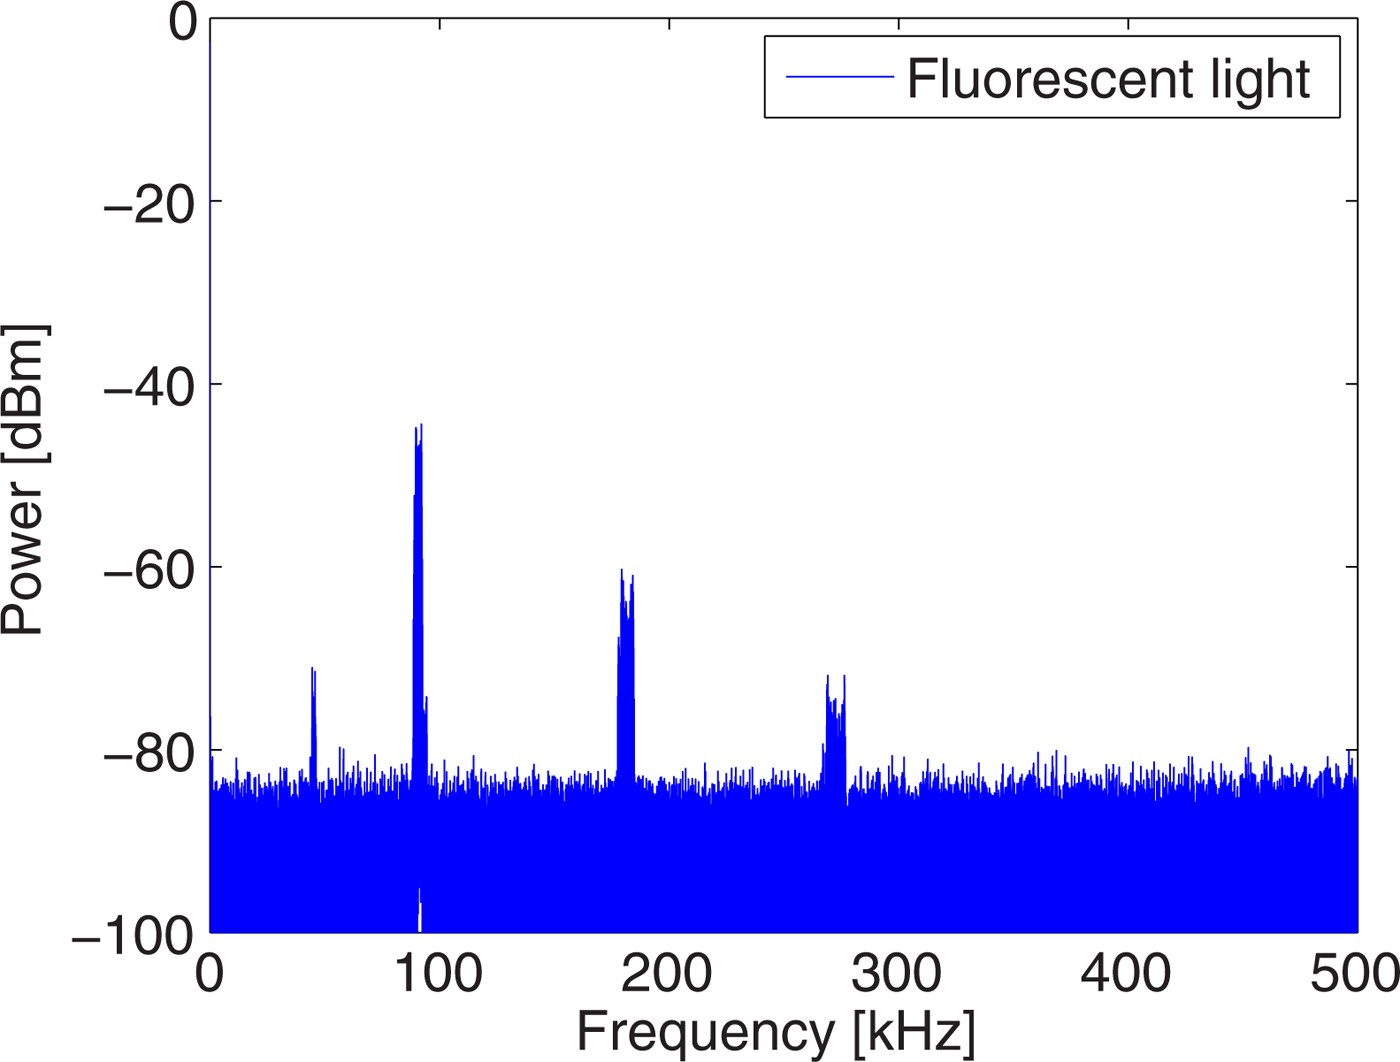
Fig. 2. A fluorescent light emitted frequency components. There are disturbing frequency ranges which come from the driving ballast.

Fig. 3. CFL light spectrum depends on the manufacturing of the light bulb.
C) LED lights
LED can be efficiently modulated by radiofrequency signals because of its physical structure. Therefore the switching frequency of the LED driving electronic will modulate the LED too so its effect will be in the emitted light. In [Reference Hauske and Jondral3] these disturbing components from the driving electronic were measured in the range of kHz. The disturbance was concentrated around at 1 and 100 kHz. Two high lumen LED bulbs (Philips CorePro 806lumen and IKEA LED1221G7) were measured which fit into the normal light bulb socket. In the measured spectra (Fig. 4) only the odd harmonics of the power supply system frequency (100, 200, … Hz) were detected by our detector. Compared with [Reference Hauske and Jondral3] it can be said, that the light bulb manufacturers successfully eliminated the switching frequency of the driving ballast from the emitted light spectrum. However, this is not always true for the low cost and low quality LED bulbs. The OBI 105448 LED bulb was also measured and its detected spectrum contains more disturbing components (Fig. 4). In that case the harmonics of the main power supply system can be observed up to 3 kHz. It is a much lower value than the fluorescent lights caused noise in the detected spectrum, but it has to be taken into consideration, when the modulation format and the frequency are selected.
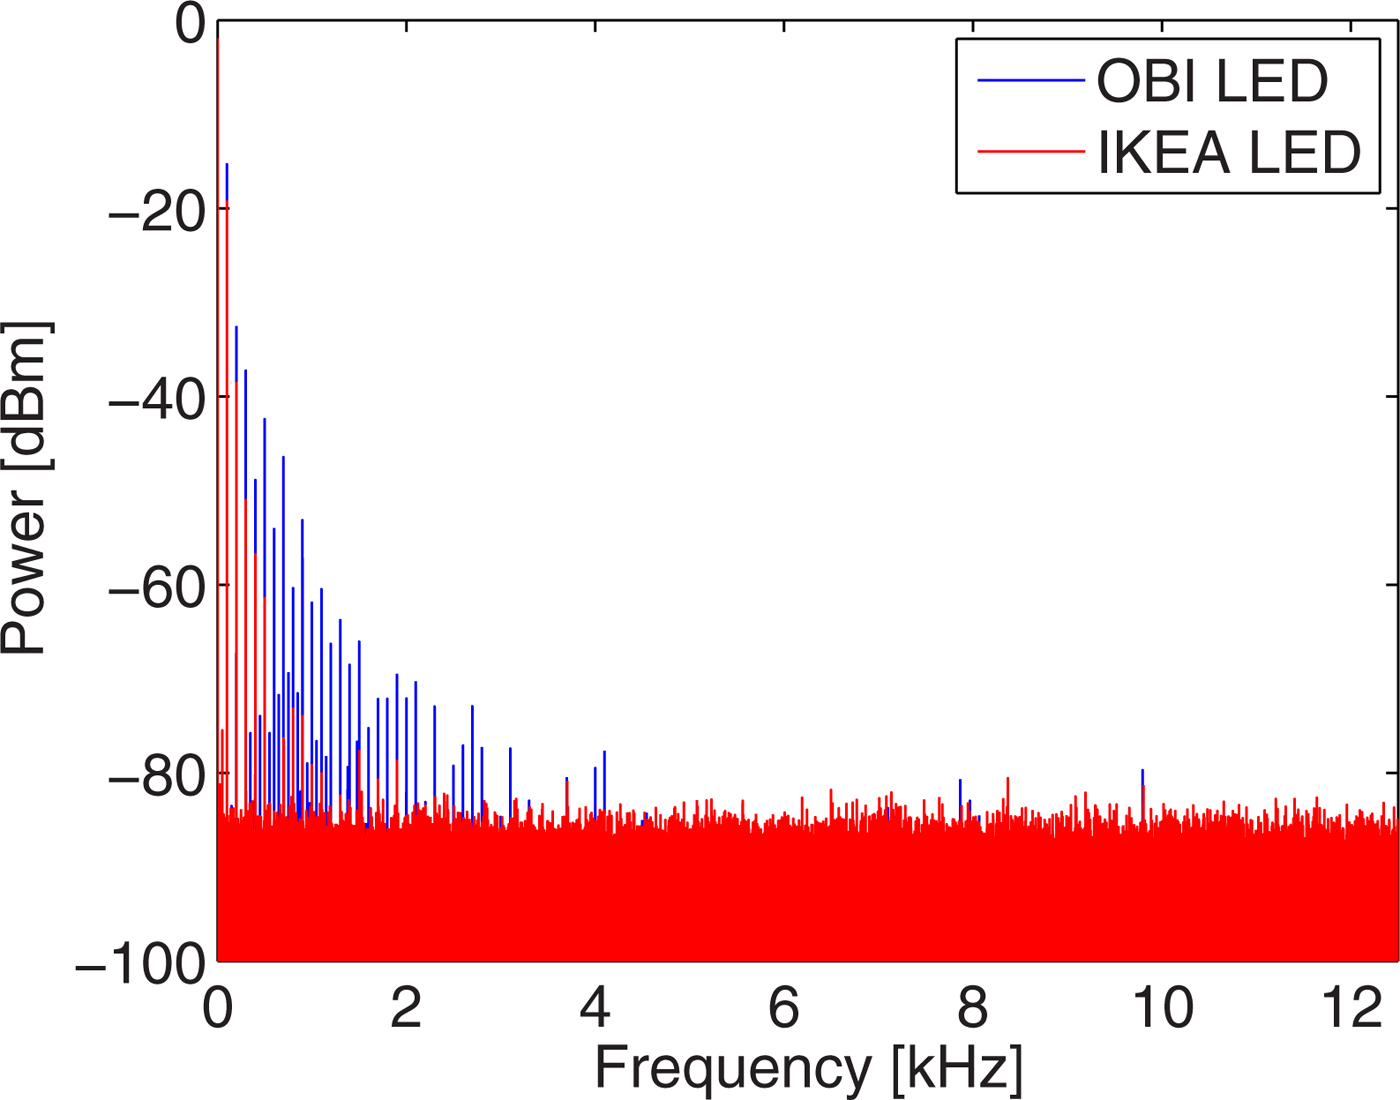
Fig. 4. The LED light bulbs emitted frequency components depend on the manufacturer. High quality light bulbs (IKEA) contain only the odd harmonics of the power supply frequency.
D) Summary of light bulb distortions
There are interfering noise components form the light bulbs in the transmission channel as our investigation shows it. The high frequency and high energy ones make the communications impossible at their frequencies. The disturbing components come from the driving ballast of the light bulbs. Compared with [Reference Hauske and Jondral3] the new LED bulbs and incandescent lights do not disturb the communication link. They emit only low frequencies interfering signal (under 3 kHz), which are far from the frequency of the data signal. Fluorescent and CFL lights are more problematic. Their spectra are disturbing under 250 kHz, which is an improvement compared with the results of [Reference Moreira, Valadas and de Oliveira Duarte1–Reference Hauske and Jondral3], so the carrier frequency of the data has to be at higher frequencies. Most of the indoor lighting solutions use CFL or fluorescent lights therefore their interfering signals have to be taken into consideration. The other problem is that the CFL spectrum depends on the light bulb type and the manufacturer, too. The easiest way to avoid disturbances, is that the data transmission uses higher frequencies than 270 kHz. However, the LED will limit the maximal usable modulation frequency as it will be shown in the next part. The other solutions to mitigate the disturbances of light sources is using line coding [Reference Chow, Yeh, Liu and Huang6, Reference Verma, Shandilya and Singh8, Reference Zhao and Vongkulbhisal9], OFDM modulation [Reference Kim and Jung10] or lowpass filter at the detection side [Reference Funahashi, Kobayashiy, Okaday and Katayama7]. The best solution is that the lighting is changed to LEDs when the VLC system is deployed in a building.
III. LED MODULATION BANDWIDTH
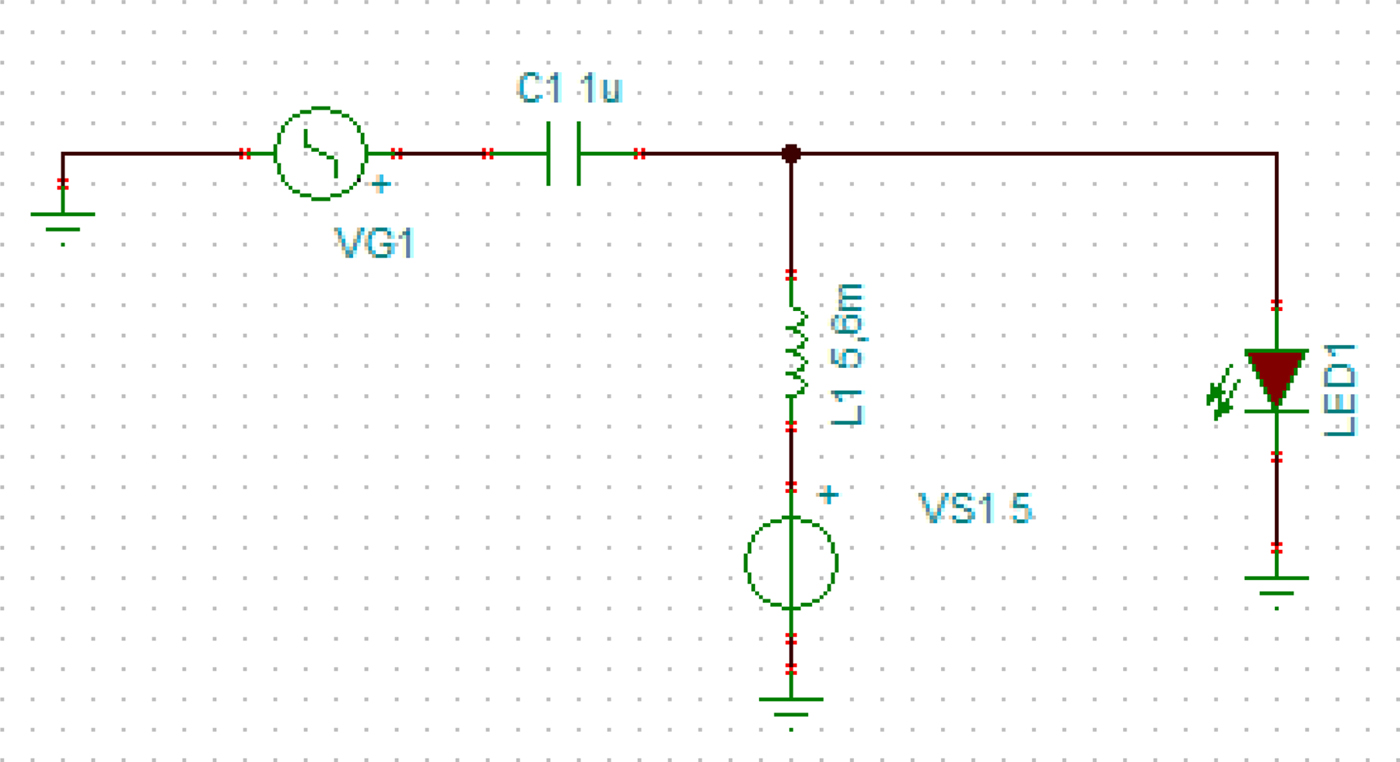
The modulation bandwidth of the LED also plays an important role in the transmission. LED bandwidth depends mainly on the diffuse capacitance and the phosphor layer. High power LEDs have a high diffuse capacitance. It can be decreased by a carrier draw out circuit [Reference Tanaka, Umeda and Takyu14] or using small power LEDs in an array instead of one high power LED. In lighting application white LEDs have to be used which contain a phosphor layer. The phosphor layer creates the white light from the emitted blue or ultraviolet light. This layer highly decreases the frequency response of the LED [Reference O'Brien15, Reference Le Minh, O'Brien, Faulkner, Zeng, Lee, Jung, Oh and Won16]. To avoid this effect many researchers have detected only the originally emitted blue component of light. This detection method improves the frequency response of the LED, but the level of the blue light is very low and a blue filter is necessary with a lens system at the receiver side. A Bias-Tee was applied for the transfer characteristic examinations (Fig. 5).

Fig. 5. The transmitter consists of a Bias Tee and a LED.
The transfer functions of a white LED and a blue one (both are Optoflash 1 W, 8 cd) were measured. Figure 6 shows that the light conversion by the phosphor layer results in a large power loss, the degradation is 10–15 dB. The other major difference is in the 3 dB bandwidth (where the power is half of the maximum one). The blue LED has higher modulation bandwidth (1.9 MHz), while the bandwidth of the white LED is 1.4 MHz. The large attenuation of the phosphor based white LED can be eliminated applying red-green-blue (RGB) LED. However, the lighting companies do not support the RGB based lighting solutions. The blue LED was chosen for the modulation investigation because it has higher detected signal level and larger bandwidth.
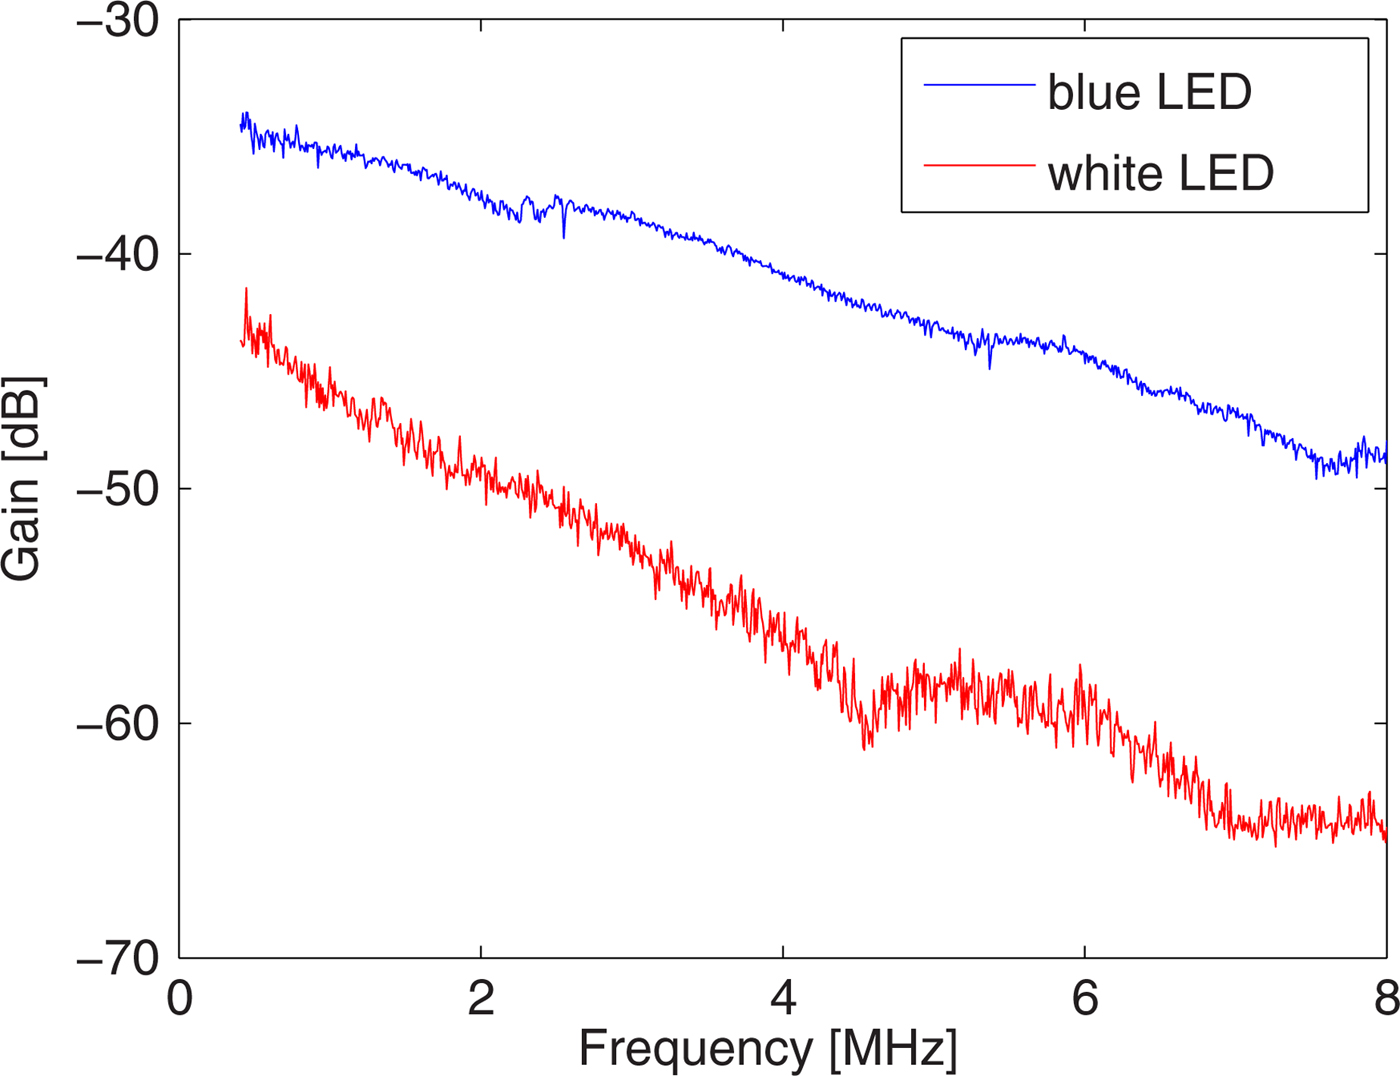
Fig. 6. The frequency responses of a blue LED and a white one. The phosphor layer of the white LED has a huge attenuation and it also decreases the LED bandwidth.
IV. DATA TRANSMISSION
In this paper our examination was focused on finding the most suitable modulation format for the LED. We compare the robustness of the OOK, M-PSK (Mth order) and M-QAM (Mth order) modulation schemes. symbol error ratio (SER) and the BER were calculated from the measured Q-factor and error vector magnitude (EVM). EVM was measured by Agilent N9010A spectrum analyzer and its software was used to demodulate the QAM and PSK signals and measured the EVM. The modulated signal was generated by Agilent 4433B.
A) Investigated modulation formats
The OOK modulation is the simplest modulation, which turns on-off the LED. Its major drawback is that the numbers of the zeros and ones have to be quite equal or the light intensity will change. On the other hand it is not energy efficient for lighting applications because it is turned off in the half of the time. The quality of the transmission can be described by the BER. It can be calculated from the Q-factor of the eye pattern [Reference Proakis and Salehi17], where Q is the value of the Q-factor:
 $$BER = \displaystyle{1 \over 2}erfc\left( {\displaystyle{Q \over {\sqrt 2}}} \right).$$
M-QAM is spectrally more efficient than OOK, so it can be put between two disturbances in the spectrum (Fig. 2). However, the higher modulation order increases the complexity of the receiver and the transmitter and the probability of false decision. The amplitude also contains information so the light intensity can be visibly changed. SER describes the quality of the transmission. The value of the EVM was measured. To compare the results with other modulations the SER was calculated from the measured EVM [Reference Proakis and Salehi17]:
 $$SNR = \displaystyle{1 \over {{{(EV{M_{RMS}})}^2}}},$$
 $$\eqalign{SE{R_{M - QAM}} = \;& 2\left( {1 - \displaystyle{1 \over {\sqrt M}}} \right)erfc\left( {k\sqrt {\displaystyle{{{E_S}} \over {{N_0}}}}} \right) \cr & - \left( {1 - \displaystyle{2 \over {\sqrt M}} + \displaystyle{1 \over M}} \right)erf{c^2}\left( {k\sqrt {\displaystyle{{{E_S}} \over {{N_0}}}}} \right),} $$
 $$k = \sqrt {\displaystyle{1 \over {\displaystyle{2 \over 3}(M - 1)}}}. $$
In the above equations: SNR is the signal to noise ratio, EVM RMS is the root mean square value of the EVM, M is the modulation order, E s is the symbol energy and N 0 is the noise power. M-PSK also has a smaller bandwidth than the OOK. The M-QAM modulation format has better performance (larger decision distances) than 8th or higher order PSK, therefore we investigated this type of modulation up to 8-PSK. The SER can be calculated in that case [Reference Proakis and Salehi17]:
 $$SE{R_{M - PSK}} = erfc\left( {\sqrt {\displaystyle{{{E_S}} \over {{N_0}}}} \cdot {\rm sin}\left( {\displaystyle{\pi \over M}} \right)} \right).$$
B) Comparing the modulation formats
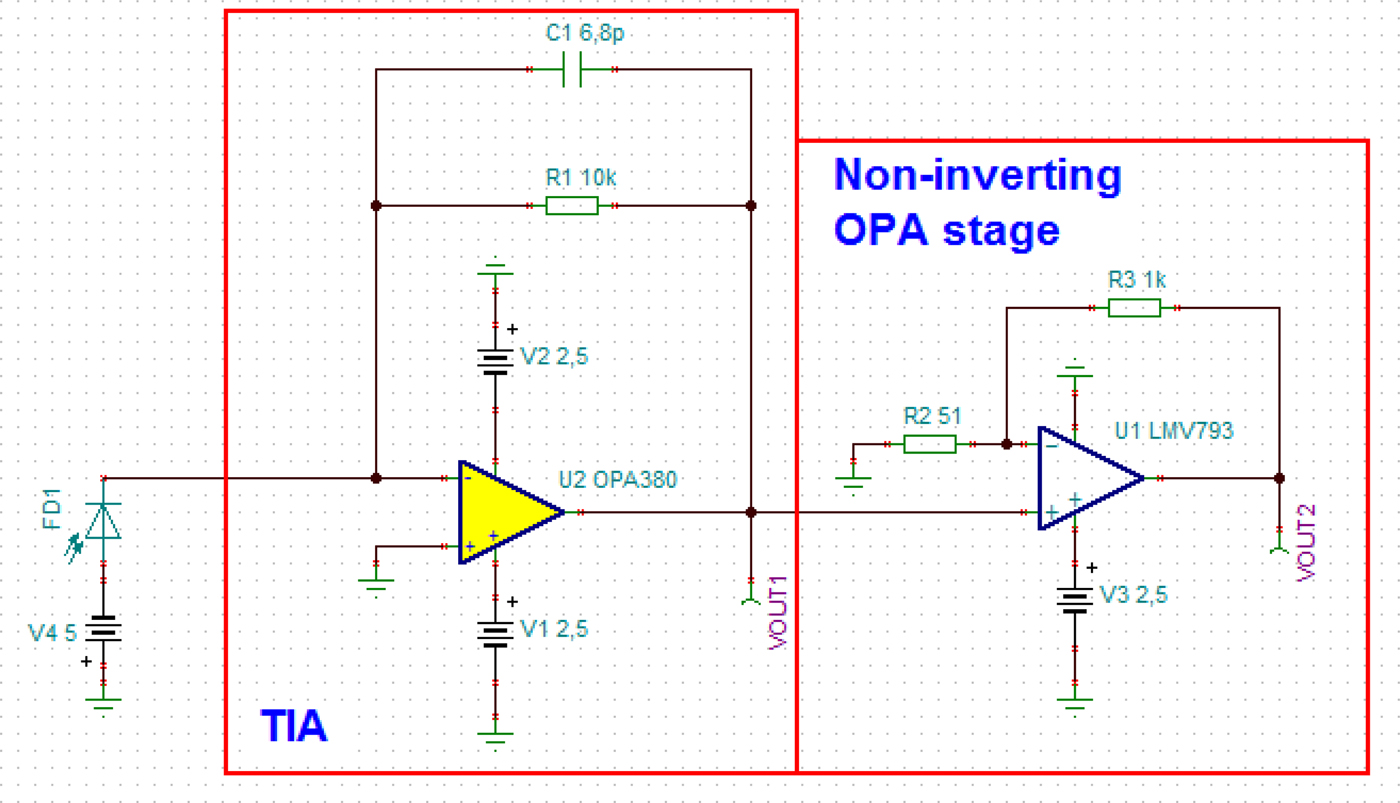
For our investigations we used different receiver circuits: a precise high cost one (Elcetro-Optics Technology Inc., EOT-2030A) with lens and a low cost receiver. The EOT-2030A receiver contains a small active area (diameter: 400 µm) photodiode (Hamamatsu S5973). This receiver needs a lens which focuses the light to the photodiode. We designed a low cost receiver (Fig. 7) which is built up from two stages: a transimpedance amplifier (TIA) and an amplifier. S5973 and VTP-1188SH type photodiodes were applied in the receiver. The applied S5973 photodiode makes possible to compare our receiver circuit to the EOT detector. The difference between the measured results by the two photodiodes shows the effect of the size of the photodiode active area. The receivers detected the modulated signals and they were demodulated by the spectrum analyzer and the oscilloscope. Our Bias-Tee (Fig. 5) was used to modulate the LED current.

Fig. 7. The schematic of the low cost receiver circuit.
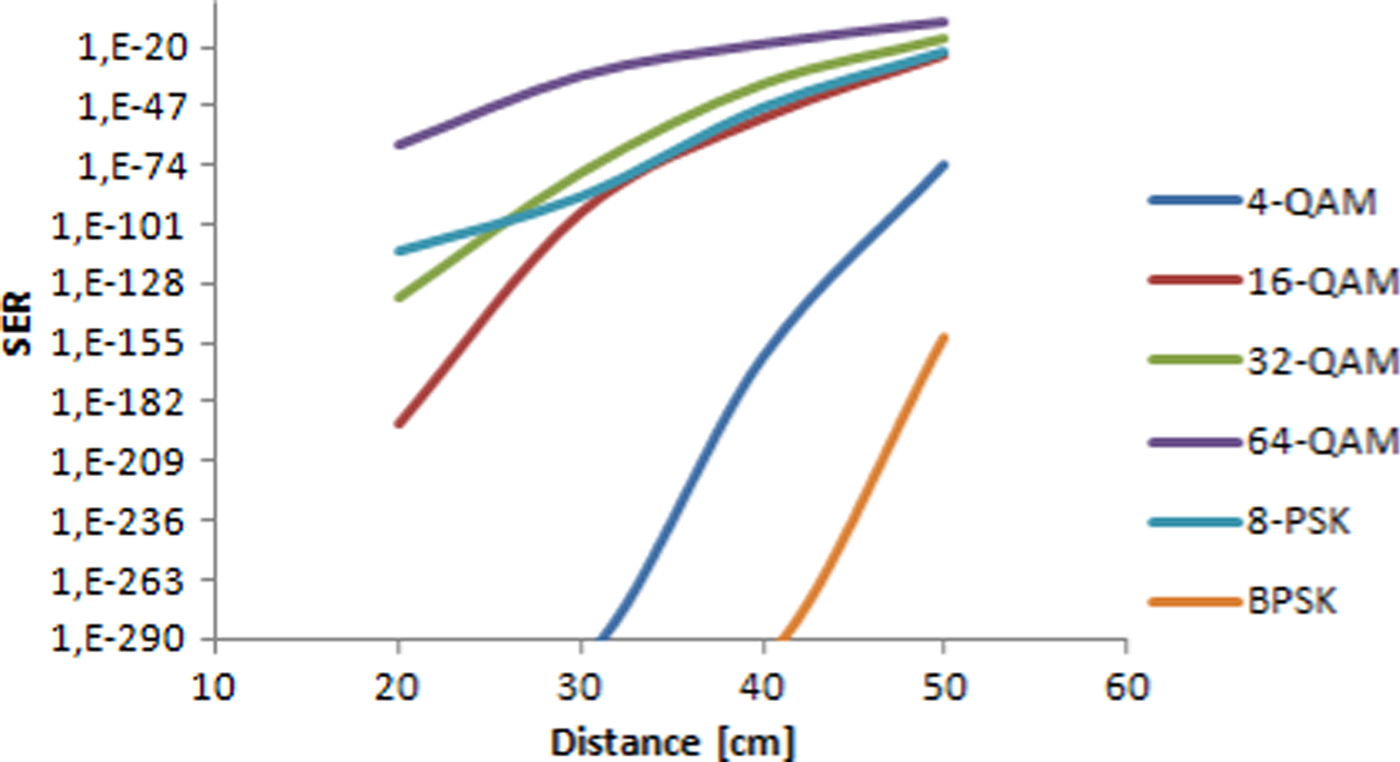
The high bandwidth EOT detector was used as a reference. Different modulations were measured and the SER was calculated applying Equations (2)–(4). Figure 8 shows the result when the carrier frequency was set to 3 MHz and the symbol rate was 0.5 Msps. This carrier frequency is out of the LED 3 dB bandwidth. The optimum carrier would be 1 MHz which is in the middle of the 3 dB points of the LED and close to the highest disturbances frequency (250 kHz). However, at low frequencies the noise of the spectrum analyzer is higher than at 3 MHz or above it. It highly decreases the quality of the demodulation as Fig. 9 shows therefore, it cannot be neglected. That is why the 3 MHz carrier frequency was chosen. The measurement results represent that binary phase shift keying (BPSK) and 4-QAM are the most robust modulation formats in case of 3 MHz carrier frequency. Increasing the modulation order the SER is increased. Larger distance between the transmitter and the receiver also degrades the value of SER. Figure 10 represents the eye diagram of the transmitted OOK signal when the BER was 9 × 10⁻⁴. The distance between the transmitter and receiver was set to the maximal value (30 cm) because it was limited by the noise level of the oscilloscope. These results are similar to [Reference Shinwasusin, Charoenlarpnopparut and Suksompong18], where BPSK was the most robust modulation format. OOK modulation requires higher SNR ratio in this paper like in our case. To improve the OOK transmission they used return-to-zero coding. Another possibilities is to change the modulation type e.g. using PPM [Reference Kumar and Lourenco4, Reference Shinwasusin, Charoenlarpnopparut and Suksompong18]. However, it requires attention to avoid the modulation caused flickering effect. Instead of the PPM modulation we used M-QAM and M-PSK modulations with subcarrier. It improved the signal transmission compared with [Reference Kumar and Lourenco4], where a subcarrier PPM was applied. Our results are shown that all examined complex modulation formats have better performance than the OOK. The transmission distance is larger and the BER does not reach the 10−9 value compared with the case of OOK modulation. BPSK and QAM are less sensitive for the SNR degradation because of the large symbol distance. It validates the other published papers [Reference Kumar and Lourenco4, Reference Hayesa, Ghassemlooya and Seedb5, Reference Elgala, Mesleh, Haas and Pricope11]. An OFDM based M-QAM or M-PSK VLC system is more complex than a subcarrier used one and the flickering effect cannot be neglected [Reference Shinwasusin, Charoenlarpnopparut and Suksompong18]. Our system has better BER performance than an OFDM one [Reference Elgala, Mesleh, Haas and Pricope11], which uses coding and channel estimation too. In our system the 64-QAM has 10−20 BER value while in [Reference Elgala, Mesleh, Haas and Pricope11] the BER was 5 × 10⁻¹ at a distance of 50 cm. From these results it can be seen that the selection of the modulation technique(s) determines the available system performance. That can be improved by coding, filtering, etc., but it increases the system complexity.

Fig. 8. SER values in the function of the distance between the transmitter and receiver for different modulation formats, when the EOT detector was used. The carrier frequency was 3 MHz and the symbol rate was 500 ksps.
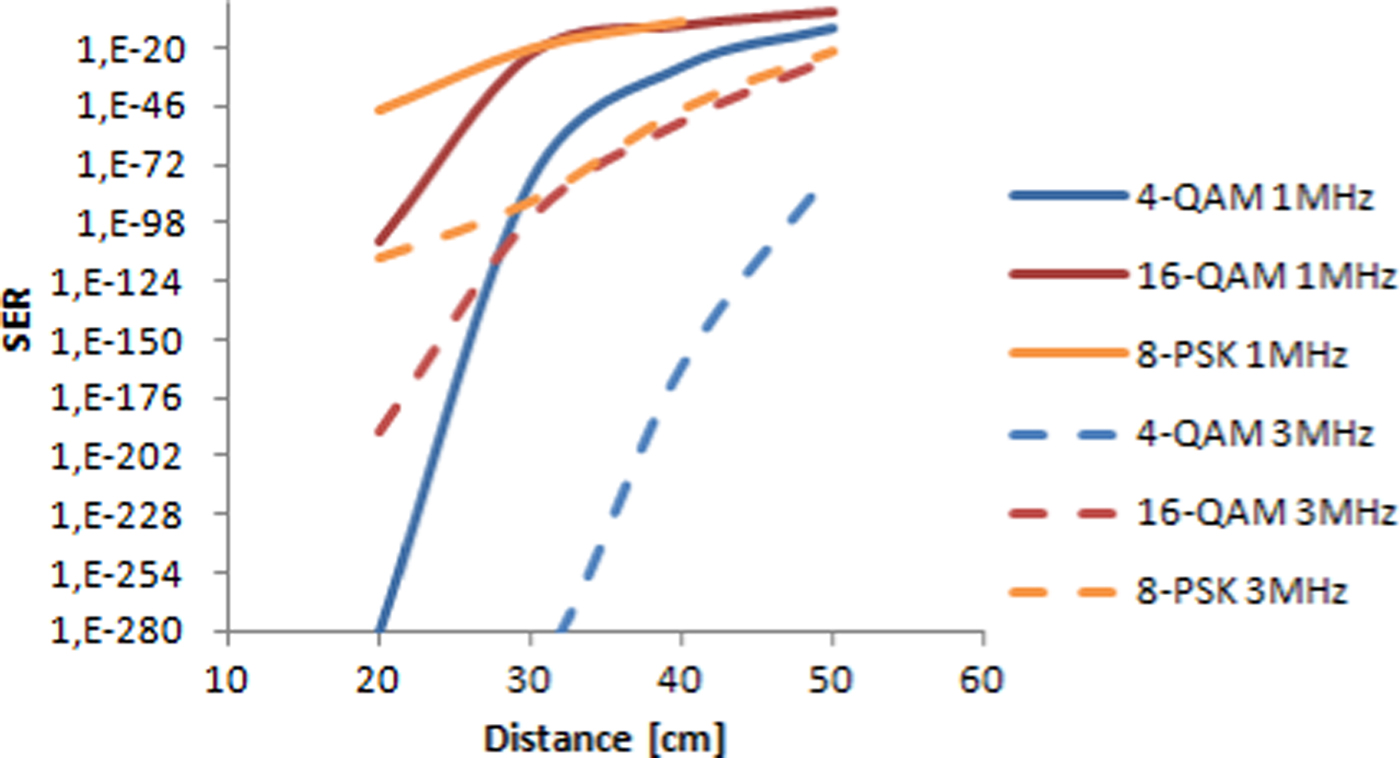
Fig. 9. SER values as a function of the distance between the transmitter and receiver for different modulation formats, when the EOT detector was used. The carrier frequency was 3 MHz (dotted lines) and 1 MHz (solid lines). The symbol rate was 500 ksps at both frequencies.

Fig. 10. Eye diagram of the transmitted OOK modulated pseudo random bit sequence. The frequency was 3 MHz and the distance between the transmitter and the receiver was 30 cm.
At higher carrier frequencies the applied symbol rate can be increased (for example it can be 1 Msps). Larger symbol rate broadens the signal bandwidth, while the transmitted power is not changed. It causes that the signal level will be smaller in the spectrum, so the noise has larger influence on the transmission. Figure 11 shows the effect of the data rate for different modulations. During the measurements 0.5 Msps (solid lines) and 1 Msps data rate (dotted lines) were used. The signal quality degradation depends on the modulation format. Signals with large bandwidth will suffer higher SER degradation than the smaller bandwidth signals.
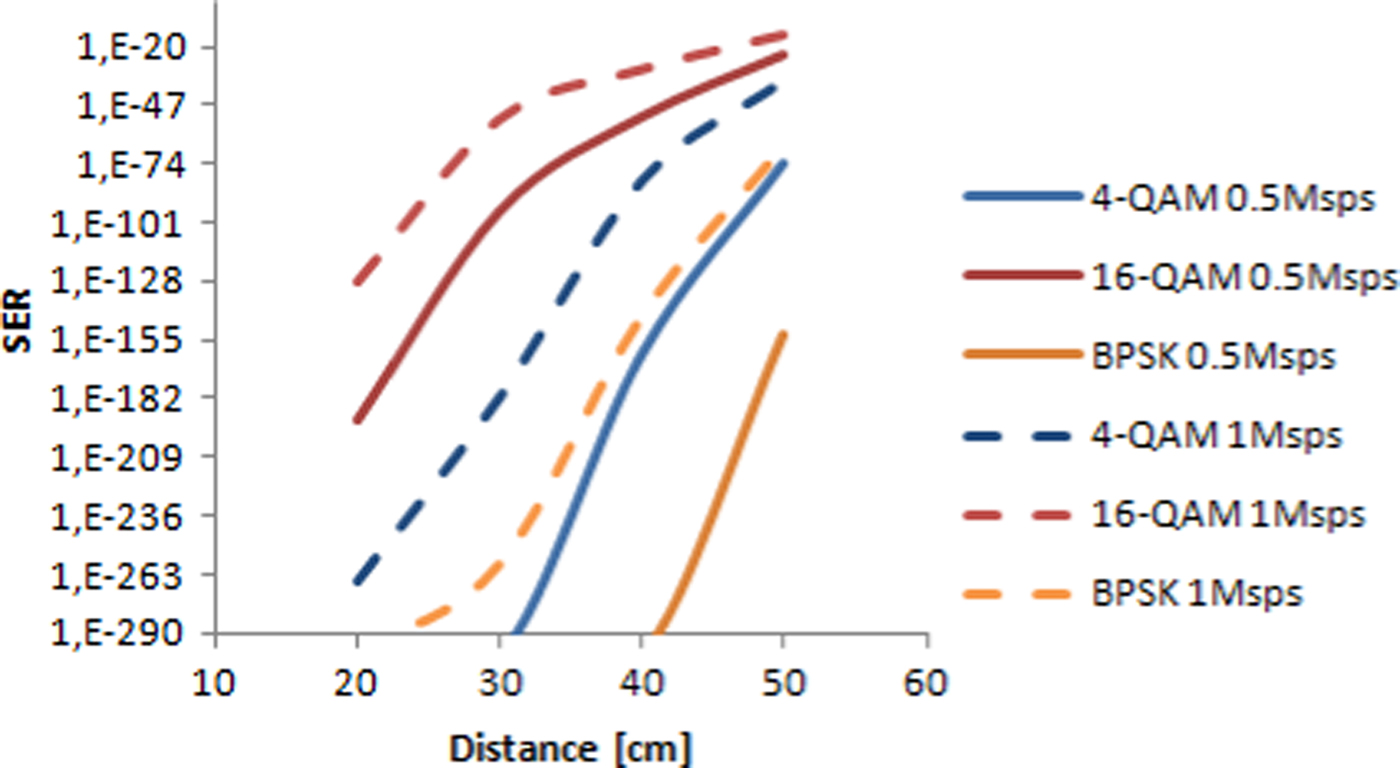
Fig. 11. SER values in the function of the distance between the transmitter and receiver for different modulation formats, when the EOT detector was used. The carrier frequency was 3 MHz. The symbol rate was 1 Msps (dotted lines) and 0.5 Msps (solid lines).
A low cost receiver was designed to omit the lens from the system. It can be done if a large active area photodiode is used. It requires a totally different circuit design than the EOT receiver. First the same photodiode was applied to compare our circuit with the EOT receiver. So the circuit was matched with a Hamamatsu S5973 photodiode and the light was focused to the photodiode with a lens. The result can be seen in Fig. 12. Our receiver construction has higher gain than the EOT, which allows larger distances (that reaches 75 cm). The 4-QAM and BPSK signals were error free at all distances. Therefore these are not depicted in Fig. 12. The SER of the 64-QAM modulation decreases at short distances, because close to the transmitter the TIA goes into saturation and distorts the signal. At larger distances the SER increases because of the noise. If the symbol rate is changed to 1 Msps similar effects can be observed as in the case of the EOT detector (Fig. 11). The calculated SER is increasing with the symbol rate.
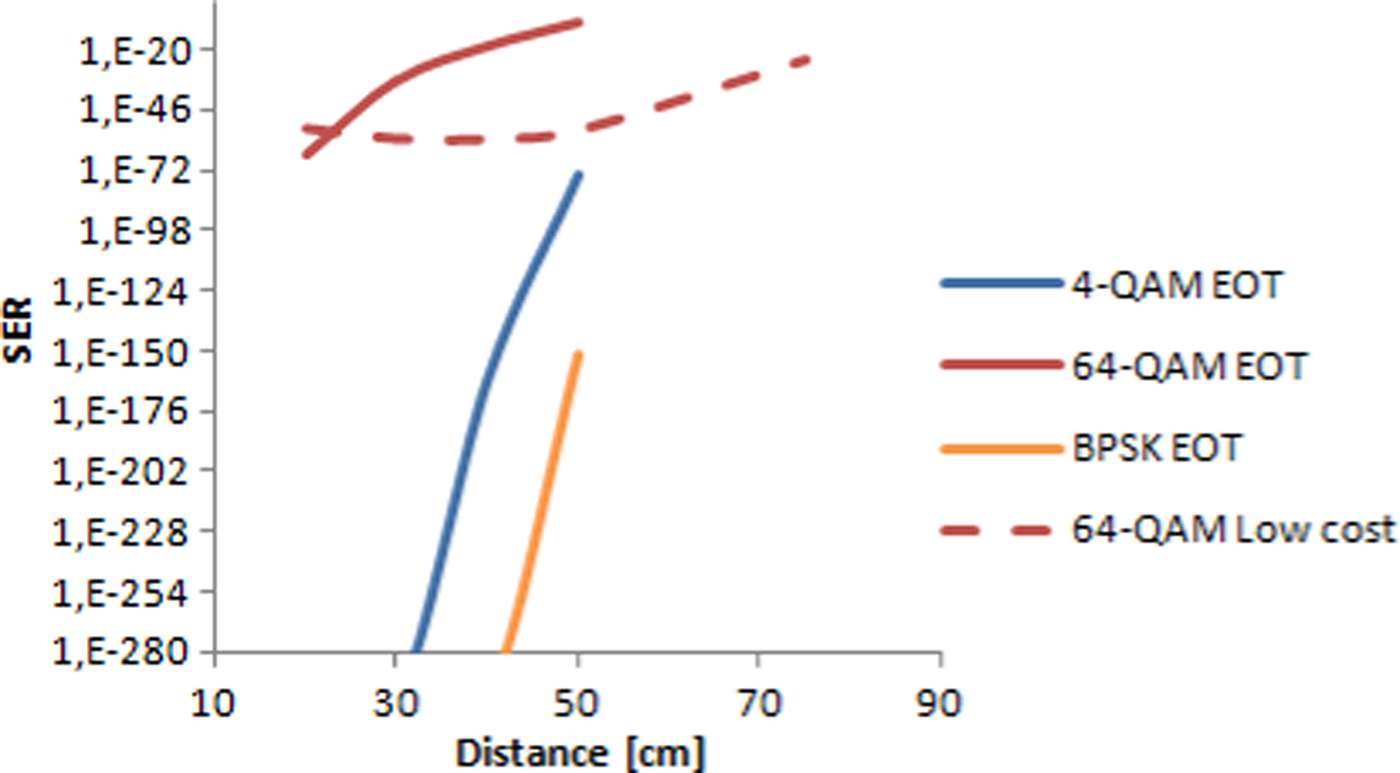
Fig. 12. SER values comparing the EOT and our receiver with S5973 photodiode. The carrier frequency was 3 MHz and the symbol rate was 0.5 Msps. The detected 4-QAM and BPSK signals by our receiver were error free.
The OOK modulation also shows improvement in the detection as Fig. 13 shows it. At the TIA output we can observe an open eye with 6 Q-factor. The BER value is 8.77 × 10⁻¹⁰.

Fig. 13. Eye diagram of the transmitted OOK modulated pseudo random bit sequence. The frequency was 3 MHz and the distance between the transmitter and the receiver was 30 cm.
Behind the TIA we put an amplifier to increase the transmission distance. The measurement results can be seen in Fig. 14. The constellations show that the amplifier increases the in-band noise, which causes signal degradation. In the worst case the signal is detected by the TIA but after the amplifier stage it cannot be demodulated because of the amplifier noise. The experiment showed that the second stage amplifier should be also a low noise one.
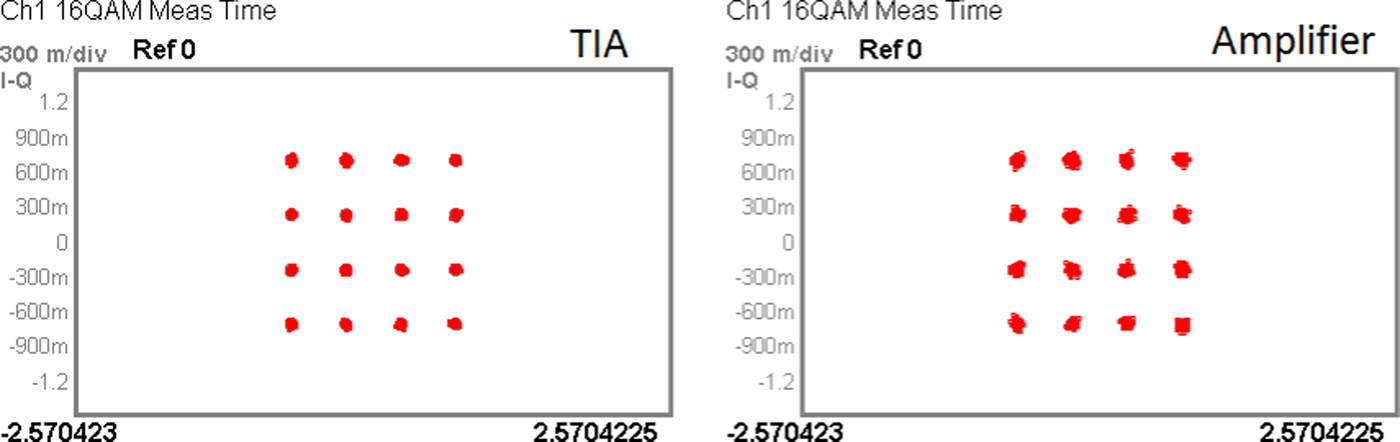
Fig. 14. Detected constellation diagrams of the low cost receiver. Left picture shows the TIA output. On the right side the output of the amplifier can be seen. The distance was 50 cm between the transmitter and the receiver, the symbol rate was 1 Msps at 3 MHz.
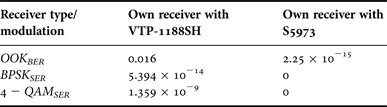
To decrease our system sensitivity on the distance we changed the photodiode to VTP-1188SH. Its active area is 11 mm2 and it has a built in lens. The two photodiodes were used in our receiver circuit to compare the two solutions. The new photodiode was more sensitive to the light and the lens can be neglected. However, the SER and BER values are worse than in the previous two solutions. The carrier frequency also was 3 MHz and the symbol rate was 0.5 Msps. The result can be seen in Table 1. Our system became more independent of the place of the transmitter, but the price of it is the error free communication. The best result can be achieved with BPSK modulation, where the distance between the symbols is the largest.
Table 1. Error ratios of the low cost receiver if the photodiode is S5973 or VTP-1188SH.

V. CONCLUSION
This paper showed that the effect of the light bulbs cannot be neglected in a mixed system. Fluorescent and compact fluorescent light bulbs have many distorting components in a wide spectrum range. The best way to omit the interference caused degradation, if our modulated signal is put to higher frequencies, above the distorting components. It could be seen that the manufactured light bulbs improving continuously. The modern LED bulbs have distorting components from the power supply as the incandescent light bulbs. The distortion caused by CFL light can be neglected if the modulated signal is placed above 270 kHz. We also showed that there is a large difference between the blue and the white LED. White LED has smaller (~1 MHz) spectrum and the emitted light is decreased. Therefore a RGB LED can be a better solution. Because of the LED small bandwidth the applied modulation format has to be spectrally efficient. The carrier frequency of the modulation signal was set out of the LED bandwidth, because of the spectrum analyzer noise, which makes faults in the demodulated signal. The outband transmission does not suffer recognizable distortions. The distortions come from the decreasing light intensity as the distance is increased between the transmitter and the receiver. For the mobile receiver (photodiode VTP-1188SH) a very robust modulation technique is needed. Therefore, BPSK or QAM modulation will be optimal for long range communication. Higher order modulation e.g. 64-QAM can be used in those systems which contain a lens. We have shown that all examined complex modulation forms have better performance than the OOK. Therefore, it is not proposed for a long, high data rate VLC link. BPSK or QAM is the most suitable modulation format for the VLC system because of their robustness. Our results are similar to the other published ones [Reference Kumar and Lourenco4, Reference Hayesa, Ghassemlooya and Seedb5, Reference Elgala, Mesleh, Haas and Pricope11, Reference Elgala, Mesleht and Haast13, Reference Shinwasusin, Charoenlarpnopparut and Suksompong18]. OOK requires the highest SNR and it is almost error free in short distances. Increasing the states in the M-QAM or M-PSK modulation form it will decrease the BER values. Coded transmission can improve it as it was shown in [Reference Elgala, Mesleh, Haas and Pricope11]. BPSK were the best modulation form for the low SNR channel transmission such as in our measurements. If the light beam is focused by a lens to a small active area photodiode, the SNR ratio is increased and the communications range can be higher. Not only the distance but the applied frequency can also be higher because of the smaller capacitance of the photodiode. However, the position of the receiver and the transmitter needs more attention if a lens is used to focus the light into the active area of the photodiode. It is the major drawback in the applications of these systems.
ACKNOWLEDGEMENTS
The presented work was inspired by COST Action IC1101, Opticwise.
 Gábor Fekete received his B.Sc. degree in Electrical Engineering from Budapest University of Technology and Economics in 2011, followed by a M.Sc. degree from the same university in 2013. He is presently pursuing Ph.D. degree in Electrical Engineering from the Department of Broadband Infocommunications and Electromagnetic Theory at the Budapest University of Technology and Economics. His research interests cover the indoor visible light communication systems, optically generated millimetre-wave, and the optical OFDM modulation.
 Gergely Mészáros received his B.Sc. degree in Electrical Engineering from Budapest University of Technology and Economics in 2011 and followed by a M.Sc. degree from the same university in 2013. He is presently pursuing Ph.D. degree in Electrical Engineering from the Department of Broadband Infocommunications and Electromagnetic Theory at the Budapest University of Technology and Economics. His research interests cover the phase noise of the oscillators and microwave devices.
 Eszter Udvary received her Ph.D. degree in Electrical Engineering from Budapest University of Technology and Economics (BME), Hungary, in 2009. She is currently an Associate Professor at BME, Department of Broadband Infocommunications and Electromagnetic Theory where she leads the Optical and Microwave Telecommunication Laboratory. Her research interests are in the broad areas of optics, include communication systems, optical and microwave interactions, electro-optical devices, and sensors. She has authored more than 80 papers and received more than 60 citations.
 Gábor Fehér received his M.Sc. degree in Electronic Engineering from Budapest University of Technology and Economics (BME) in 2010. He is presently working on his PhD thesis about “Ultra Wide Band Impulse Radio for Location Purposes”. He works as a researcher of the Optical Microwave and Telecommunications Laboratory (OMT-LAB) at BME. He has been working on projects running at OMT-LAB like; the EURIPIDES-EUREKA project Innovative Design Architecture for Thin electronic steering Antennas (IDEATA) where he is responsible to design a miniature SMD compatible circulator used in the RF front-ends of the antenna; the Visible Light Communications and Ultra Wide Band Impulse Radio (VLC-UWB Pilot Project). He is presently the owner of six publications in the field of ultra wide band and visible light communications.
 Tibor Berceli is Professor of Electrical Engineering at the Budapest University of Technology and Economics. He gives courses on active nonlinear microwave circuits and combined optical-microwave communications. He instructed several students working for the Ph.D. degree for many years. He is the author or co-author of about 160 papers and six books published in English. He presented 95 papers at international conferences. He received 26 patents for his inventions. He was visiting professor at universities in the USA, UK, Germany, Japan, France, Finland, and Australia. Professor Berceli is Fellow of IEEE.