


Introduction
Solanum aethiopicum L., the cultivated eggplant indigenous to Africa aptly referred to scarlet eggplant, is well known and easily recognized. Distinction between groups in this species, the wild and weedy forms, is less understood. S. aethiopicum L. belongs to the family Solanaceae in the subfamily Solanoideae. S. aethiopicum L., scarlet eggplant, and Solanum macrocarpon L., gboma eggplant, result from a domestication process that occurred in Africa, starting from two wild ancestors, Solanum anguivi and Solanum dasyphyllum, respectively (Lester, Reference Lester1998). S. aethiopicum is an important indigenous leaf and fruit vegetable in tropical Africa; it is cultivated and consumed largely in Africa (Sunseri et al., Reference Sunseri, Polignano, Alba, Lotti, Bisignano, Mennella, Alessandro, Bacchi, Riccardi, Fiore and Ricciardi2010). In Europe, it is not cultivated very frequently and much less consumed compared with Solanum melongena, despite its berries being edible (Sunseri et al., Reference Sunseri, Polignano, Alba, Lotti, Bisignano, Mennella, Alessandro, Bacchi, Riccardi, Fiore and Ricciardi2010). On the basis of morphological traits, there are four groups within S. aethiopicum: Aculeatum, Gilo, Kumba and Shum. Each group has been selected primarily for desirable features in parts of the plant used for food or ornamental purposes (Lester, Reference Lester1986). S. aethiopicum is important for production in marginal areas and for the genetic improvement of S. melongena (Toppino et al., Reference Toppino, Vale and Rotino2008). It is a self-pollinating crop, although some outcrossing of up to 30% is possible. Consumer preference for the African eggplant is based on, among others, fruit size (fruit length and width) and shape, colour (cream or green, uniform or stripped fruit colour) and taste (sweet or bitter) (Bukenya-Ziraba and Bonsu, Reference Bukenya-Ziraba and Bonsu2004).
Genetic variability is the key to progress in crop improvement programmes, and genetic variation within species is not uniformly distributed (Frankel et al., Reference Frankel, Broun and Burdon1995). Analysis of genetic relationships in crop species is important for crop improvement activities, and it helps to analyse genetic variability among cultivars (Singh, Reference Singh1996), select parental materials for hybridization, identify inbred parents for maximizing heterotic response and identify materials that should be used or conserve maximum genetic diversity (Thormann and Osborn, Reference Thormann and Osborn1992). Currently, there is an increasing interest in the S. aethiopicum groups for conservation, documentation and genetic improvement through diversity analysis and introgression of resistance and fruit yield component genes into the cultivated and widely accepted Gilo group. The paucity of genetic information necessary for variety development in S. aethiopicum has led to the non-availability of hybrid and open-pollinated varieties in sub-Sahara Africa. Consequently, production is challenged by numerous production constrains, insect pests and diseases, post-harvest management and marketing. In addition, core collections have not been developed for this crop, as is the case with other species of Solanaceae (S. melongena, Solanum lycopersicon and Capsicum annum). In this study, morpho-agronomic diversity was investigated among 44 accessions of the S. aethiopicum groups from Africa, Europe, Asia and South America based on morpho-agronomic traits, and to identify possible donor parents for specific and multiple traits necessary for genetic improvement, utilization and commercialization.
Materials and methods
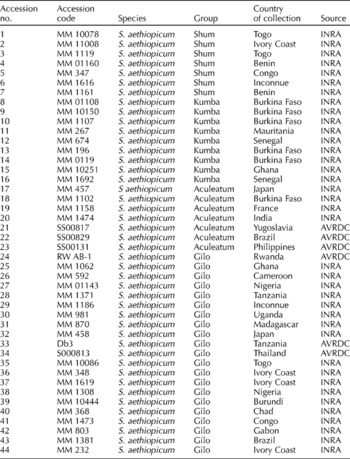
Accessions evaluated comprised 44 accessions of S. aethiopicum subgroups from locations in Africa, Asia, Europe and South America, and maintained in the genebanks of the AVRDC (The World Vegetable Center) and the French Institute for Agricultural Research (Table 1). Genetic stocks are homogeneous for most genetic attributes. Field experiments took place in 2008, 2009 and 2010 at the research field of the Horticultural Training Research Institute, Arusha (latitude 4.8°S, longitude 3.7°E; altitude 1290 m) with an annual rainfall of 700–1000 mm; soil type was clay loam with a pH between 6.0 and 6.5. Experimental plots were laid out in a randomized complete block design with three replications. Each plot consisted of a double row plot of 7 m long and 0.75 m between the rows. Seedlings were raised in multipot seedling trays for 4 weeks, and thereafter transplanted to the sides of the ridges at 0.45 m between the plants. Plants were fertilized with NPK (20/10/10) at the rate of 90 kg N/ha, 45 kg P2O5/ha and 45 kg K2O/ha. Urea fertilizer was applied at the rate of 120 kg N/ha in three splits, i.e. 1 week after transplanting, at flowering and thereafter at 3 weeks. Ridomyl® WP (fungicide) was sprayed against damping off in the field at the rate of 20 g/15 litres of water 12 d after transplanting. Selecron EC (insecticide) was applied 2 weeks after transplanting at the rate of 20 ml/20 litres of water to control insects. The experiment was furrow-irrigated every 2 d for the first 2 weeks after transplanting, and thereafter once a week. Weeding was carried out manually and frequently with hoes to maintain weed-free plots. Phenotypic identification and measurement of traits was done from vegetative through reproductive stages until harvest.
Table 1 Solanum aethiopicum accessions used in the study organized by group and country of collection
Morpho-agronomic traits were consistently measured from 15 plants (five plants per replicate). The number of days to attainment of 50% flowering was counted as the number of days from transplanting to attainment of 50% flowering among each entry. Plant height (m) was measured at 50% flowering and at maturity by random sampling of 15 vigorous plants per replicate. At flowering, 30 flowers per accession sampled at random were measured for petal length and width (cm), sepal length and width (cm), number of petals and sepals per flower (count) measured. The number of fruits per plant, fruits per infructescence and fruit infructescence per plant were counted at harvest. By random sampling of 22 fruits per replicate, fruit calyx length and width (cm) were measured. Total acidity (pH) of the fruits at commercial ripeness and physiological maturity was determined on a pH meter (meq citric acid/100 ml). Further fruit browning after cut was the time taken after cut until the appearance of browning on the cut surface using a stopwatch. At harvest, fruits from the net plot were counted, weighed and processed for determination of fruits per plant, fruit yield (t/ha) and seed yield. By random sampling of three fruits per entry, fruit weight and seed weight were determined. The total soluble solids (TSS) were measured using handheld refractometer on ten randomly selected fruits per entry at the commercial ripeness stage and at physiological maturity. Weight (g) was determined on a sensitive electronic scale (Wagtech International limited ADP 1200l., UK) and bulky weights were measured with a weighing balance. Morpho-agronomic data were subjected to combined analysis of variance (PROC-GLM procedure of SAS (1998)). Quantitative traits were summarized over years and prior to multivariate analysis, all data were transformed (log transformation). Thereafter, means for each trait were subjected to multivariate analyses (principal component (PC) analysis; Sneath and Sokal (Reference Sneath and Sokal1973)) using the PROC PCA procedure of SAS (1997). A dendrogram was constructed based on distance using the average linkage between group methods aptly called the unweighted pair group method of analysis (UPGMA), with squared Euclidean phenotypic distance option Ward's (Ward, Reference Ward1963; Sokal and Michener, Reference Sokal and Michener1958) as grouping criteria, using SPSS version 16.0.
Results
There were significant differences for all the traits among the genotypes, while for years and genotype × year interaction, significant and non-significant differences were found depending on the trait under evaluation (Table 2). The PC analysis revealed that seven out of the 22 principal axes accounted for 75% of the total variation and recorded eigenvalues greater than 1.0. Three of the seven PC axes recorded eigenvalues greater than 2.0 and accounted for 46% of the variation (Table 3). The first PC axis accounted for 19% of the total variation, and was positively correlated with fruit calyx width, fruit length and leaf length at flowering, with moderate and positive values. However, the highest negative coefficients on this component turned out to be fruits per plant and fruits per infructescence. The axis demonstrated an inverse relationship between the fruit calyx length, fruit calyx width and fruits per plant and fruits per infructescence. Fruit yield (t/ha) per hectare marked low positive weights on PC1 and PC2, though negative on PC3. In contrast, seed yield (t/ha) recorded low weights on PC1, but with moderate weight on PC2 and PC3. The second PC axis recorded an eigenvalue of 3.53 and explained additional 16% of the total variation. It depicted an inverse relationship between the fruit width and seed yield (t/ha) with equal loading, and demonstrated high discriminatory ability. Yet, on this axis, seed yield per plant and fruits per infructescence recorded positive and moderate weights. The third PC axis summarized additional 11% of the total variation. High and positive weights were recorded for fruit acidity at physiological maturity, followed by fruit acidity at commercial ripeness, while the correlation value was negative for fruit yield (t/ha). Moderate and positive coefficients were also recorded for fruit browning, seed yield (t/ha) and seed yield per plant (g).
Table 2 Mean square values for morpho-agronomic traits among the 44 accessions of Solanum aethiopicum resulting from the analysis of variance

Lvl, leaf length; Lvw, leaf width; Cl, calyx length; Cw, calyx width; Frpp, fruits per plant; Fr wt/pt, fruit weight per plant; Syd/pt, seed yield per plant; Fry, fruit yield (t/ha); Frl, fruit length; Frw, fruit width; Fr/inf, fruits per infructescence; Ptl, petal length; Ptw, petal width; Pt no., petal number; Ri, refractometric index; Fracom, fruit acidity at commercial ripeness; Frapm, fruit acidity at physiological maturity; Syd, seed yield (t/ha); Fbr, fruit browning; HtFl, height at flowering; HtMt, height at maturity.
***, **, * indicate significance at the 0.1, 1 and 5% level of probability, respectively.
Table 3 Eigenvalues and vectors for seven principal component (PC) axes estimated for morpho-agronomic traits among the 44 accessions of Solanum aethiopicum
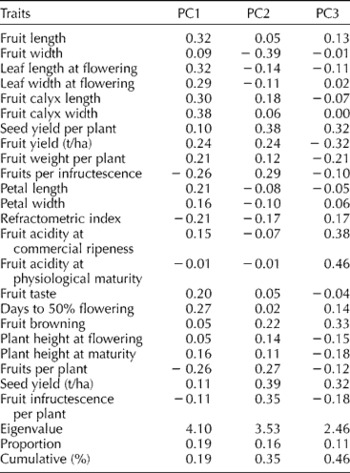
Source: Field data 2008–2010.
The PC analysis has the advantage of showing how distant each accession is from others and the variable most responsible for giving that pattern of relationship among the accessions. The ordination of the 44 accessions of S. aethiopicum along the first and second PC axes accounted for 35% of the total variation, and a spread of the 44 accessions into the four quadrants (Fig. 1). The first quadrant (Q1) was occupied by nine accessions belonging to the Gilo and Aculeatum groups; they were sourced from Africa and South America (Brazil) and Asia (Japan and Thailand). The spread of accessions in this quadrant demonstrated high variability for fruit calyx width and fruit length. Accession 39 (Gilo group) from Burundi was widely separated from the other entries, and contributed high loading and positive coefficients on the first and second PC axes. The second quadrant was occupied by eight accessions from the Gilo group, two accessions from the Aculeatum group (accessions 21 and 19) and one accession from the Kumba group (accession 8). Dispersion of the accessions in this quadrant was associated with the discriminatory power of leaf length and leaf width at flowering. No accessions occupied the upper left corner of the second quadrant, indicating lowest coefficients on PC2, but high loading on PC1. However, accession 21 (Aculeatum) from Yugoslavia was moderately separated from the other accessions in the second quadrant. Thirteen accessions were dispersed in the third quadrant: six accessions in the Kumba group, three accessions in the Aculeatum group and four accessions in the Gilo group. The spread among the accessions in the third quadrant was sequel to variability associated with TSS and fruit acidity at physiological maturity. The accessions belonging to the Gilo and Shum groups occupied the fourth quadrant; ordination in this quadrant was associated with variability for fruits per plant, fruits per infructescence and fruit infructescence per plant. Trends in this cluster revealed moderate loadings for fruits per infructescence on both PC1 and PC2.
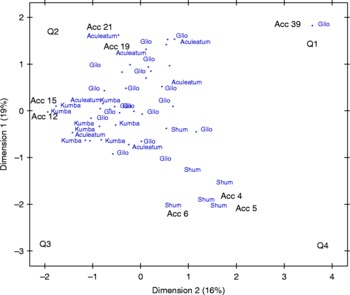
Fig. 1 Plot of the first two PC axes showing the spatial distribution of the 44 accessions belonging to seven Solanum aethiopicum based on morpho-agronomic descriptors. (A colour version of this figure can be found online at http://www.journals.cambridge.org/pgr)
The pattern of variation illustrated by the PC axis was substantiated by correlation coefficients determined for a pairwise association among the morpho-agronomic traits. Consistent with the output of the PC analysis and biplot, traits that contributed most to the first PC (fruit length and leaf length) were negatively associated with the major traits of the second PC (fruit width and seed yield per plant). The fruit length recorded positive and significant correlation coefficients with leaf length (r = 0.52, 1% level of probability), fruit calyx length (r = 0.50, 1% level of probability) and width (r = 0.39, 1% level of probability), but showed a negative association with TSS (r = − 0.31, 5% level of probability). A negative correlation was recorded in the association between the fruit width and fruits per infructescence (r = − 0.45, 1% level of probability), seed yield per ha (r = − 0.44, 1% level of probability), and fruit infructescence per plant (r = − 0.54, 1% level of probability). Fruit yield (t/ha) showed a complementary association with calyx length (r = 0.46, 1% level of probability) and calyx width (r = 0.37, 1% level of probability), although its association with TSS was significantly negative (r = − 0.45, 1% level of probability). Further, fruit yield marked positive and significant correlation coefficients with fruits per plants (r = 0.50, 1% level of probability), plant height at flowering (r = 0.27, 5% level of probability) and plant height at maturity (r = 0.25, 5% level of probability), though associated with a negative correlation with TSS (r = − 0.45, 1% level of probability). Fruit infructescence per plant showed a positive correlation coefficient with fruits per infructescence (r = 0.44, 1% level of probability).
The phenogram constructed for the S. aethiopicum subgroups showed consistence with dispersion on the PC biplot (Fig. 2). The 44 accessions were ordered into three clusters at a 20% level of distance. The first cluster was divided into three sub-clusters, ‘a’, ‘b’ and ‘c’, with the accessions in sub-cluster ‘a’ starting from accession 24 to accession 19. Six accessions from accession 25 to accession 43 were ordered into sub-cluster ‘b’. Accessions 21 and 39 (Aculeatum group) were placed in sub-cluster ‘c’. In the first cluster, the length of time to reach flowering varied; for instance, there were accessions that flowered spanning from 65 to 70 d, 58 and 71 d after transplanting and other 71 d and more (Table 4). Variability in flowering time among the clusters was important for the development of early maturing varieties. The members of sub-cluster ‘c’ are best for earliness, fruit length, seed yield (t/ha) and fruit browning. The members of sub-cluster ‘b’ outperformed the accessions in cluster 1 for fruits per plant, fruits per infructescence, TSS index and fruit infructescence per plant. Also, variation for fruit length and fruit number was large in cluster 1. The accessions in sub-cluster ‘b’ are vigorous and tall; this performance was followed by the members of sub-cluster ‘a’. The second cluster showed geographic heterogeneity; it accommodated 21 accessions divided into four sub-clusters. Sub-cluster ‘a’ comprised four accessions; they are a medium flowering group (average 58 d) with wider fruits. For multiple traits (fruit length, fruits per plant and seed yield), the members of sub-cluster ‘d’ are promising. The members of sub-cluster ‘c’ recorded least time to fruit browning and high seed yield (t/ha). They are characterized by small fruit size compared with the members of cluster 1. The accessions of the Shum group predominated in the third cluster, and were characterized by short leaves and high variability for fruit browning, small fruit size with low fruit acidity at commercial harvest and physiological maturity, poor taste and high TSS. On the other hand, fruit width was best in cluster 2‘a’ dominated by the Kumba group. Among the three clusters, fruits per plant, fruit infructescence per plant and seed yield were superior in cluster 3 (156 fruits per plant), followed by cluster 1. Fruits per infructescence was low in cluster 1‘a’ and cluster 2, though high in cluster 1‘b’ and cluster 3. In contrast, fruit size was small (3 cm in length and width) among the members of cluster 3 compared with cluster 1‘b’ members. Fruit taste was generally good and preferred in clusters 1 and 2, but poor in cluster 3.

Fig. 2 Phenogram produced for the 44 accessions from Solanum aethiopicum derived from UPGMA clustering of correlation coefficients for 22 morpho-agronomic traits by squared Euclidean distance and Ward's method.
Table 4 Average inter-cluster genetic diversity for morpho-agronomic traits among the 44 accessions of Solanum aethiopicum in Arusha, Tanzania
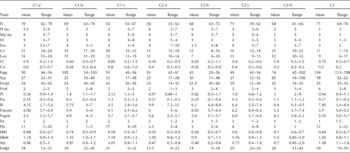
Fl, days to 50% flowering; Pt no., petal number; Sep no., sepal number; Frl, fruit length; Frw, fruit width; Lvl, leaf length; Lvw, leaf width; Cl, calyx length; Cw, calyx width; Frpp, fruits per plant; Syp, seeds per plant (g); Fwtpt, fruit weight per plant; Frinf, fruits per infructescence; Pl, petal length; Pw, petal width; Ri, refractometric index; Fracom, fruit acidity at commercial ripeness; Frapm, fruit acidity at physiological maturity; Frt, fruit taste; Fbr, time to fruit browning; HtFl, plant height at flowering; HtMt, plant height at maturity; Sdy, seed yield (t/ha); Finfpt, fruit infructescence per plant.
Source: field data 2008–2010. C1‘a’ (accessions 24, 26, 23, 41, 33, 22, 29, 19), C1‘b’ (accessions 25, 42, 27, 34, 32, 43), C1‘c’ (accessions 21, 39), C2‘a’ (accessions 14, 20, 12, 15), C2‘b’ (accessions 16, 17, 10, 13, 28, 7), C2‘c’ (accessions 31, 44, 35, 11, 37), C2‘d’ (accessions 36, 40, 8, 9, 38)', C3 (accessions 2, 5, 4, 3, 6, 30).
Discussion
The population evaluated exhibited a large amount of divergence for characters considering the absolute range. Diversity analysis among the S. aethiopicum groups provided information on distinctness, similarities and overlap based on morpho-agronomic traits, which correspond strictly to their genetic status and contribution to the phenotype and environment. The accessions of the S. aethiopicum groups (Gilo, Kumba, Shum and Aculeatum) showed discriminatory ability for calyx width, leaf length and fruit length. These traits are essential for conservation and crop improvement. Ordination (Fig. 1) and grouping (Fig. 2) of the accessions based on morpho-agronomic traits agreed in showing that accessions belonging to the Gilo, Aculeatum and Kumba groups displayed higher genetic variability within each group than among the groups. The dendrogram revealed three distinct groups with a high degree of overlapping and morpho-agronomic plasticity among the Gilo, Kumba and Aculeatum groups, and geographical heterogeneity within the cluster. Dispersion observed among the accessions of S. aethiopicum mirrored variability among the S. aethiopicum subgroups (Sunseri et al., Reference Sunseri, Polignano, Alba, Lotti, Bisignano, Mennella, Alessandro, Bacchi, Riccardi, Fiore and Ricciardi2010). Although accessions of the Kumba group constitute a group, they exhibited high affinity to the Aculeatum group. The pattern of genetic variation in the S. aethiopicum groups could allow for efficient selection of donor parents (specific and multiple traits) for introgression of desirable traits within the group, among the groups and into other species, but also the implementation of an effective genetic conservation programme. In this study, geographic heterogeneity, overlapping phenotypes and morpho-agronomic plasticity are consistent with previous reports of Levin et al. (Reference Levin, Watson and Bohs2005) and Edmonds (Reference Edmonds1978, Reference Edmonds2005) among other Solanum (eggplant and relatives). However, similar genomes (Omidiji, Reference Omidiji1982; Sangowawa, Reference Sangowawa1986; Okoli, Reference Okoli1988) could be responsible for the overlap among phenotypes and grouping observed in the clusters.
The graphical representation showed clear evidence of overlapping genetic status-cluster among the Kumba, Aculeatum and Gilo groups. Observations among the S. aethiopicum groups indicated that cluster analysis identified groups of phenotypic similarity related accessions. Nevertheless, it fails to delimit some accessions in a precise manner; intermediate accessions join any one of the two groups as they share traits with but not all. The findings revealed enormous amounts of genetic variation among the accessions evaluated, since they were collected from diverse ecological regions and belong to different groups. This is not unexpected since the centre of origin is believed to be in Africa. Such a diversity of population over and within groups and geographical locations could be worthwhile for genetic improvement and development of new varieties through intra-species hybridization. However, considering the genetic variation reported in this species, the prospects of improving fruit and seed yield and other yield component traits are large. The proximity observed between the Gilo and Shum groups for morpho-agronomic traits suggests that the Gilo cultivar group might have evolved from the Shum group (Anaso, Reference Anaso1991). Another plausible explanation is that the Shum group might have contributed to the genome of the Gilo group.
Within the S. aethiopicum groups, selection of parents based on leaf length may account for long fruits; on the other hand, improvement in fruit width will correspond to reduced fruits per plant, seed yield per plant and fruit infructescence per plant. Genetic improvement among the groups for fruits per infructescence will complement fruit infructescence per plant. Among the S. aethiopicum groups, the Kumba group is characterized by few and wide fruits per infructescence, high TSS, slightly acidic fruit and good fruit taste. On the other hand, moderate fruits per plant, fruits per infructescence, slightly acidic fruit, high fruit number and seed yield (t/ha) characterized the Aculeatum group. The Gilo group is largely cultivated in sub-Sahara Africa for fruit; it is characterized by high fruits per plant, seed yield per plant, fruits are described as egg-shaped (slightly longer than broad), slightly acidic to sweet fruit and moderate seed yield (t/ha). The members of cluster 1‘a’ could be used as potential donor parents for improvement in fruit length, seed yield and fruit browning through intra- and inter-cluster hybridization. On the other hand, the members of sub-cluster 1‘b’ are superior for fruits per plant, fruit yield (t/ha), fruits per infructescence and TSS and could be selected as potential donor parents in any breeding programme in favour of fruit yield improvement, but not for simultaneous improvement in earliness for which the members of sub-cluster 1‘c’ performed best, while cluster 3 members are best for fruit number. Accessions in cluster 2 constitute early maturing group; they are earlier compared with the other clusters, and could be selected as a donor parent whenever genetic improvement is in favour of earliness, but not for simultaneous improvement in fruit length and fruit yield for which the members of cluster 1 performed best. The members of sub-cluster 2‘a’ are earlier and could be selected as a donor parent for earliness in S. aethiopicum. Fruit length, leaf length, fruit calyx length and flowering time were variable among the accessions within and between the clusters; emphatically, these traits were not restricted to provenance, and they contributed to cluster constellation. Inter-cluster hybridization may possibly evolve hybrids and open-pollinated varieties with improved performance for selection purposes and variety development.
In most farming communities in sub-Sahara Africa, leaves of the S. aethiopicum Kumba and Shum groups are consumed as leaf vegetable and for medicinal purposes (Schippers, Reference Schippers2002). Consumers' preference for fresh fruit is influenced by fruit acidity at commercial harvest among other fruit quality traits (fruit colour, taste and phenolic contents). In addition, fruit browning is an important fruit quality trait associated with the quantity of phenolic compounds in the fruit epidermis. Variability for this trait observed in cluster 1 provides opportunity for selection of a parent with delayed time to fruit browning and possibly lower phenolic contents in the fruit epidermis. This study indicates high variability for fruit length, fruit width, fruit number and earliness among the S. aethiopicum groups. This variability could be exploited for the development of new varieties in Africa.


