


Introduction
Aggressive behavior is a public health challenge that imposes substantial costs on individuals and society (Krug et al., Reference Krug, Dahlberg, Mercy, Zwi and Lozano2002). Considerable research has aimed to identify risk factors for aggressive behavior across the lifespan, but little is known about the latent structure of aggression, specifically, whether aggressive behavior is distributed dimensionally or categorically in the population. The Diagnostic and Statistical Manual of Mental Disorders-5th Edition (DSM-5; American Psychiatric Association, 2013) criteria for intermittent explosive disorder (IED) identifies individuals who have recurrent, problematic, impulsive aggressive behavior. Individuals with IED have either: (1) engaged in frequent verbal aggression or minor physical aggression toward people or objects (A1 criteria); or (2) engaged in at least three serious acts of physical aggression or property destruction in a 12-month period (A2 criteria). Prevalence estimates for DSM-5 IED suggest that 2.6% of the US population meet criteria for current IED with 1.4% meeting the criteria in the past (Coccaro and McCloskey, Reference Coccaro, McCloskey, Coccaro and McCloskey2019). An additional 4% have recurrent impulsive aggressive outbursts but do not fully meet the criteria for IED. An unresolved question is whether individuals with pathological aggression represent a discrete class of individuals, or whether aggression is dimensionally distributed within the general population.
Taxometrics is an analytical approach to evaluating the latent structure of constructs- specifically, whether constructs represent discrete or dimensional phenomena (Meehl, Reference Meehl, Millon and Klerman1986). Growing evidence of the dimensional nature of many psychological constructs and psychological disorders has influenced how disorders are diagnosed and researched. The latent structure of psychopathology has important implications for treatment and research. First, the existence of discrete taxa implies that cases can be identified empirically and that efforts should be directed to adapting diagnostic criteria to identify latent categories (Hinshaw et al., Reference Hinshaw, Lahey and Hart1993). Furthermore, research into phenomena characterized by a discrete latent structure should focus on cases that fall within the taxa of interest, as subclinical cases may yield spurious findings and missed effects (Ruscio and Ruscio, Reference Ruscio and Ruscio2004). In contrast, a dimensional latent structure supports the use of subclinical and analog samples in research, correlational research methods, and the use of clinical decision-making tools to define ‘caseness’ for the purpose at hand.
The latent structure of aggression has important implications, including (1) understanding how the capacity for aggression is distributed in the population, which may aid in optimizing risk assessment for aggressive behavior; (2) understanding the true base rate of chronic aggression in the population; and (3) informing research into aggression. Few taxometric investigations have been conducted on aggressive behavior. The most relevant is a large population-based survey in adults that found support for a taxonic latent structure for IED (Ahmed et al., Reference Ahmed, Green, McCloskey and Berman2010). Their results were supported across separate taxometric procedures, using indicators that correspond with IED symptoms (Ahmed et al., Reference Ahmed, Green, McCloskey and Berman2010). The present study sought to replicate and extend these taxonic findings in a clinically focused sample with standardized assessments of diagnosis and of aggression and related measures in a reasonably large sample of adults engaged in a clinical research program studying aggression and related behaviors.
Methods
Participants
Study participants were 813 adult men and women recruited from the Chicago community and psychiatry outpatient clinics. All participants were systematically evaluated for psychopathology as part of a larger research program on correlates of impulsive aggression and other personality-related behaviors. Subjects were recruited from clinical settings and through newspaper advertisements seeking out individuals who: (a) reported psychosocial difficulty related to one or more syndromal (formally Axis I), or personality (formally Axis II), disorders (i.e. clinical participants: n = 639); or (b) were healthy, and were assessed as having no lifetime psychopathology (i.e. healthy control participants: n = 174). Among the clinical participant group, 346 currently met DSM-5 criteria for IED (American Psychiatric Association, 2013); the remaining 293 participants served as psychiatric controls (PC). All study participants provided informed consent in accordance with procedures approved by the Institutional Review Board of the University of Chicago. Exclusion criteria included history of bipolar or psychotic disorder, intellectual disability, or organic brain disorder. Of the full sample, 386 participants (47.5%) were male (mean ± s.d. for age = 36.6 ± 8.7 years; range: 19–65 years) and 427 (52.5%) were female (mean ± s.d. for age = 33.9 ± 9.3 years; range: 19–58 years). A total of 516 participants (63.5%) self-identified as white; 196 (24.1%) as black or African American; 17 (2.1%) as Asian or Pacific Islander; 49 (6.0%) as Hispanic or Latino; and 35 (4.3%) as other. Most subjects (71.0%) were categorized in the upper-middle two Hollingshead socio-economic classes based on income and family education: I = 18.2%; II = 52.9%; III = 14.8%; IV = 8.0%; V = 6.2%.
Diagnostic assessment
Syndromal and personality disorder diagnoses were made according to DSM-5 criteria (American Psychiatric Association, 2013). Diagnoses were made using information from (a) the structured clinical interview for DSM diagnoses (SCID; First et al., Reference First, Spitzer, Gibbon and Williams1997) for syndromal disorders, the structured interview for the diagnosis of DSM personality disorder (SIDP; Pfohl et al., Reference Pfohl, Blum and Zimmerman1997) for personality disorders, and the interview module for IED (IED-M; Coccaro et al., Reference Coccaro, Lee, McCloskey, Coccaro and McCloskey2019; Kulper et al., Reference Kulper, Kleiman, McCloskey, Berman and Coccaro2015), a semi-structured interview assessment to study impulsive aggressive behavior in a more granular fashion that can be performed by questionnaire assessments.; (b) clinical interview by a master's or doctoral level diagnostic rater; and, (c) review of all other available data. Final diagnoses were assigned by team best-estimate consensus procedures involving research psychiatrists and clinical psychologists as previously described (Coccaro et al., Reference Coccaro, Fanning, Keedy and Lee2016). Psychiatric diagnoses for the three groups are reported in Table 1.
Table 1. DSM-5 Diagnoses in PD and IED study groups

PC, psychiatric control; IED, intermittent explosive disorder.
Measures
Indicators for taxometric analyses
Four indicators were selected from the diagnostic evaluation (IED-M) for the taxometric analyses. The first indicator was the average number of verbally aggressive events as an adult per year, and the second indicator was the average number of physically aggressive events (combining both assault and property damage) as an adult per year. Because they were highly skewed, both indicators were log transformedFootnote 1Footnote †. The third indicator was the sum of four dichotomous questions asking whether prior to or during an anger outburst the respondent: (1) felt out of control, (2) felt like screaming, (3) felt like breaking things, and (4) felt like hitting. These four items were internally consistent with a Cronbach's alpha of 0.78. The final indicator was the sum of four questions asking whether as a result of anger outbursts the respondent ever had problems (1) at work, (2) with the law, (3) with family, and (4) with friends (α = 0.71). The diagnostic criteria for IED were not chosen as indicators because use of such data would increase the risk of generating a ‘pseudo-taxon'. Instead, the taxometric indicators assessed the frequency of verbal and physical aggressive events, the respondents' experience of these events, and the consequences of these events.
Measures to examine the associated features of IED (criterion measures)
Aggression and Related Behaviors. Aggression was assessed in three ways. First was the Aggression sub-scale from the life history of aggression assessment (LHA; Coccaro et al., Reference Coccaro, Berman and Kavoussi1997). LHA aggression quantifies life history of aggressive behavior (e.g. angry outbursts, physical fights, interpersonal assaults). Second, the aggressive acts questionnaire (AAQ; Barratt et al., Reference Barratt, Stanford, Dowdy, Liebman and Kent1999) assesses the number of physical and verbal aggressive acts in the previous 6 months. Third, participants completed the Buss Perry Aggression Questionnaire (BPAQ; Buss and Perry, Reference Buss and Perry1992) which assesses verbal and physical aggressiveness, as well as anger and hostility. Impulsivity was assessed using the life history of impulsive behavior (LHIB; Coccaro and Schmidt-Kaplan, Reference Coccaro and Schmidt-Kaplan2012) and the Barrett Impulsivity Scale-11 (Patton et al., Reference Patton, Stanford and Barratt1995). LHIB impulsivity quantifies life history of impulsive behavior while BIS-11 assesses impulsivity as a personality trait. Current severity of depression and anxiety symptoms were assessed using the Beck Depression Inventory (BDI-II; Beck et al., Reference Beck, Steer and Brown1996) and the Beck Anxiety Inventory (BAI; Beck and Steer, Reference Beck and Steer1993). Quality of life was assessed using the Quality of Life Enjoyment and Satisfaction Questionnaire-Short Form (Q-LES-Q – SF; Stevanovic, Reference Stevanovic2011) which assesses past-month satisfaction across domains such as physical health, work and leisure, daily functioning, social relationships, and overall well-being.
Taxometric Data Analysis. The three taxometric procedures used were mean above minus mean below a cut (MAMBAC; Meehl & Yonce, Reference Meehl and Yonce1994), maximum eigenvalue (MAXEIG; Waller and Meehl, Reference Waller and Meehl1998), and latent mode (L-Mode; Waller and Meehl, Reference Waller and Meehl1998). These analyses were conducted using Ruscio and Wang's (Reference Ruscio and Wang2017) R programs, that were developed to incorporate recent taxometric procedures and analytic strategies, including the comparison curve fit index (CCFI) profile method (Ruscio et al., Reference Ruscio, Carney, Dever, Pliskin and Wang2018). Each of these taxometric procedures generates prototypical curves if the data represent a taxonic construct (i.e. inverse U-shaped curve for MAMBAC and MAXEIG, bimodal curve for L-Mode). The shape of taxometric graphs can also, however, be influenced by factors other than the construct's latent structure, such as skewness or associations among the indicators. To assist with the interpretation of taxometric graphs, simulated data sets that reproduce essential features of the research data while varying its latent structure (taxonic or dimensional) can be compared to the graphs generated by the research data (Ruscio et al., Reference Ruscio, Ruscio and Meron2007). The comparison between the research data curves and the dimensional or taxonic curves can be quantified using a CCFI. CCFI values less than 0.45 support a dimensional latent structure, and those greater than 0.55 indicate that the actual data are more similar to the simulated taxonic data. In a Monte Carlo study, the latent structure was accurately classified 99.9% of the time when all three taxometric procedures yielded CCFIs <0.45 or >0.55 (Ruscio et al., Reference Ruscio, Walters, Marcus and Kaczetow2010).
The Ruscio and Wang (Reference Ruscio and Wang2017) R programs include a new analytic strategy in which taxonic comparison data are generated at every base rate between 0.025 and 0.975 in 0.025 increments. For taxonic constructs, the CCFI value should be greatest at the taxon base rate. Monte Carlo simulations have shown that this CCFI profile method yielded more accurate base rate estimates than alternative methods (Ruscio et al., Reference Ruscio, Carney, Dever, Pliskin and Wang2018). The number of subjects who met the diagnostic criteria for IED provided the base rate estimates for generating the taxonic comparison data for the initial taxometric analyses. Because these initial analyses yielded taxonic results, the CCFI profile method was used to determine the taxon base rates to examine the overlap between taxon membership and meeting the diagnostic criteria for IED and to identify the taxon members for the secondary analyses.
Results
We conducted two sets of taxometric analyses. The first set included all of the participants [i.e. DSM-5 IED (IED), PC, and healthy controls (HC)]. To reduce the risk of finding a ‘psychopathology pseudo-taxon,' the second set of analyses replicated the initial analyses using just the clinical sample (i.e. IED and PC), omitting the healthy control cases. Taxometric analyses require valid indicators that demonstrate at least 1.25 standard deviation units (SDU) of separation between taxon and complement groups (Meehl, Reference Meehl1995). In the full sample, 42% of the participants met the IED criteria and in the clinical sample 54% of the participants did, so these base rates were used to compute indicator validity values (and to generate the taxonic comparison data for the taxometric analyses). In the full sample, the four indicators demonstrated strong validity with an average d of 2.03. The indicator validity was similarly robust for just the clinical sample (M = 1.81 SDU, range 1.30–2.34).
Taxometric analyses
In the full sample, all three taxometric procedures yielded clearly taxonic results. The CCFI values for MAMBAC, MAXEIG, and L-Mode were 0.837, 0.673, and 0.807, respectively, with an average value across these procedures of 0.772. The results remained unambiguously taxonic when the healthy controls were omitted. The CCFI values for MAMBAC, MAXEIG, and L-Mode were 0.865, 0.623, and 0.811, respectively, with an average value across these procedures of 0.766 (Fig. 1). Thus, the presumptive taxon identified by these procedures is not simply separating those with psychopathology from health controls. When taxometric analyses yield a taxonic latent structure, such analyses can also be used to provide an estimate of the taxon base rate. Using the CCFI profile method with the full sample, yielded a taxon base rate estimate of 0.435, which is strikingly close to the 43% of the sample diagnosed with IED. In the clinical sample, the taxon base rate estimate was 0.57, which was also close to the 54% of IED subjects in this subsample. Subsequent analyses were limited to the clinical sample (n = 639).

Fig. 1. Composite curves for the taxometric procedures. The dark lines represent the actual data and the thin lines show the minimum and maximum values from each of the 100 simulations. The shaded gray sections show the middle 50% of the values for all simulated data sets. MAMBAC, Mean Above Minus Mean Below A Cut; MAXEIG, MAXimum EIGenvalue; L-Mode, Latent Mode.
To verify that the taxonic results were not simply confound of having a mixed-gender sample, we ran the analyses separately for the male (n = 298) and female (n = 341) clinical subsamples. Although these subsample were somewhat small for taxometric analysis, both subgroups yielded unambiguously taxonic results (male mean CCFI = 0.762; female mean CCFI = 0.707). Additionally, because most externalizing behaviors are believed to be dimensional, to ensure that the taxonic results for IED were not confound of our sampling strategy, we also ran a set of analyses using the four subscales of the BPA as indicators. These analyses yielded a mean CCFI of 0.321, replicating prior research indicating that many externalizing constructs (and the comorbidity across externalizing facets) are dimensional (e.g. Haslam, Reference Haslam2018; Krueger et al., Reference Krueger, Markon, Patrick and Iacono2005; Walters et al., Reference Walters, Ronen and Rosenbaum2010). Furthermore, because both the indicators for the IED analyses and the BPA are based on participant self-report, these different results (taxonic for IED, dimensional for anger and aggression) are inconsistent with an alternative hypothesis that subject's self-perceptions as ‘aggressive' or ‘not aggressive’ are responsible for the taxonic findings for IED.
Finally, to examine whether these taxometric results converged with an alternative mixture modeling approach (Lubke and Miller, Reference Lubke and Miller2015), we conducted a latent profile analysis on the clinical data. To determine the optimal number of classes, four latent profile models were estimated, and fit indices were used to compare outcomes. The four models included (1) two models that constrained variances across classes to be equal and forced covariances to zero, and (2) two models that freely estimated both variances and covariances across classes. One class and two class models were both estimated for each of the two model types. All estimation was done using the tidyLPA package (Rosenberg et al., Reference Rosenberg, van Lissa, Beymer, Anderson, Schell and Schmidt2019) in R. The results of the four models indicated that model 2 (i.e. freely estimated variances and covariances) with two classes had the optimal fit (Table 2). This best-fitting model assigned 58.7% of cases to the higher mean class, which closely corresponds to the 57% yielded by the taxometric analyses.
Table 2. Goodness-of-Fit statistics for latent profile models
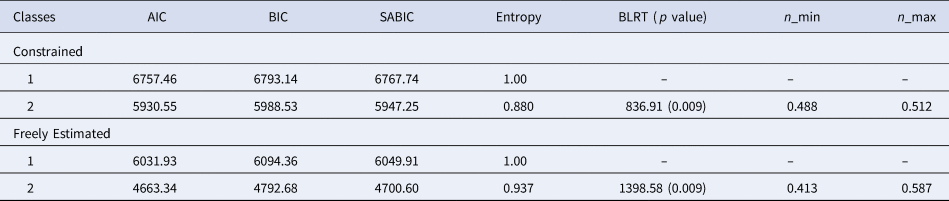
AIC, Aikake Information Criterion; BIC, Bayesian Information Criterion; SABIC, Sample-Adjusted Bayesian Information Criterion; Entropy, certainty of classification across cases; BLRT, bootstrapped likelihood test comparing model to model(k-1), where k, number of classes; significance BLRT indicates improved model fit; n_min, proportion of the sample assigned to the smallest class; n_max, proportion of the sample assigned to the largest class.
Note. ‘Constrained’ models have variances constrained equal across classes and covariances set to zero. ‘Freely Estimated’ models freely estimated both variances and covariances across classes.
Correspondence between DSM-5 IED diagnosis and the taxon
Although the taxon base rates and rates of DSM-5 IED were similar, the items used to create the indicators for the taxometric analysis were not identical to the items used to diagnose IED. Therefore, we examined the overlap between taxon membership and the diagnosis of IED (Table 3). Taxon membership was determined using the base rate classification method (Ruscio, Reference Ruscio2009). Within the clinical sample, the four indicators were standardized and summed and 57% of the cases with the highest combined scores were identified as taxon members. Most (n = 310; 85%) of the taxon members were diagnosed with DSM-5 IED and most complement members (n = 239, 87%) were not diagnosed with IED, but there were some false positives and false negatives (n = 90, 14%, see Table 3). According to DSM-5 criteria, individuals can meet criterion A, recurrent incidents of aggression through either (A1) frequent verbal or physical aggression, or (A2) more severe but less frequent incidents of serious physical assault or property damage. Slightly more than half (19 of 36) of the IED patients who were not identified as taxon members (‘false negatives’), met criterion A1, but not A2. In contrast, a large majority of IED participants with taxon membership met criterion A2 (256 of 310). Overall, 75% (233 of 310) of participants meeting A1 criteria only; 72% (223 of 310) meeting A2 only; and 97% (301 of 310) meeting A1 and A2 criteria belonged to the taxon group. Although the diagnosis of DSM-5 IED and taxon membership overlap considerably, taxon membership may require more severely aggressive behavior than the DSM-5 criteria for IED, even though slightly more people were classified into the taxon than actually met the DSM-5 criteria for IED.
Table 3. Correspondence (N/%) in taxon membership for DSM-5 intermittent explosive disorder and for the psychiatric control group

χ2(1) = 327.75, p < 0.001; sensitivity = 89.6%; specificity = 81.6%; positive predictive value = 85.2%; negative predictive value = 86.9%
Effect of comorbidity
We examined the magnitude of the relationship for the aggressive taxon with DSM-5 IED in the context of comorbidity with binary logistic regression models including demographic variables. The odds ratio (OR) for the aggressive taxon with DSM-5 IED alone was very large [IED: OR 33.33 (95% CI 20.41–52.63), p < 0.001]. Adding syndromal and personality disorders to the regression model reduced the OR to 23.26 [95% confidence intervals (CI) 14.08–38.46; p < 0.001] but with overlapping CI. While the presence of any non-IED syndromal disorder did not significantly increase the odds of being in the taxon group [1.63 (95% CI 0.86–3.10), p = 0.134], the presence of any personality disorder increased the odds of being in the taxon group, though at a significantly lower magnitude [5.52 (95% CI 3.23–9.41), p < 0.001] than that for DSM-5 IED criteria.
Association with criterion variables
To examine the construct validity of our aggressive taxon, we compared the taxon members to the complement members within the clinical sample on aggression and psychopathology-related measures (Table 4). As expected, effect sizes for the anger and aggression measures were mostly large and often very large (Cohen's ds from 0.71 to 1.87). The taxon members also had higher scores on measures of impulsivity (d = 0.57 to 0.71). Taxon members had higher scores on ‘internalizing’ psychopathology such as depression and anxiety (ds = 0.89 to 1.12) and endorsed significantly lower quality of life (d = −0.99) compared to the non-taxon clinical cases.
Table 4. Comparison between complement and taxon groups on external variables

LHA-A, lifetime history of aggression, aggression subscale; AAQ, aggressive acts questionnaire; BPAQ, Buss-Perry Aggression Questionnaire; LHIB-20, life history of impulsive behavior; BIS-11, Barratt Impulsivity Scale; BDI-II, Beck Depression Inventory-II; BAI, Beck Anxiety Inventory; Q-LES-Q-SF, quality of life enjoyment and satisfaction questionnaire (short form).
a α = 0.005 (corrected for multiple comparisons).
b Cohen's d.
c t test computed for unequal variances.
The taxon group was also more likely than the complement group to engage in self-harm. Whereas only 5% of the complement group reported engaging in non-suicidal self-injurious behavior, 14% of the taxon group reported a history of self-injury, χ2(1) = 13.64, p < 0.001. Similarly, whereas 5% of the complement group reported a past suicide attempt, 21% of the taxon had made at least one suicide attempt, χ2(1) = 31.33, p < 0.001.
Discussion
The current study finds support for a taxonic latent structure of recurrent impulsive aggression in adults examined in a clinical research program. DSM-5 IED criteria predicted membership in the aggression taxon with good sensitivity and specificity. Moreover, the relationship between the aggression taxon and the DSM-5 IED criteria was very strong even after accounting for comorbidity.
We used multiple, well-validated procedures to evaluate the latent structure of aggressive behavior as dimensional or categorical. The results of the three statistically independent taxometric procedures were unambiguously taxonic. This was true even when the analyses were conducted only with individuals with psychopathology. The results do not appear to be accounted for by gender, nor are they due to participants describing their aggression in categorical terms. The current results replicate the earlier study by Ahmed et al. (Reference Ahmed, Green, McCloskey and Berman2010) which found a taxonic latent structure of symptoms of IED in a representative epidemiological sample of adults.
The base rate of the aggression taxon identified in our full sample was 43.5%, similar to the rate of DSM-5 IED in the sample (43%). The taxon and DSM-5 IED base rates among the clinical sample were also similar (57% and 54%, respectively). Furthermore, the DSM-5 IED diagnosis demonstrated considerable overlap with estimated taxon membership. Among likely taxon members, 85% met criteria for IED (positive predictive value). Approximately 90% of subjects diagnosed with IED were likely taxon members (sensitivity). Additionally, the absence of IED accurately predicted complement (non-taxon) membership in 87% of cases. In short, the DSM-5 IED criteria accurately predicted probable taxon membership in a large majority of cases. This is true even though we did not use the specific DSM-5 IED criteria as indicators of taxonicity, although both the DSM-5 IED and the aggression taxon were characterized by frequent aggressive behavior.
Cases predicted to belong to the aggression taxon differed significantly from complement cases across a number of domains, most notably those related to anger, aggression, and impulsivity. Taxon members also reported more internalizing psychopathology, including depression and anxiety. Overall, taxon membership was associated with significantly lower reported quality of life, compared to the complement group that comprised clinical control subjects. The taxon identified in the current study bears similarity to that identified by Ahmed et al. (Reference Ahmed, Green, McCloskey and Berman2010) which used (1) lifetime aggression frequency and (2) aggression variety (IED criteria A), (3) aggression (dis)proportion to the provocation (IED criteria B), (4) aggression consequences (IED criteria D), and (5) aggression chronicity as indicators of the aggression latent variable. The taxon identified by Ahmed and colleagues thus characterizes individuals with recurrent, persistent, and impairing (i.e. clinically significant) aggressive behavior. In their study, taxon membership was associated with seeking treatment for anger and aggression (28% of the taxon v. 0.5% of the complement group) and having a family history of anger or aggression (71% v. 3%). In summary, the current study and the previous study by Ahmed et al., both identify taxa associated with recurrent and impairing aggressive behavior.
Given that taxonic constructs are relatively uncommon in psychiatry and given the probably substantial polygenic influences on aggressive behavior, how do we account for the current findings? First, the research identifies aggression as distinct from other ‘rule-breaking’ behaviors that show dimensional latent structure (Hopwood et al., Reference Hopwood, Burt, Markowitz, Yen, Shea, Sanislow, Grilo, Ansell, McGlashan, Gunderson, Zanarini, Skodol and Morey2009). Aggression and rule-breaking differ in developmental course (Nagin and Tremblay, Reference Nagin and Tremblay1999; Broidy et al., Reference Broidy, Tremblay, Brame, Fergusson, Horwood, Laird, Moffitt, Nagin, Bates, Dodge, Lynam, Pettit and Vitaro2003; Cote et al., Reference Cote, Vaillancourt, LeBlanc, Nagin and Tremblay2006), environmental influences (Burt, Reference Burt2009), moderation of genetic influence by age (Burt and Neiderhiser, Reference Burt and Neiderhiser2009), and personality and affective correlates (Burt, Reference Burt2012). Further, physical aggression is normative early in life and shows a declining frequency across development in most children. However, a subset of chronically aggressive youths shows higher levels of aggressive behavior and little or no decrease in overt aggression with age (Nagin and Tremblay, Reference Nagin and Tremblay1999; Tremblay et al., Reference Tremblay, Nagin, Seguin, Zoccolillo, Zelazo, Boivin, Perusse and Japel2004; Cote et al., Reference Cote, Vaillancourt, LeBlanc, Nagin and Tremblay2006). This distinct trajectory of chronic aggressive behavior, it has been suggested, reflects a failure to socialize normatively (Tremblay, Reference Tremblay, Lahey, Moffitt and Caspi2003). The taxonic latent structure of IED is consistent with research indicating that physically aggressive behavior extinguishes during normative development except among as subset of youth who do not unlearn aggressive behavior. Furthermore, although taxonic conditions may result from a dichotomous causal factor (e.g. single gene), it is also possible that certain combinations or interactions between genes and the environment may create a tipping point in which a qualitative transition takes place.
The current findings have several implications. First, we found support for an empirically identifiable subgroup of adults who show recurring aggressive behavior (IED by DSM-5 criteria) with a large majority reporting recurring physically aggressive behavior. These findings, replicate those of Ahmed et al. (Reference Ahmed, Green, McCloskey and Berman2010), and suggest that recurrent aggression is one of a limited number of taxonic diagnostic entities (Haslam et al., Reference Haslam, Holland and Kuppens2012; Marcus and Norris, Reference Marcus, Norris, Zeigler-Hill and Shackelford2018). The DSM-5 criteria for IED show good utility for identifying individuals predicted to be in the aggression taxon. Like DSM-5 IED, the taxon is characterized by recurrent, anger-related aggressive behavior that is associated with negative consequences. Accordingly, the taxon identifies a group of individuals who are at risk for future aggressive behavior. These findings add further support for the validity and utility of DSM-5 IED criteria for identifying individuals with clinically significant recurring aggression who might benefit from intervention.
The current findings also support the idea that DSM-5 IED is a nosological entity distinct from other disorders associated with aggression but which appear to have dimensional latent structure. These include, psychopathy (Marcus et al., Reference Marcus, John and Edens2004; Edens et al., Reference Edens, Marcus, Lilienfeld and Poythress2006; Guay et al., Reference Guay, Ruscio, Knight and Hare2007; Murrie et al., Reference Murrie, Marcus, Douglas, Lee, Salekin and Vincent2007), antisocial personality disorder (Marcus et al., Reference Marcus, Lilienfeld, Edens and Poythress2006; Walters et al., Reference Walters, Diamond, Magaletta, Geyer and Duncan2007), borderline personality disorder (Rothschild et al., Reference Rothschild, Cleland, Haslam and Zimmerman2003; Edens et al., Reference Edens, Marcus and Ruiz2008; Artnz et al., Reference Arntz, Bernstein, Gielen, van Nieuwenhuyzen, Penders, Haslam and Ruscio2009), attention-deficit/hyperactivity disorder (Marcus and Barry, Reference Marcus and Barry2011), conduct disorder (Herpers et al., Reference Herpers, Klip, Rommelse, Taylor, Greven and Buitelaar2017), oppositional defiant disorder (Barry et al., Reference Barry, Marcus, Barry and Coccaro2013), and criminality (Walters, Reference Walters2012). Identifying recurrent aggressive behavior through the DSM-5 IED diagnosis could aid in directing clinical resources toward the treatment of problematic anger and aggression. Another implication of the findings concerns research on aggression. Given that empirically identified taxa identify cases that differ in kind (not just degree) from non-taxon (complement) cases, taxonic constructs may be more appropriately studied by assigning cases to categories based on the taxon boundaries (Coghill and Sonuga-Barke, Reference Coghill and Sonuga-Barke2012; Haslam et al., Reference Haslam, Holland and Kuppens2012). In contrast, correlational methods, which are more appropriate for studying dimensional variables, may mis-specify relationships involving taxonic constructs given the discontinuity within the construct of interest. Similarly, methods of categorizing cases without regard to the taxon boundary (i.e. median split and similar approaches) may also lead to erroneous conclusions. The current results support the use of DSM-5 IED criteria to identify cases of clinically significant aggression because these criteria show good utility for identifying taxon cases. Finally, given its considerable overlap with the aggression taxon, the current results suggest DSM-5 IED criteria have epidemiological utility for identifying rates of clinically significant recurrent aggression in the adult general population.
This study also has limitations. One is the composition of the study control group. To reduce the likelihood of observing a pseudo-taxon, we conducted analyses that were limited to the patient sample, excluding healthy subjects. However, although all subjects in the patient control group met criteria for one or more disorders lifetime, not all subjects currently met criteria for psychopathology. This is consistent with the DSM-5 IED group showing overall greater distress compared to the patient control group. Second, although indicators of aggression frequency, correlates, and consequences, derived from a clinical interview, point to the existence of an aggression taxon, we know little about how taxon membership relates to officially recorded aggression as we did not have access to legal records. We found evidence that taxon membership is associated with physical aggression: 82% of taxon members reported recurrent physical aggression and 97% of IED participants with both physical and verbal aggression belonged to the aggression taxon. Study in a forensic population would provide valuable information about the latent structure of severe or officially recorded aggression and the predictive validity of the IED diagnosis in this population. Finally, taxometric indicators in the current study were based on clinical interview data. Future research may also benefit from utilizing additional methods such as informant ratings; behavioral indicators from laboratory aggression paradigms; and biologic indicators implicated in IED pathology, such as reduced top-down processing of and increased amygdala responding to threatening stimuli (Coccaro et al., Reference Coccaro, McCloskey, Fitzgerald and Phan2007; Fanning et al., Reference Fanning, Berman and Long2014).
In summary, the current study finds unambiguous support for a taxonic (categorical) latent structure of intermittent explosive disorder in a clinically relevant sample of adults recruited from the community. These results replicate the findings of an earlier study in adults by Ahmed et al. (Reference Ahmed, Green, McCloskey and Berman2010) using population-based data. Thus, our study provides further evidence of the taxonic latent structure of chronic aggressive behavior in adults. Taxon members reported more lifetime and recent aggressive outbursts and reported more significant trait anger, hostility, impulsivity, and internalizing symptoms, and lower quality of life. DSM-5 criteria for intermittent explosive disorder showed good sensitivity and specificity in predicting taxon membership.
Acknowledgements
This work was supported by the National Institute Health (J.F., MH109824 and E.F., MH104673, AA26667) and the Pritzker-Pucker Family Foundation (E.F.).
Conflict of interest
Dr Coccaro reports being on the Scientific Advisory Board of Azevan Pharmaceuticals, Inc. and he is a consultant to Avanir Pharmaceuticals, Inc. Dr Lee reports research grants from Azevan Pharmaceuticals, Inc. and Avanir Pharmaceuticals, Inc. Drs. Fanning, Marcus, and Preszler have nothing to disclose.
Ethical standards
The authors assert that all procedures contributing to this work comply with the ethical standards of the relevant national and institutional committees on human experimentation and with the Helsinki Declaration of 1975, as revised in 2008.


