1 Introduction
Mafic rocks are important messengers from the mantle, and their geochemistry may provide crucial information about mantle composition, magma generation and tectonic processes during their formation. In a couple of recent papers, the geochemistry of c. 1.9 Ga old ultrabasic and basic rocks within the Palaeoproterozoic Svecofennian orogen of the Fennoscandian Shield in east-central Sweden has been discussed (Johansson et al. Reference Johansson, Andersson and Hålenius2012; Johansson & Hålenius, Reference Johansson and Hålenius2013). Here, we investigate metamorphosed mafic dykes from the Dannemora area in order to assess their formation and compare them with adjacent mafic plutonic rocks. We use major and trace element geochemistry, as well as isotopic signatures of Sr and Nd, in order to decipher their origin, magmatic evolution and tectonic setting and to obtain an insight into Palaeoproterozoic mantle processes and compositions.
2 Geological setting
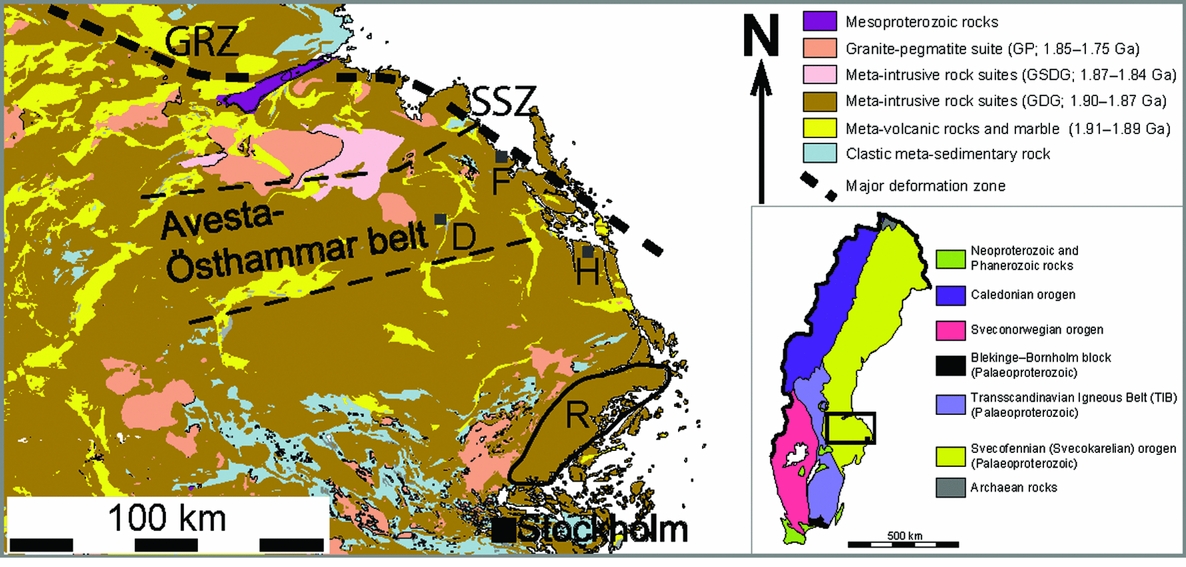
The Fennoscandian Shield shows a general decrease in age from an Archaean nucleus in the northeast through Palaeoproterozoic rocks in the central part to Meso- and early Neoproterozoic rocks in the southwest (e.g. Gaál & Gorbatschev, Reference Gaál and Gorbatschev1987). The Palaeoproterozoic Svecofennian orogen covers the central part of the shield. It is succeeded by the Transscandinavian Igneous Belt (TIB) to the southwest, and overlain by Caledonian nappes to the west and northwest (Fig. 1). The evolution of the Svecofennian orogeny has been divided into four stages: the formation and accretion of microcontinents and volcanic arcs; extension of the newly formed crust; continent–continent collision and crustal thickening; and finally gravitational collapse (e.g. Nironen, Reference Nironen1997; Lahtinen et al. Reference Lahtinen, Korja, Nironen, Lehtinen, Nurmi and Rämö2005; Korja et al. Reference Korja, Lahtinen, Nironen, Gee and Stephenson2006). The entire tectonic evolution roughly spans 1.92–1.77 Ga (e.g. Lahtinen et al. Reference Lahtinen, Korja, Nironen, Lehtinen, Nurmi and Rämö2005), with the various stages partly overlapping in space and time (e.g. Andersson et al. Reference Andersson, Sjöström, Högdahl and Eklund2004 b; Korja et al. Reference Korja, Lahtinen, Nironen, Gee and Stephenson2006; Rutanen & Andersson, Reference Rutanen and Anderson2009). Hermansson et al. (Reference Hermansson, Stephens, Corfu, Page and Andersson2008) proposed a model in which the evolution of the central part of the orogen is the result of migratory tectonic switching of extension and compression within the overriding plate as a response to subduction hinge migration.

Figure 1. Map of the geology of the northern Bergslagen region after Stephens et al. (Reference Stephens, Ahl, Bergman, Lundström, Persson, Ripa and Wahlgren2007). The region is dominated by rocks of the granite-diorite-gabbro (GDG) suite and subordinate metavolcanic rocks. The southern part consists mainly of clastic metasedimentary rocks and anatectic granites. Locations: D – Dannemora area (Fig. 2); F – Forsmark; H – Herräng; R – Rådmansö and the southern Roslagen gabbro area. Regional deformation zones: GRZ – Gävle–Rättvik Zone; SSZ – Singö Shear Zone. Inset (right) shows geological provinces of Sweden with the northern Bergslagen region marked.
The Bergslagen region, which is located in the south-central part of Sweden (Fig. 1), constitutes the southern part of the Svecofennian orogen. The region is dominated by plutonic rocks and subordinate supracrustal rocks (e.g. Stephens et al. Reference Stephens, Ahl, Bergman, Lundström, Persson, Ripa and Wahlgren2009), the latter containing both base metal sulphide and iron oxide deposits (e.g. Allen et al. Reference Allen, Lundström, Ripa, Simeonov and Christofferson1996; Stephens et al. Reference Stephens, Ahl, Bergman, Lundström, Persson, Ripa and Wahlgren2009).
The Bergslagen region is bounded by the Gävle–Rättvik zone (GRZ in Fig. 1; Högdahl et al. Reference Högdahl, Sjöström and Bergman2009) and Singö shear zone (SSZ in Fig. 1; Tirén & Beckholmen, Reference Tirén and Beckholmen1990) to the north and by the TIB (Högdahl et al. Reference Högdahl, Andersson and Eklund2004) to the south. The GRZ coincides with a metamorphic break with higher-grade partly migmatized rocks to the north and greenschist- to amphibolite-grade rocks to the south (Stålhös, Reference Stålhös1991; Andersson, Reference Andersson2005). These tectonic zones have been suggested to represent terrane boundaries or crustal-scale domain boundaries (Lahtinen et al. Reference Lahtinen, Korja, Nironen, Lehtinen, Nurmi and Rämö2005; Högdahl et al. Reference Högdahl, Sjöström and Bergman2009) or separate tectonic domains (ductile high-strain belts; Hermansson et al. Reference Hermansson, Stephens, Corfu, Andersson and Page2007).
The Bergslagen region itself has been interpreted as a rifted continent (e.g. Oen et al. Reference Oen, Helmers, Verschure and Wiklander1982; Van der Velden et al. Reference Van Der Velden, Baker, De Maesschalck and Van Meerten1982), a microcontinent (Lahtinen et al. Reference Lahtinen, Korja, Nironen, Lehtinen, Nurmi and Rämö2005; Beunk & Kuipers, Reference Beunk and Kuipers2012) or a back-arc region similar to the present Taupo Volcanic zone in New Zealand (Allen et al. Reference Allen, Lundström, Ripa, Simeonov and Christofferson1996). The central part of the region chiefly consists of migmatized metasediments, and metagranitoids with related anatectic granites (Stephens et al. Reference Stephens, Ahl, Bergman, Lundström, Persson, Ripa and Wahlgren2009). Metavolcanic rocks occur in subordinate amounts as narrow inliers, with U–Pb zircon ages ranging between 1.91 and 1.89 Ga (e.g. Andersson et al. Reference Andersson, Högdahl, Sjöström and Bergman2006 a; Lundström et al. Reference Lundström, Allen, Persson and Ripa1998; Stephens et al. Reference Stephens, Ahl, Bergman, Lundström, Persson, Ripa and Wahlgren2009, and references therein). Partly coeval with the metavolcanic rocks are the 1.90–1.87 Ga meta-intrusive rocks of the granite-diorite-gabbro (GDG) suite (Stephens et al. Reference Stephens, Ahl, Bergman, Lundström, Persson, Ripa and Wahlgren2009). Younger groups of plutonic rocks are the 1.87–1.84 Ga granite-syenite-diorite-gabbro (GSDG) intrusive rock association and the mainly undeformed 1.85–1.75 Ga granite-pegmatite (GP) suite (Stephens et al. Reference Stephens, Ahl, Bergman, Lundström, Persson, Ripa and Wahlgren2009).
The metamorphic grade in the Bergslagen region is mainly amphibolite facies with isolated areas of greenschist facies in the western parts and granulite facies in the south (Stephens et al. Reference Stephens, Ahl, Bergman, Lundström, Persson, Ripa and Wahlgren2009). Two major metamorphic peaks at c. 1.87 and 1.80 Ga have been recognized from U–Pb dating of zircon and monazite (e.g. Andersson et al. Reference Andersson, Högdahl, Sjöström and Bergman2006 a; Hermansson et al. Reference Hermansson, Stephens, Corfu, Page and Andersson2008). The region experienced poly-deformation with two or locally three fold phases that formed during peak metamorphic conditions (Persson & Sjöström, Reference Persson and Sjöström2003; Stephens et al. Reference Stephens, Ahl, Bergman, Lundström, Persson, Ripa and Wahlgren2009).
2.a Mafic dykes in the Bergslagen region
Mafic and ultra-mafic intrusive bodies are scattered in the Bergslagen region (e.g. Stålhös, Reference Stålhös1991; Stephens et al. Reference Stephens, Ahl, Bergman, Lundström, Persson, Ripa and Wahlgren2009; Rutanen & Andersson, Reference Rutanen and Anderson2009; Johansson et al. Reference Johansson, Andersson and Hålenius2012; Johansson & Hålenius, Reference Johansson and Hålenius2013). Mafic dykes are very common, and Stålhös (Reference Stålhös1991) divided them into three generations. The first generation occurs as mafic dykes in the oldest supracrustal and as enclaves in the GDG suite and is interpreted as syn-magmatic with the granitoids (Andersson, Reference Andersson, Haapala and Condie1991; Wikström, Reference Wikström1992), possibly representing feeder dykes to supracrustal basalts (Stålhös, Reference Stålhös1991; Stephens et al. Reference Stephens, Ahl, Bergman, Lundström, Persson, Ripa and Wahlgren2009). Dating of a meta-aplite, co-magmatic with the mafic and granitoid host rock (first dyke generation) at Forsmark (F in Fig. 1), gave a U–Pb zircon age of 1891±13 Ma (Stephens et al. Reference Stephens, Ahl, Bergman, Lundström, Persson, Ripa and Wahlgren2009). Dating of a metagabbro in the Forsmark area gave a U–Pb (zircon) age of 1886±1 Ma (Hermansson et al. Reference Hermansson, Stephens, Corfu, Page and Andersson2008).
The second generation, referred to as Herräng dykes (Magnusson, Reference Magnusson1940), occurs as abundant WNW–ESE-trending dykes in the NE part of the Bergslagen region, and ranges from dominantly basic to subordinately intermediate and felsic in composition (Stålhös, Reference Stålhös1991). These dykes intrude both supracrustal and metaplutonic rocks but are themselves deformed and metamorphosed, having intruded during an extensional phase followed by renewed compression (cf. Magnusson, Reference Magnusson1940; Stålhös, Reference Stålhös1991). At Forsmark, dykes belonging to this generation intruded during the time span between 1867±4 Ma (U–Pb zircon age of surrounding granite) and 1859±2 Ma (metamorphic U–Pb titanite age from these dykes; Hermansson et al. Reference Hermansson, Stephens, Corfu, Page and Andersson2008).
Dykes belonging to the third generation, which actually comprises several individual generations, intruded after the deformation and are very subordinate in the vicinity to Dannemora but abundant in other parts of Bergslagen (e.g. Stålhös, Reference Stålhös1991; Risku-Norja, Reference Risku-Norja1992; Andersson, Reference Andersson1997 a; Söderlund et al. Reference Söderlund, Isachsen, Bylund, Heaman, Patchett, Vervoort and Andersson2005).
3 Local geology, sampling and analytical methods
The Dannemora area is located in the NE part of the Bergslagen region (Figs 1, 2). The geology of the area consists of rhyolitic to dacitic metavolcanic rocks and marble, forming a N–S-trending inlier surrounded by metagranitoids (Stålhös, Reference Stålhös1991; Lager, Reference Lager2001; Dahlin et al. Reference Dahlin, Allen and Sjöström2012). Iron oxide ore and subordinate sulphide ore occur within the supracrustal sequence.
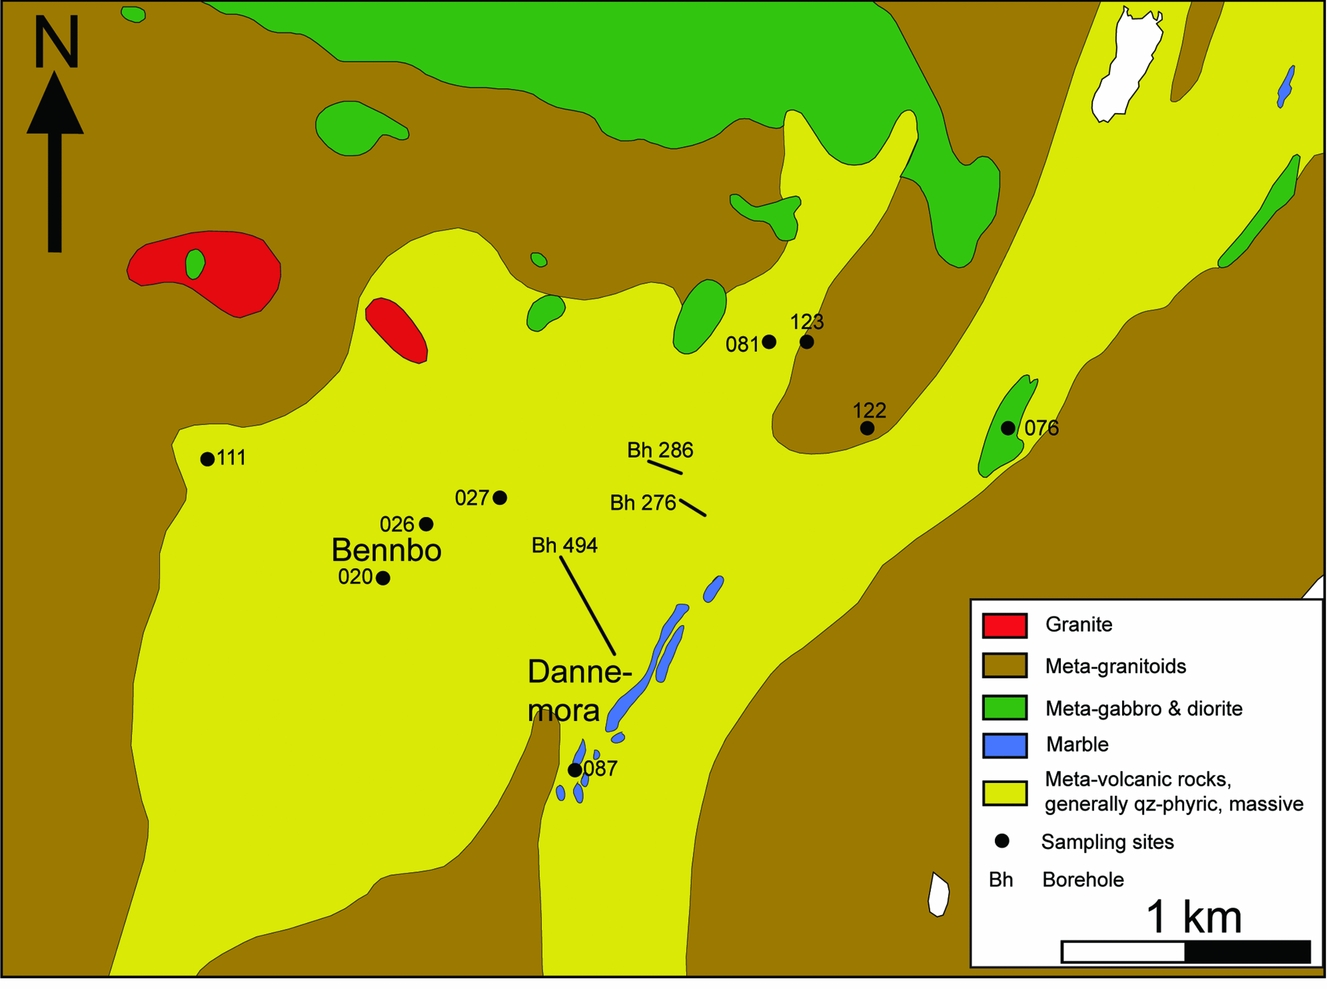
Figure 2. The Dannemora inlier with the GDG-suite that surrounds the slightly older supracrustal rocks and a number of mafic bodies. The sample locations are marked with numbers. Three boreholes (in the central part of the map) were drilled towards the main mining field and cover the whole stratigraphy including the ore horizon (after Stålhös, Reference Stålhös1991). © Geological Survey of Sweden (SGU). Dnr: 30–2169/2007.
Numerous dykes have been recorded in the Dannemora area and the surrounding metagranitoids. Törnebohm (Reference Törnebohm1878) had already described five different dykes ranging from mafic to felsic in composition, mainly based on underground mine mapping in the Dannemora ore field.
For this study, 18 samples of c. 1 kg each were collected from an area of 3×2 km around Dannemora: 8 dykes from outcrops, 9 dykes from three drill cores and one sample (076) from an outcrop interpreted as basaltic amphibolite by Stålhös (Reference Stålhös1991). This interpretation could not be confirmed as no contacts were possible to observe; this sample will therefore be treated as the others but highlighted with a different symbol in the diagrams. The sample strategy was to cover as large an area and as many types of host rock as possible i.e. marble, metavolcanics and metagranitoids. Table 1 displays the location and host rock of the samples.
Table 1. Sample locations and descriptions (Swedish National Coordinate Net 2.5 Gon V, RT90)
Crushing, homogenization and splitting of the samples were carried out at the Department of Earth Sciences, Uppsala University. The samples were milled with a TM Engineering mildsteel ring-and-puck pulverizer and analysed chemically at Acme Labs in Vancouver, Canada using inductively coupled plasma (ICP) emission spectrometry for major elements and inductively coupled plasma – mass spectrometry (ICP-MS) for trace elements (Table 2).
Table 2. Geochemical analyses of the Dannemora samples
Twelve of the 18 samples, including sample 076, were selected for Sr and Nd isotopic analyses. The samples were milled with an agate pulverizer at the Department of Earth Sciences, Uppsala University. The analyses were carried out at the Laboratory for Isotope Geology, Swedish Museum of Natural History. About 100–200 mg of rock powder from each sample was dissolved in Teflon capsules at 205°C for a few days in a 10:1 mixture of concentrated HF and HNO3. Before digestion a mixed 147Sm–150Nd spike was added. After evaporation and redissolution in 6 M HCl, the solutions were passed through TRU-spec columns for separation of Sr and Rare Earth Elements (REE) as a group, and Sr further purified in Sr-spec columns. From the REE solutions, Sm and Nd were separated using Ln-spec columns (Pin & Zalduegui, Reference Pin and Zalduegui1997).
The samples were loaded on double Re filaments and analysed with a Thermo Triton thermal ionization mass spectrometer. The concentrations of Sm and Nd were determined by isotope dilution using the combined 147Sm–150Nd spike, whereas the Rb and Sr contents reported by Acme Labs were used for calculation of initial Sr isotope composition. Corrections for background, spike addition, interference and fractionation were carried out and are reported in the footnotes to Table 3. The results are shown in Table 3, together with results on the NBS SRM987 Sr standard and the La Jolla Nd standard.
Table 3. Sr and Nd isotope data for the Dannemora dykes plus basalt sample 076

1 87Rb/86Sr ratio based on chemical analyses of Rb and Sr by Acme Analytical Laboratories, Vancouver, Canada (Table 2).
2 87Sr/86Sr ratios measured on a Thermo Triton thermal ionization mass spectrometer in static mode, corrected for Rb interference and normalized to 86Sr/88Sr = 0.1194. Two runs of the NBS SRM 987 Sr-standard during the measurement periods gave 87Sr/86Sr ratios of 0.710211±7 and 0.710231±5 (2σ m). Error given as 2 standard deviations of the mean from the mass spectrometer run in the last digits.
3 ɛSr values (at 1870 Ma) and TUR Sr model ages according to McCulloch & Chappell (1982): present-day 87Rb/86Sr mantle ratio = 0.0827, present-day 87Sr/86Sr mantle ratio = 0.7045.
4 Sm and Nd contents and 147Sm/144Nd ratio from isotope dilution analysis with combined 147Sm/150Nd tracer. Estimated analytical uncertainty of 147Sm/144Nd ratio is ±0.5%.
5 Sm and Nd measured with a Thermo Triton thermal ionization mass spectrometer in static mode. 143Nd/144Nd ratios calculated from ID run, corrected for Sm interference and normalized to 146Nd/144Nd = 0.7219. Twelve runs of the La Jolla Nd-standard during a period of 8 months around the measurement period gave a 143Nd/144Nd ratio of 0.511863±9 (2σ, external precision). Error given as 2 standard deviations of the mean from the mass spectrometer run in the last digits.
6 Present-day and initial ɛNd values (at 1870 Ma) calculated using a present-day chondritic 147Sm/144Nd ratio of 0.1966, and a present-day chondritic 143Nd/144Nd ratio of 0.512638 (cf. Dickin Reference Dickin1995). Overall uncertainty in initial ɛNd value estimated to ±0.5 ε units.
7 Model age calculated relative to the chondritic uniform reservoir (CHUR) of Jacobsen & Wasserburg (1984) (recalculated as in Dickin, Reference Dickin1995).
8 Model age calculated relative to the depleted mantle curve (DM) of De Paolo (Reference De Paolo1981).
4 Results
4.a Field observations and petrography
The mafic dykes are very fine grained and have a light greenish-grey to greyish-green tint on weathered surfaces, whereas fresh surfaces are darker grey. Their widths vary from a few decimetres to more than a metre, with apophyses a couple of centimetres wide occurring in places. The strike and dip of the dykes sampled in drill cores could not be derived; field sampling was however accompanied by measurements of strike and dip, and the orientation of the dykes varies a lot around a fold axis dipping c. 65° towards the NW (P. Dahlin, unpubl. data, 2013). The contacts between dykes and host rocks are always sharp and chilled margins have been recorded at scattered locations (Fig. 3a). Dykes within supracrustal rocks are generally discordant, albeit with a low angle to the bedding, but high angles may occasionally be seen (Fig. 3b). The dykes generally display varying amounts of deformation such as boudinage (Fig. 3c), but in outcrop scale folds are rarely seen. Dykes within metagranitoid host rocks always have straight contacts and are not boudinaged. One recorded dyke contains fragments of the metavolcanic host rock (Fig. 3d). Decimetre-wide bleached zones in the wall rock have been recorded around some of the dykes.

Figure 3. (a) Dyke with vugs (encircled) and chilled margins at both contacts to the metavolcanic rock. The width of the chilled margins is highlighted with black lines and one arrow. Pen for scale is 15 cm long. Location is south of Bennbo (cf. Fig. 2). (b) Discordant relationship between dyke and laminated ash-siltstone (indicated by broken lines). Notice the almost perpendicular angle between the two silicate rock types, whereas in the marble the dyke has a lower angle to the bedding. From a drift in the ceiling at 175 m depth in the Dannemora mine. (c) Dyke divided into two boudins and an apophysis (highlighted by broken line). Location is north of Bennbo (cf. Fig. 2). (d) Dyke with a large completely enclosed metavolcanic fragment from sample site 026 (cf. Table 1).
Symmetric <10 mm Ø vugs are common on weathered surfaces and must have formed after the deformation (otherwise they would have been elliptical in shape). The size of the vugs decreases from the centres of the dykes and outwards (Fig. 3a) and it is not uncommon that plagioclase phenocrysts vary in size in a similar way; these vugs are probably holes after weathered plagioclase crystals. The dominating minerals in the rocks are epidote and chlorite with subordinate amphibole, sericite, calcite, quartz and titanite. Sample 087, which is hosted by marble and metavolcanic rocks, is the only one dominated by amphibole. Plagioclase phenocrysts occur as completely saussuritized aggregates consisting of epidote and sericite. Sparse euhedral pyrite grains, <1 mm in size, are the main opaque phase.
4.b Geochemistry
The SiO2 concentrations show a narrow range between 46 and 51 wt% with two exceptions: sample 087 with SiO2 of 43 wt% and sample 076 with 54 wt% SiO2 (Table 2). Sample 087 has the highest concentration of Ca of all samples and very low contents of Na, K, Rb and Ba. It comes from a dyke partly hosted by marble, with which it may have undergone metasomatic exchange. Sample 076 comes from a rock interpreted to be of volcanic origin by Stålhös (Reference Stålhös1991), and appears to deviate geochemically from the dykes.
A significant metasomatic alteration of the dykes is indicated when plotted in Hughes’ igneous spectrum (Fig. 4a; Hughes, Reference Hughes1972), where all samples except 076 plot outside the defined field of magmatic compositions. Samples that cluster close to the igneous spectrum are grouped as least altered and the rest as altered. This division is used in subsequent diagrams. The total alkali content is fairly constant for most samples, but an increasing dominance of K2O over Na2O is seen as a shift towards the right in the diagram for the altered samples (Fig. 4a). In a diagram of K2O versus Na2O the altered samples tend to plot outside fields for magmatic compositions (Fig. 4b).
Figure 4. (a) Igneous spectrum diagram after Hughes (Reference Hughes1972). Striped field defines magmatic composition of non-altered rocks. The least-altered rocks cluster close to the igneous spectrum field, whereas the more-altered rocks scatter along the x-axis. (b) Diagram showing K2O versus Na2O. The grey field represents c. 1.8 Ga mafic rocks (excluding ultrabasites) from the Transscandinavian Igneous Belt (TIB) and post-collisional shoshonitic rocks from further east in the Fennoscandian Shield (see Andersson et al. Reference Andersson, Högdahl, Sjöström and Bergman2006 b; Rutanen et al. Reference Rutanen, Andersson, Väisänen, Johansson, Fröjdö, Lahaye and Eklund2011) as examples of magmatic alkali-rich compositions. Other shoshonitic and ultrapotassic igneous rocks plot at signifcantly higher Na2O and K2O compositions (e.g. Turner et al. Reference Turner, Arnaud, Liu, Rogers, Hawkesworth, Harris, Kelley, Van Calsteren and Deng1996; Miller et al. Reference Miller, Schuster, Klötzli, Frank and Purtscheller1999; Zhang et al. Reference Zhang, Xiao, Wang, Wang and Kusky2008; Zhao et al. Reference Zhao, Mo, Dilek, Niu, De Paolo, Robinson, Zhu, Sun, Dong, Zhou, Luo and Hou2009). The dashed line encloses other rocks with magmatic composition (Pe-Piper, Reference Pe-Piper1983; Meen, Reference Meen1987; Leslie et al. Reference Leslie, Danyushevsky, Crawford and Verbeeten2009; Ishizuka et al. Reference Ishizuka, Yuasa, Tamura, Shukuno, Stern, Naka, Joshima and Taylor2010; Yang et al. Reference Yang, Niu, Shan, Luo, Sun, Li, Li and Yu2012). Most of the altered samples also plot outside magmatic compositions.
The Mg number (100×molar Mg/(Mg+Fe2+), assuming that Fe2+ = 0.85×Fetot) ranges from 71 to 47. The MgO content varies between 4.8 and 11.3 wt%. In Figure 5, MgO has been used as a differentiation index. Most of the major elements show no distinct trends with respect to decreasing MgO and no systematic difference between altered and least-altered samples (except for Na2O and K2O). For SiO2, a slight increase from c. 47 to c. 50 wt% (disregarding the outliers of samples 076 and 087) may be discerned. The content of Al2O3 increases from c. 14 to c. 18 wt%, CaO scatter in the interval 8–13 wt%, and FeO-tot cluster around 11 wt%. Among the trace elements, Ga shows an increase similar to that of Al2O3, from c. 14 to 18 ppm. Cobalt decreases from c. 45 to 25 ppm with decreasing MgO, Cr shows a very marked decrease from >1000 ppm to c. 20 ppm, and Ni a strong decrease from 150 to c. 10 ppm. Vanadium and Sc display flat trends at c. 200–300 ppm and 35–50 ppm, respectively. Many other trace elements, e.g. Rb, Ba and Sr, but also more immobile incompatible trace elements scatter when plotted against MgO (Fig. 5) but show good linear trends in Figure 6 (e.g. Zr, Y, Ce and other REE).

Figure 5. Selected major and trace elements plotted against MgO. Differentiation (fractionation) goes from right to left as MgO decreases during differentiation. Samples 076 (basaltic amphibolite: filled square) and 087 (altered mafic dyke partly hosted by marble) have been specially marked.
Figure 6. Selected major and trace elements plotted against the incompatible and immobile trace element Nb. Sample 076 is indicated by a filled square. Near linear trends in these diagrams probably reflect mixing with subordinate differentiation; scatter reflects disturbances of more mobile elements, or combined fractionation and mixing.
In Figure 6, major and selected trace elements have been plotted against Nb. Elements such as SiO2, FeO, CaO, TiO2 and Al2O3 show semi-horizontal trends, whereas MgO, K2O and Na2O scatter. The trace elements Ce, Zr and Nd plot with positive slope relative to Nb and Sr with a negative slope, whereas the elements Ba, Rb and Th scatter.
The total REE contents are between 40 and 100 ppm. Normalized to chondrite, the (La/Yb)n range between 2.7 and 9.0, (La/Sm)n between 1.5 and 3.1 and (Gd/Yb)n between 1.4 and 2.0 (Table 2; Fig. 7a). The strongest REE enrichment is seen for the carbonate-hosted dyke 087 and sample 026. Sample 276-146 shows higher enrichment mainly in the light REE (LREE). Samples 027 and 286-5 show less enrichment in heavy REE (HREE) than the others. The Eu-anomaly ranges between 0.90 and 1.28, mostly positive, suggesting some accumulation of plagioclase during crystallization or contamination by the lower crust. The trace element variation diagram shows enrichment in large-ion lithophile elements (LILE) such as K, Rb and Ba as well as Th, and troughs for Ta–Nb and Zr–Hf (Fig. 7b), as is typical for subduction-related rocks (e.g. Pearce & Peate, Reference Pearce and Peate1995; Davidson, Reference Davidson1996). Sample 087 has a divergent pattern with K and Rb just above 1 and Ba c. 5.

Figure 7. Trace and rare earth element variation diagrams. (a) REE normalized to C1/Chondrite. LREEs are mildly enriched compared to HREEs, with Eu anomalies between 0.90 and 1.28. Normalizing values from Sun & McDonough (Reference Sun, Mcdonough, Saunders and Norry1989). (b) Trace element variation diagram (spider-diagram) normalized to N-MORB, showing enriched values for the LILE and troughs for Ta–Nb and Zr–Hf. Normalizing values from Sun & McDonough (Reference Sun, Mcdonough, Saunders and Norry1989). The shaded areas show the compositions of the Avesta–Östhammar gabbros and diorites (Johansson & Hålenius, Reference Johansson and Hålenius2013).
4.c Isotopes
The Sr and Nd isotope data of the 12 analysed samples are displayed in Table 3. The Rb contents show a wide range between 0.8 ppm (for the marble-hosted dyke 087) and c. 100 ppm, whereas the Sr contents range between 155 and 575 ppm, yielding 87Rb/86Sr ratios of 0.0107–0.9728. The measured ratios of 87Sr/86Sr range from 0.704064 to 0.730795, whereas the initial 87Sr/86Sr ratios calculated using ICP-MS data at an assumed age of 1870 Ma scatter between 0.70173 and 0.70612, corresponding to an initial ε Sr of –8 to +55. The Sm concentrations vary between 2.2 and 4.7 ppm and Nd between 8.5 and 22.1 ppm, resulting in 147Sm/144Nd ratios of 0.1291–0.1654. The present-day measured ratios of 143Nd/144Nd fall between 0.511829 and 0.512335, and the initial ε Nd values calculated at 1870 Ma fall between +0.4 and +1.6 (Fig. 8). A Sm–Nd isochron calculation through all 12 points yields an imprecise age of 2064±110 Ma (2σ, MSWD 2). This age is about 200 Ma older than the geological age of the dykes.

Figure 8. Initial ɛ Nd versus initial ε Sr for the Dannemora mafic dykes (at 1.87 Ga) and sample 076 (at 1.90 Ga), compared to the c. 1.89 Ga southern Roslagen gabbros (Johansson et al. Reference Johansson, Andersson and Hålenius2012) and the gabbros and diorites of the Avesta–Östhammar belt (Johansson & Hålenius, Reference Johansson and Hålenius2013). CHUR – chondritic uniform reservoir; DM – depleted mantle. While having a small range of initial ɛ Nd values, the Dannemora dykes show a much larger spread in initial ɛ Sr towards the enriched side, possibly reflecting later disturbances in the Rb–Sr system.
5 Discussion
5.a Age of the Dannemora dykes
The absolute age of the Dannemora dykes has not been determined. However, as the dykes are intruding both the supracrustal rocks and the surrounding granitoids, have been folded at least once and are metamorphosed in greenschist facies, they are inferred to be coeval with the second generation of dykes recognized by Stålhös (Reference Stålhös1991) and similar in age to the Herräng dykes and the mafic dykes in Forsmark, dated to between 1870 and 1860 Ma (Hermansson et al. Reference Hermansson, Stephens, Corfu, Page and Andersson2008). The overall geochemical similarity suggests that all the sampled dykes in the Dannemora area belong to the same dyke swarm, and formed during a short period of time by the same magmatic processes.
The Sm–Nd isochron age of 2.06±0.11 Ga and the T DM model ages of 2.16–2.25 Ga for the individual samples do not reflect the age of intrusion for these dykes; instead, they may reflect the age of formation of the enriched source components or mixing between these components.
5.b Alteration and crustal contamination
The mobility of some major and trace elements during alteration, metamorphism and weathering is well documented (e.g. Nesbitt & Young, Reference Nesbitt and Young1984, Reference Nesbitt and Young1989; Sturchio et al. Reference Sturchio, Muehlenbachs and Seitz1986). The strong enrichment in K2O relative to Na2O is not compatible with magmatic compositions of mafic rocks, as magmatic enrichment in K2O is normally accompanied by enrichment in Na2O (Fig. 4); instead, it suggests that the dykes have been subjected to post-magmatic alkali metasomatism with a resultant enrichment in K2O and depletion in Na2O. Breakdown of the magmatic plagioclase and depletion of the released Na during metamorphism, paired with an influx of external K (from the country rocks) accommodated in very fine-grained sericite, appears a possible explanation.
The metasomatism has also clearly affected Rb (cf. Fig. 5). Although not systematically depleted or enriched, metasomatism may also have affected other potentially mobile elements, e.g. Ba, Sr and Th. Petrogenetic interpretations of diagrams including these elements therefore have to be made with caution. The lack of systematic differences between altered and less-altered samples in the concentration of most elements (except the alkalis) however suggests that the original magmatic compositions have been largely retained during alteration. We therefore do not believe there was any systematic change in the concentration of MgO or of most other major or trace elements due to alteration. The interpretation of the geochemistry is, however, mainly based on immobile elements and/or the composition of the least-altered samples. High-field-strength elements (HFSE) such as Zr, Ti and Nb are usually immobile. Good linear trends for pairs of supposedly immobile elements suggest that they were indeed immobile in this case (Fig. 6; e.g. MacLean & Barrett, Reference Maclean and Barrett1993).
The composition of sample 087 most likely reflects reactions with the surrounding marble, rather than an original primitive character with SiO2 of c. 43 wt%. However, this sample generally does not plot as an outlier in immobile trace element plots. On the other hand sample 076 plots as an outlier in many diagrams and may therefore represent an older volcanic basalt flow unrelated to the dykes, as suggested by Stålhös (Reference Stålhös1991). However, no contacts have been recorded and the location of the outcrop within a regional-scale ductile deformation zone hinders further interpretation.
The geochemical data (e.g. displayed in Fig. 5) are not generally compatible with a model of bulk contamination by continental crust, which for example has higher HFSE at higher SiO2. Moreover, the overall basaltic compositions suggest that the magmas were not contaminated by felsic crustal rocks, thereby indicating a short residence time for the magmas in the middle and upper crust before ascent and intrusion.
5.c Magmatic composition and evolution
Since MgO is strongly compatible and decreases with fractionation it is commonly used as a differentiation index for basaltic rocks. Niobium, on the other hand, is incompatible and usually immobile (e.g. MacLean & Barrett Reference Maclean and Barrett1993; Hastie et al. Reference Hastie, Kerr, Pearce and Mitchell2007), and should therefore show an increase with increasing degree of fractionation. Diagrams with incompatible–incompatible elements, such as Zr versus Nb, display linear trends with positive slopes (Fig. 6). Such trends are also seen for diagrams with two compatible elements, e.g. MgO versus Co or Cr (Fig. 5). In contrast, diagrams showing incompatible–compatible elements for the same magmatic system, e.g. Nb versus MgO, should show negative slopes but tend to scatter in the present case (Fig. 5).
The strong decrease of the highly compatible elements MgO (from 12 to 5 wt%) and Cr (from >1000 to <50 ppm) with fractionation in the Dannemora dykes suggests crystallization of mafic minerals (olivine, chromite, pyroxene); consequently, the samples represent variable stages of fractionation of basaltic magma. However, the fractionation-controlled increase in incompatible elements in these basaltic melts was probably limited as long as most of the magma reservoir remained liquid. The linear trends seen in bivariate plots of Ce, Zr, Y and Yb versus Nb (Fig. 6) are not interpreted as differentiation trends, because such a process would result in a negative correlation between Nb and MgO. These trends are instead interpreted as the effect of mixing between at least two components with similar primitive major element compositions: one is less enriched in incompatible trace elements (e.g. 2 ppm Nb or less) and the other more enriched (e.g. 8 ppm Nb or more).The different dykes represent variable mixtures of the magma components that have differentiated to various stages.
The fractionation is best seen in plots combining two compatible ‘mafic elements’ such as MgO–Cr or MgO–Ni (Fig. 5) where they have a positive correlation, but also in some plots combining one compatible and one incompatible element such as MgO–Ga and MgO–Al2O3 (Fig. 5) provided that the different mixing components had similar concentrations of the elements involved. The mixing is best seen in plots of two immobile and incompatible elements such as Nb–Ce, Nb–Hf or Nb–Zr (Fig. 6), where the magma components had different starting compositions and the elements involved were little affected by fractionation. Combining MgO versus Nb or MgO versus Ce (Fig. 5), the analyses scatter as both processes are combined in a complex way in such plots with the variation of one element controlled by fractionation and the other by mixing.
The combined evidence from Figures 5 and 6 would suggest that, unlike MgO, Al2O3, Ga, Co, Ni and Cr, the distribution of most of the incompatible trace elements is not controlled primarily by fractionation, but by mixing between two or more components. Both Nd and Sm (not shown) show near-linear trends when plotted against Nb, indicating that these elements were immobile and that the Sm–Nd isotope system is intact. Unlike the chemical composition of magmas, the isotopic composition of Nd is not affected by fractionation, but only by mixing of different magmas and assimilation of wall rocks. In Figure 9 the initial ε Nd values have been plotted against MgO, Al2O3, Nb and Nd. A triangular distribution of sample points suggests mixing between at least three components, M1, M2 and M3, which all have high MgO concentrations of c. 12 wt%. These components represents end-member magma compositions with distinct mantle sources. Note that there may be more than three mantle-derived components involved; these cannot be resolved, however. The position of each sample point within these diagrams represents a magma with a unique combination of mixing between these components and degree of fractionation. Data points shifted towards lower MgO and higher Al2O3 (Fig. 9a and b, respectively) represent magma batches of variably mixed and more evolved composition. In the other diagrams (Fig. 9c, d) the distribution of data points is mainly controlled by mixing between the three components, with only limited fractionation. Plotting of many such diagrams with elements in different combinations has made it possible to deduce the approximate end-member compositions of the three components.

Figure 9. (a) Initial ɛ Nd versus MgO concentration for the Dannemora dykes and basaltic amphibolite sample 076. (b) Initial ɛ Nd versus Al2O3. (c) Initial ɛ Nd versus Nb. (d) Initial ɛ Nd versus Nd. The inferred mixing components (M1, M2, M3) and their fractionation and mixing trends are indicated. All three components have similar basaltic major element compositions, with c. 47–50 wt% SiO2, 13.5–14.5 wt% Al2O3 and c. 12 wt% MgO, but differ in their incompatible trace element contents (exemplified by Nb and Nd) and their initial ɛ Nd value. While the MgO and Al2O3 concentrations of the mixtures are strongly affected by fractionation (filled arrows), the incompatible trace elements are only slightly affected by fractionation but mostly by mixing (solid lines). The ɛ Nd values are only affected by mixing and not at all by fractionation.
These compositions are summarized in Table 4 (mixing components M1–M3). The major element composition of all three magmas is basaltic, although some differences can be discerned. M1 may be slightly higher in SiO2 (c. 50 wt% versus 46–47 wt% in M2 and M3) and lower in CaO (8 versus 12 wt%). Above all, M1 is enriched in P and in many incompatible trace elements including Hf, Nb, Ta, Zr, Y and REE. Magma M2, on the other hand, is higher in K2O, Na2O, Rb, Ba and Cs. Magma M3 shows strong enrichment only in Sr. It also has a higher (more primitive) initial ε Nd value of c. +1.8, whereas the two other magmas have isotopically more evolved Nd with ε Nd values around +0.5 (Table 4). Even though the difference in initial ε Nd is small, it is larger than the estimated analytical uncertainty of ±0.5 ε units and is correlated with other geochemical characteristics, suggesting that it is real.
Table 4. Approximate composition of the proposed start magmas (mixing components M1–M3) and the inferred end magma (most-evolved magma)

In Figure 10, the inferred rare earth and trace element compositions of the three magma components from Table 4 have been plotted in relation to the composition of the dyke samples (grey fields), the inferred start magmas for the Roslagen gabbro cumulates (Johansson et al. Reference Johansson, Andersson and Hålenius2012) and the Avesta–Östhammar belt gabbros and diorites (Johansson & Hålenius, Reference Johansson and Hålenius2013), and average compositions for N-MORB (normal mid-ocean ridge basalt), E- (enriched-) MORB, OIB (ocean island basalt; Sun & McDonough, Reference Sun, Mcdonough, Saunders and Norry1989) and oceanic and continental VAB (volcanic arc basalt; Kelemen et al. Reference Kelemen, Hanghøj, Greene and Rudnick2005). All of the three end-member magmas have their own character. Magma M1 stands out as most enriched in REE and HFSE. Magma M2 is strongly enriched in LILE (K, Rb and Ba, except Sr), but substantially less enriched in REE (especially HREE) and HFSE. Magma M3 is enriched in Sr but not in other LILE and HFSE, and has a much flatter (less-evolved) REE profile than the other magma components. All the three Dannemora end-member magmas are broadly similar to the inferred start magmas for the Roslagen gabbro cumulates (most similar to M1) and the Avesta–Östhammar belt gabbros and diorites (most similar to M3), and to the trace and rare earth element patterns of volcanic arc basalts with negative troughs for Ta–Nb and Zr–Hf (Fig. 10).

Figure 10. (a) REE and (b) trace element variation diagrams, showing the inferred compositions of the three magma components M1–M3 (Table 4). For comparison, the inferred start magmas for the Roslagen gabbro cumulates (Johansson et al. Reference Johansson, Andersson and Hålenius2012) and the Avesta–Östhammar belt gabbros and diorites (Johansson & Hålenius, Reference Johansson and Hålenius2013) are also shown, as well as average compositions for E- and N-MORB and OIB (oceanic island basalts; Sun & McDonough, Reference Sun, Mcdonough, Saunders and Norry1989) and continental and oceanic volcanic arc basalts (C-VAB and O-VAB; Kelemen et al. Reference Kelemen, Hanghøj, Greene and Rudnick2005). The shaded bands show the composition of the Dannemora dyke samples (the lines in Fig. 7a, b).
Compared to N-MORB all three magma components show elevated Nb/Yb ratios (Fig. 11a, b, c). This is most evident in magma M1, which may be perceived as being derived from melt-enriched mantle, i.e. mantle rocks enriched in incompatible elements (HFSE and REE) that are only mobile in melts (e.g. Pearce & Peate, Reference Pearce and Peate1995). Magma M2, on the other hand, is mainly enriched in fluid-mobile incompatible elements (LILE), reflecting an additional subduction-related slab component.

Figure 11. (a) Zr/Yb; (b) TiO2/Yb and (c) Th/Yb versus Nb/Yb (after Pearce & Peate, Reference Pearce and Peate1995), suggesting an enriched MORB source with an additional slab component visible for Ti and Th. M1–M3 are the inferred end-member magma compositions. Grey shaded areas show the composition of gabbros and diorites from the Avesta–Östhammar belt (Johansson & Hålenius, Reference Johansson and Hålenius2013).
The composition of the mafic dykes was thus controlled by mixing of these magma/source components (mostly seen in immobile incompatible elements and Nd isotopes), supplemented by various degrees of fractionation (affecting the compatible elements more strongly). It is not known exactly when and where the mixing and fractionation process outlined above occurred. Mixing may have occurred already in the source, such that distinct mantle sources generated individual magmas defined within the compositional space of the end-member magmas, or by mixing of magmas of the distinct end-member magma compositions. Regardless of process (or combination of the processes), the mantle magmas rose, mixed and fractionated in several magma chambers to arrive at the final unique compositions of each emplaced dyke. The combined mixing and fractionation processes were then overprinted by metasomatic alteration, particularly depletion in Na2O and enrichment in K2O and Rb.
5.d Tectonic setting
All of the Dannemora dyke samples have a sub-alkalic basalt composition (Fig. 12a). The characteristic shape of the trace element variation diagram (Figs 7b, 10b), with enrichment in LILE and LREE and relative depletion in Nb–Ta and Zr–Hf, suggests that the Dannemora dykes formed from mafic magmatism in a subduction-related environment (e.g. Pearce & Peate, Reference Pearce and Peate1995; Davidson, Reference Davidson1996). The ‘LILE hump’, most marked in magma M2 (Fig. 10b), is therefore partly related to subduction enrichment of the source although it has probably been enhanced by metasomatic additions to some of the samples.

Figure 12. Tectonic discrimination diagrams. Sample 076 is marked with a filled square. (a) Zr/TiO2 versus Nb/Y, where the rocks plot as sub-alkaline basalts (after Winchester & Floyd, Reference Winchester and Floyd1977). (b) Th-Hf-Ta diagram, where the rocks classify as calc-alkaline derived from subduction-related magmas (after Wood, Reference Wood1980). (c) The calc-alkaline and active continental margin character of the rocks is also supported by the La-Y-Nb diagram (after Cabanis & Lecolle, Reference Cabanis and Lecolle1989). (d) Th/Yb versus Ta/Yb plot, showing a vertical scatter between active continental margin (ACM) and within-plate volcanic zone (WPVZ). OA – oceanic arc; WPB – within plate basalt; MORB – mid-ocean ridge basalt (after Pearce, Reference Pearce, Hawkesworth and Norry1983; Gorton & Schandl, Reference Gorton and Schandl2000). Grey shaded areas show composition of gabbros and diorites from the Avesta–Östhammar belt (Johansson & Hålenius, Reference Johansson and Hålenius2013).
The calc-alkaline character and the tectonic setting in an active continental margin (ACM) are consistent in most of the tectonic discrimination diagrams (Fig. 12b, c, d). In the ternary Th-Hf-Ta diagram (Fig. 12b) the samples cluster along a line oriented approximately perpendicular to the Th corner. Part of the scatter in Th may however be caused by alteration. This spread in Th is also noticeable in the Th/Yb versus Ta/Yb plot (Fig. 12d), which classifies about 2/3 of the samples as within plate volcanic zone (WPVZ). As the Bergslagen region is interpreted as a back-arc (Allen et al. Reference Allen, Lundström, Ripa, Simeonov and Christofferson1996), the WPVZ signature might have emanated from the upwelling of enriched mantle below thinned continental crust, perhaps during initial back-arc extension. The ratio between subduction zone component and MORB component can change over time (Pearce & Peate, Reference Pearce and Peate1995) and the influence of the subduction zone component decreases when the back-arc region ‘matures’ into back-arc spreading (Pearce et al. Reference Pearce, Alabaster, Shelton and Searle1981). However, the relatively rare occurrence of basaltic rocks in the Bergslagen region suggests that the extension ceased before back-arc spreading was fully developed into sea-floor spreading.
In summary, similarly to the Herräng dykes, the Dannemora dykes are inferred to have intruded into already-formed continental crust during an extensional event (possibly related to back-arc spreading) rather than in a primitive island-arc during active subduction. The island arc or subduction signature seen in several of the diagrams may be inherited from a source previously affected by subduction, and need not necessarily indicate an island-arc environment or ongoing subduction at the time of dyke intrusion.
5.e Source character
Partial melting of the mantle results in a residue depleted in incompatible elements. The HFSE in Figures 7b and 10b show similar or lower contents than MORB, pointing towards an early depletion event in the mantle source of the Dannemora dykes. As stated earlier, the great variation of, for example, Nb and Zr is ascribed to heterogeneities within the mantle source region giving rise to at least three different source magmas, followed by fractionation and magma mixing, rather than contamination from upper continental crust or alteration. Heterogeneities with variable re-enrichment of incompatible elements may have developed during subduction-related magmatism at c. 1.9 Ga, or even prior to that. The enriched character of the source regions may be explained by the additions of LILE, Th, U and LREE by fluids and melts released from the subducting slab by dewatering and melting of sediments and hydrothermally altered oceanic crust (e.g. Pearce & Peate, Reference Pearce and Peate1995). Partial melting of such re-enriched mantle sections generated the LILE- and LREE-enriched Dannemora dyke magmas. Similar models were advocated for 1.9–1.8 Ga basic rocks from elsewhere in the Swedish Svecofennian and TIB by e.g. Andersson (Reference Andersson1997b ), Andersson et al. (Reference Andersson, Eklund and Claeson2004a , Reference Andersson, Sjöström, Högdahl and Eklund2006b , Reference Andersson, Rutanen, Johansson, Mansfeld and Rimša2007, Reference Andersson, Begg, Griffin and Högdahl2011), Johansson et al. (Reference Johansson, Andersson and Hålenius2012) and Johansson & Hålenius (Reference Johansson and Hålenius2013).
The elevated Nb/Yb ratios also point to an enriched MORB-like source, with magma M1 being more enriched than magma M2 and M3 (Fig. 11a, b, c; after Pearce & Peate, Reference Pearce and Peate1995). An additional subduction-related slab component is not visible for Zr (Fig. 11a), but partly for TiO2 (Fig. 11b) and clearly for Th (Fig. 11c). Andersson (Reference Andersson1997b ), Andersson et al. (Reference Andersson, Eklund and Claeson2004 a, Reference Andersson, Eklund, Fröjdö and Konopelko2006 b, Reference Andersson, Rutanen, Johansson, Mansfeld and Rimša2007, Reference Andersson, Begg, Griffin and Högdahl2011), Rutanen & Andersson (Reference Rutanen and Anderson2009), Andersen et al. (Reference Andersen, Andersson, Graham, Åberg and Simonsen2009) and Rutanen et al. (Reference Rutanen, Andersson, Väisänen, Johansson, Fröjdö, Lahaye and Eklund2011) concluded that the Palaeoproterozoic sub-Svecofennian mantle in the central part of the Fennoscandian shield was heterogeneous and ‘mildly depleted’ (i.e. enriched after depletion). Since the Dannemora dykes probably formed some time after the intrusion of the Roslagen gabbro cumulates (Johansson et al. Reference Johansson, Andersson and Hålenius2012) and the Avesta–Östhammar gabbros and diorites (Johansson & Hålenius, Reference Johansson and Hålenius2013), heterogeneities within the sub-continental mantle would have had even more possibilities to develop. Scatter between the ACM and WPVZ in Figure 12d might also by explained by a heterogeneous source region.
Figure 8 shows a plot of initial ε Nd versus initial ε Sr at 1870 Ma together with data on other basic rocks in the same region from Johansson et al. (Reference Johansson, Andersson and Hålenius2012) and Johansson & Hålenius (Reference Johansson and Hålenius2013). The Dannemora dykes show similar isotopic character as the Roslagen gabbro cumulates and the Avesta–Östhammar gabbros and diorites with mildly depleted initial ε Nd and enriched initial ε Sr, and with sample 076 falling within the same range. However, compared to the Roslagen gabbro cumulates and Avesta–Östhammar mafic rocks, the Dannemora rocks spread in their initial ε Sr values to considerably higher values. This spread is not correlated with the degree of metasomatic alteration. Metasomatism mainly involved the addition of K and Rb (cf. Figs 5, 6) and would therefore result in an increase of the Rb/Sr ratio. If this occurred significantly after the time of crystallization it would result in shifts of the initial ε Sr to lower values, often below the mantle evolution curve. However, as the ε Sr values extend consistently to higher values this must reflect either true magmatic compositions or the addition of radiogenic Sr at some later time.
6 Summary and conclusions
1. The Dannemora mafic dykes probably belong to the same dyke swarm as the E–W-trending Herräng dykes and coeval dykes at Forsmark dated to between 1870 and 1860 Ma. They intruded the supracrustal sequence at Dannemora as well as surrounding synmagmatic granitoids (GDG suite), and were later deformed and metamorphosed to greenschist facies.
2. The analysed dyke samples have basaltic composition, with SiO2 between 46 and 51 wt%, MgO between 5 and 11 wt%, and Mg number between 47 and 71.
3. The dykes carry a mixed signature of subduction and within-plate volcanic zone magmatism and probably formed during an extensional phase of the Svecofennian orogeny, possibly related to initial back-arc spreading. The subduction signature may be inherited from mantle source rocks previously modified by subduction-related magmatism.
4. Their initial 87Sr/86Sr ratios and ε Sr values show substantial spread to high values, possibly affected by post-crystallization modifications of the Rb–Sr system. Their initial ε Nd values fall within a narrow range between +0.4 and +1.6, indicating a ‘mildly depleted’ mantle source with respect to Nd.
5. A combination of trace element and isotope geochemistry suggests that these dykes formed from a mixture of at least three different mantle-derived basaltic magma components, representing variably enriched sources with different degrees of enrichment in incompatible trace elements. The concentrations of incompatible trace elements in the dykes were mainly controlled by mixing between these components with limited influence from fractionation, whereas the MgO, Cr, Ni and Co concentrations were strongly controlled by fractionation of basaltic magma.
6. The three inferred magma components are broadly similar in composition to the inferred start magmas for the Roslagen gabbro cumulates and the Avesta–Östhammar belt gabbros and diorites, and to the trace and rare earth element pattern of volcanic arc basalts in general.
Acknowledgements
Thanks to Karin Wallner who helped with the isotope laboratory work and to Hans Schöberg who processed the isotope data. Abigail Barker and Karin Högdahl of Uppsala University are thanked for valuable discussions and input. Dannemora Mineral AB and the Geological Survey of Sweden (SGU) are acknowledged for economic support to this project. Reviews by Tom Andersen, Oslo and one anonymous reviewer substantially improved the paper.