Introduction
Short-range order–disorder (SR-OD) is extremely common in amphiboles and describes the probability that local atomic arrangements occur more or less frequently than would be predicted by a random distribution of ions in the structure (Hawthorne and Della Ventura, Reference Hawthorne, Della Ventura, Hawthorne, Oberti, Ventura and Mottana2007; Hawthorne et al., Reference Hawthorne, Della Ventura, Oberti, Robert and Iezzi2005). However, SR-OD does not obey translational symmetry and spectroscopic methods are generally required to derive such information. The intensity and position of bands in infrared spectra are dependent upon the OH-stretching frequency, which is sensitive to the local arrangement of all cations in the structure (Hawthorne and Della Ventura, Reference Hawthorne, Della Ventura, Hawthorne, Oberti, Ventura and Mottana2007). Consequently, the interpretation of such spectra may reveal the preference of cations to form specific local arrangements within the C2/m amphibole structure (e.g. Hawthorne et al., Reference Hawthorne, Della Ventura and Robert1996a; Della Ventura et al., Reference Della Ventura, Bellatreccia, Cámara and Oberti2014; Leissner et al., Reference Leissner, Schlüter, Horn and Mihailova2015). The local version of bond-valence theory (Hawthorne, Reference Hawthorne1997) may also be used to constrain local arrangements of ions, and a combination of crystal-structure refinement, infrared or magic-angle spinning nuclear magnetic resonance (MAS NMR) spectroscopy, and local bond-valence calculations can derive information on SR-OD in amphiboles provided that the composition of the amphibole is not overly complicated. The chemical variability of natural amphiboles gives rise to many overlapping absorption bands in the principal OH-stretching region of the infrared spectrum, and the spectra commonly do not contain enough information to allow the spectra to be fit correctly. This problem may be overcome by using (1) synthetic amphiboles (Raudsepp et al., Reference Raudsepp, Turnock and Hawthorne1987a,Reference Raudsepp, Turnock, Hawthorne, Sherriff and Hartmanb, Reference Raudsepp, Turnock and Hawthorne1991; Boschmann et al., Reference Boschmann, Burns, Hawthorne, Raudsepp and Turnock1994; Della Ventura et al., Reference Della Ventura, Robert, Hawthorne, Dyar, McCammon and Schaefer1996a,Reference Della Ventura, Robert, Hawthorne and Prostb, Reference Della Ventura, Robert, Raudsepp, Hawthorne and Welch1997, Reference Della Ventura, Robert and Hawthorne1998a,Reference Della Ventura, Robert, Hawthorne, Raudsepp and Welchb, Reference Della Ventura, Hawthorne, Robert, Delbove, Welch and Raudsepp1999, Reference Della Ventura, Robert, Sergent, Hawthorne and Delbove2001, Reference Della Ventura, Hawthorne, Robert and Iezzi2003; Hawthorne et al., Reference Hawthorne, Della Ventura, Robert, Welch, Raudsepp and Jenkins1997, Reference Hawthorne, Welch, Della Ventura, Liu, Robert and Jenkins2000; Robert et al., Reference Robert, Della Ventura and Hawthorne1999, Reference Robert, Della Ventura, Welch and Hawthorne2000; Najorka and Gottschalk, Reference Najorka and Gottschalk2003), the compositions of which are usually sufficiently constrained that a combination of Rietveld refinement or single-crystal refinement, infrared and MAS NMR spectroscopy, and local bond-valence arguments are sufficient to derive short-range order arrangements, or by using (2) gem amphiboles (Tait et al., Reference Tait, Hawthorne and Della Ventura2001; Abdu and Hawthorne, Reference Abdu and Hawthorne2009; Heavysege et al., Reference Heavysege, Abdu and Hawthorne2015) for which the compositions are commonly simple. Thus the majority of work on SR-OD in amphiboles involves interpretation of the spectra of synthetic and gem-quality samples where the composition either can be controlled or is simple enough to result in spectra that can be interpreted rigorously. In this study, we examine a series of gem-quality pargasites and fluoro-pargasites (Hawthorne et al., Reference Hawthorne, Oberti, Harlow, Maresch, Martin, Schumacher and Welch2012) by single-crystal structure refinement, infrared spectroscopy and electron-microprobe analysis in order to characterise their local arrangements.
Experimental
Samples AM1, AM7 and AM8 are from the mineral collection of the U.S. National Museum of Natural History and have the catalogue numbers USNM 109256, USNM 108917 and USNM 108413, respectively. Samples AM2, AM3 and AM6 were supplied by Dudley Blowett of Mountain Minerals, Colorado. Single-crystal structure refinement (SREF), electron microprobe analysis (EMPA) and Fourier-transform infrared spectroscopy (FTIR) were done at the Department of Geological Sciences, University of Manitoba. Each sample was chosen for crystal clarity and uniform extinction under cross-polarised light. In preparation for SREF, crystals were cut to an approximate size-range 15–60 x 40–80 x 100–140 (μm) and attached to tapered glass fibres; similar samples were double-polished for FTIR analysis. In preparation for EMPA, the samples were mounted in epoxy in an acrylic ring, ground, polished and carbon coated.
Single-crystal X-ray diffraction (SREF)
Crystals were mounted on a Bruker D8 three-circle diffractometer equipped with a rotating-anode generator producing monochromatic MoKα X-radiation, multilayer optics and an APEX-II CCD detector. Totals of ~16,300 intensities were collected to 60°2θ using 2–4 s per 0.2° frame with a crystal-to-detector distance of 5 cm. Empirical absorption corrections (SADABS, Sheldrick, Reference Sheldrick2008) were applied. Equivalent reflections were merged, resulting in ~5,320 reflections in the Ewald sphere. Intensities were averaged in the space group C2/m, resulting in ~1,370 unique reflections, and the intensities were reduced to structure factors. Unit-cell dimensions were obtained by least-squares refinement of the positions of ~4,000 reflections with I > 10σI and are given in Table 1. Each structure was refined in the space group C2/m with the SHELXTL version 6.14 program (Bruker AXS) to average R 1 indices of ~1.23% with anisotropic-displacement parameters at all sites. Atom positions and U eq values are given in Table 2 and anisotropic-displacement parameters (Table S1) and crystallographic information files have been deposited with the Principal Editor of Mineralogical Magazine and are available as Supplementary material (see below). Selected interatomic distances are given in Table 3.
Table 1. Structure-refinement information for gem amphiboles from Mogok, Myanmar.
Table 2. Atom coordinates and equivalent-displacement parameters (Å2) for gem amphiboles from Mogok, Myanmar.
Table 3. Interatomic distances (Å) for gem amphiboles from Mogok, Myanmar.
Symmetry codes: a: x, y, z + 1; b: x, y, z – 1; c: –x + ½, –y + ½, –z + 1; d: –x, y, –z + 1; e: –x, –y, –z + 1; f: –x, y, –z; g: –x, –y, –z; h: –x + 1, –y, –z; i: –x + 1, –y, –z + 1.
Electron microprobe analysis (EMPA)
Chemical analysis was done using a Cameca SX-100 electron microprobe operating in wavelength-dispersive mode using a voltage of 15 kV, a beam current of 20 nA, and a beam size of 1 μm. The following standards were used for Kα lines: albite (Na); diopside (Si and Ca); fluoro-riebeckite (F); forsterite (Mg); andalusite (Al); orthoclase (K); titanite (Ti); fayalite (Fe); spessartine (Mn); tugtupite (Cl); VP2O7 (V); chromite (Cr); and gahnite (Zn). Ten analytical points were measured on each sample. Data were corrected using the PAP procedure of Pouchou and Pichoir (Reference Pouchou, Pichoir and Armstrong1985), and the mean compositions are given in Table 4, together with the unit formulae calculated on the basis of (O,OH,F,Cl) = 24 atoms per formula unit (apfu) with (OH,F,Cl) = 2 apfu.
Table 4. Chemical composition (wt.%) and unit formula (apfu) for gem amphiboles from Mogok, Myanmar.
Infrared spectroscopy
Fourier-transform infrared (FTIR) spectra in the principal OH-stretching region were collected for all gem amphibole samples using a Bruker Tensor 27 FTIR spectrometer equipped with a KBr beam splitter and a DLATGS detector. It should be noted that the spectra of AM6 and AM7 contain relatively more noise due to lack of material.
Spectra over the range 4000–400 cm–1 were collected by averaging 100 scans at an operating resolution of 4 cm–1. Base-line corrections were done using the OPUS software (Bruker AXS) and spectra analysis in the 3800–3600 cm–1 range was done using the OMNIC software (Thermo Scientific™). Spectra were fit using Gaussian curves of similar width (full-width-at-half-maximum) with the program FITYK V0.9.8 (Wojdyr, Reference Wojdyr2010).
The C2/m amphibole structure
The general formula for the amphiboles can be written as A0–1B2C5T8O22W2, where A = Na, K, Ca, Li; B = Na, Li, Ca, Mn2+, Fe2+, Mg, Sr; C = Mg, Fe2+, Mn2+, Al, Fe3+, Mn3+, Ti4+, Li; T = Si, Al, Ti4+; W = (OH), F, Cl, O2–. The C2/m amphibole structure is shown in Fig. 1 and the correspondence between the general formula and the sites may be written as follows: A[A(2), A(m)] BM(4)2C[M(1)2M(2)2M(3)]T[T(1)4T(2)4]O22WO(3)2. A detailed summary of previous work on the structure and crystal chemistry of amphiboles was given by Hawthorne (Reference Hawthorne, Veblen and Ribbe1981, Reference Hawthorne1983a), Hawthorne and Oberti (Reference Hawthorne, Oberti, Hawthorne, Oberti, Ventura and Mottana2007) and Oberti et al. (Reference Oberti, Hawthorne, Cannillo, Cámara, Hawthorne, Oberti, Ventura and Mottana2007).
Fig. 1. The monoclinic C2/m amphibole structure viewed along 001.
Long-range site-populations
The T sites
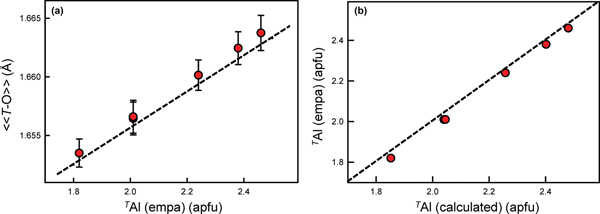
These amphiboles contain 1.79–2.41 apfu Al at the T sites (Table 4). The scattering values of Si and Al are similar, which precludes accurate derivation of site populations by site-scattering refinement (Hawthorne, Reference Hawthorne1983c; Hawthorne et al., Reference Hawthorne, Ungaretti and Oberti1995). However, the difference in ionic radii of TSi (0.26 Å) and TAl (0.39 Å) (Shannon, Reference Shannon1976) allows derivation of site populations from <T–O> distances (e.g. Papike et al., Reference Papike, Ross and Clark1969, Hawthorne and Grundy, Reference Hawthorne and Grundy1973a,Reference Hawthorne and Grundyb, Reference Hawthorne and Grundy1977; Robinson et al., Reference Robinson, Gibbs, Ribbe and Hall1973; Bocchio et al., Reference Bocchio, Ungaretti and Rossi1978; Hawthorne, Reference Hawthorne, Veblen and Ribbe1981, Reference Hawthorne1983a,Reference Hawthorneb; Oberti et al., Reference Oberti, Ungaretti, Cannillo, Hawthorne and Memmi1995a). The preference of TAl for T(1) was confirmed by neutron diffraction (Welch and Knight, Reference Welch and Knight1999) and by spectroscopic methods (Welch et al., Reference Welch, Kolodziejski and Klinowski1994, Reference Welch, Liu and Klinowski1998; Jenkins et al., Reference Jenkins, Sherriff, Cramer and Xu1997; Najorka and Gottschalk, Reference Najorka and Gottschalk2003; Della Ventura et al., Reference Della Ventura, Oberti, Hawthorne and Bellatreccia2007). Hawthorne and Oberti (Reference Hawthorne, Oberti, Hawthorne, Oberti, Ventura and Mottana2007) showed that grand <T–O> distances are also influenced by inductive effects where TAl <0.50 apfu, but vary linearly with TAl content where TAl > 0.50 apfu. As shown in Fig. 2a, these gem amphiboles accord very closely with this relation with deviations of <0.001 Å. Hawthorne and Oberti (Reference Hawthorne, Oberti, Hawthorne, Oberti, Ventura and Mottana2007) also gave predictive relations for the Al site populations of the T(1) and T(2) sites based on the observed <T(1)–O> and <T(2)–O> distances which were used here to derive site populations for the T(1) and T(2) sites. The resulting site-populations are in accord with the TAl contents derived by electron-microprobe analysis (Fig. 2b).
Fig. 2. (a) Grand <T–O> (Å) plotted against TAl (apfu) with associated error; and (b) calculated TAl (apfu) plotted against observed (EMPA) TAl (apfu) for each sample (shown as red dots). The dashed black line in (a) represents the equation given by Hawthorne and Oberti (Reference Hawthorne, Oberti, Hawthorne, Oberti, Ventura and Mottana2007), and in (b) the 1:1 relation between the variables.
The M(1,2,3) sites
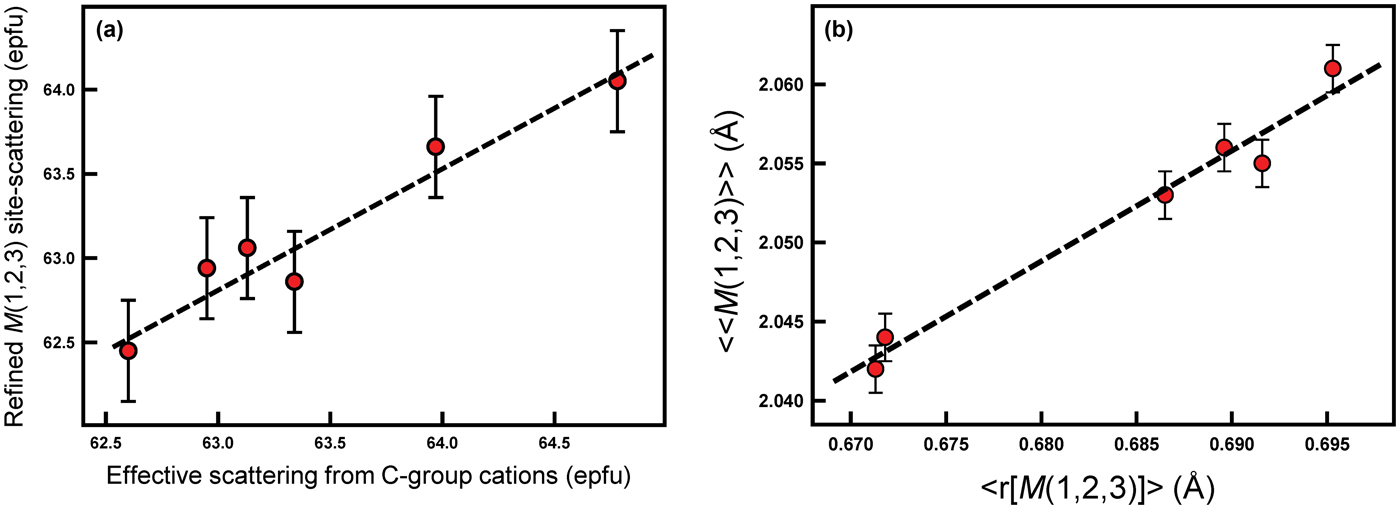
The total refined scattering at the M(1,2,3) sites (62.95–63.97 electrons per formula unit [epfu]) (Table 5) shows an extremely small range which is consistent with the C-group cations indicated by the unit formulae of Table 4 (Fig. 3a). Similarly, the variation in grand <M(1,2,3)–O> distances shows a linear correlation with the mean radius (r) of the C-group cations from the unit formula in Table 4 (Fig. 3b). The compositions of the C group are dominated by Mg (3.59–4.14 apfu) and Al (0.56–1.28 apfu), and the similarity of the scattering factors of Mg and Al ensure the very narrow range of refined site-scattering from the M(1,2,3) sites. The net refined site-scattering values at M(1,2,3) deviate from the effective scattering from the C-group cations of the unit formulae (Table 4) by an average of 0.31 epfu. To facilitate assignment of site populations from the refined site-scattering values, the latter were adjusted (generally within one standard deviation, Table 5) to conform to the effective scattering from the C-group cations of the unit formulae indicated by the chemical formulae.
Fig. 3. (a) Effective scattering from C-group cations (epfu) plotted against refined M(1), M(2) and M(3) site-scattering (epfu); (b) mean radius of the M(1,2,3) sites (Å) (<r[M(1,2,3)]>) plotted against the grand mean M(1,2,3)–O bond lengths (Å) (<<M(1,2,3)–O>>) for each sample (shown as red dots). Dashed black lines represent a linear relation between both variables in (a) and (b).
Table 5. Refined and calculated site-scattering (ss) values (epfu) and assigned site-populations (apfu) for gem amphiboles from Mogok, Myanmar.
bl – bond length
In most amphiboles, [6]Al is ordered at M(2) (e.g. Hawthorne, Reference Hawthorne, Veblen and Ribbe1981, Reference Hawthorne1983a; Oberti et al., Reference Oberti, Hawthorne, Cannillo, Cámara, Hawthorne, Oberti, Ventura and Mottana2007). However, Semet (Reference Semet1973) showed by infrared spectroscopy that [6]M3+ cations disorder over the M(2) and M(1) and/or M(3) sites in Mg-rich synthetic amphiboles, and Raudsepp et al. (Reference Raudsepp, Turnock and Hawthorne1987a,Reference Raudsepp, Turnock, Hawthorne, Sherriff and Hartmanb, Reference Raudsepp, Turnock and Hawthorne1991) showed by infrared spectroscopy and Rietveld refinement that this disorder occurs over the M(2) and M(3) sites. Oberti et al. (Reference Oberti, Hawthorne, Ungaretti and Cannillo1995b) showed the same disorder of [6]Al over the M(2) and M(3) sites in Mg-rich pargasites from peridotites, and this disorder of [6]Al over the M(2) and M(3) has since been shown to be the case for Mg-rich synthetic (e.g. Welch and Knight, Reference Welch and Knight1999) and natural amphiboles (e.g. Tait et al., Reference Tait, Hawthorne and Della Ventura2001; Heavysege et al., Reference Heavysege, Abdu and Hawthorne2015). The absence of Al at the M(1) site allows us to calculate the M(1) site-populations directly from the refined site-scattering values (Table 5) using the scattering curves for Mg and the dominant transition metal in the unit formulae. The resultant site-populations are also given in Table 5.
Preliminary site-populations for the M(2) and M(3) sites were calculated from the refined site-scattering values (Table 5) in terms of Mg* (= Mg + Al) and the dominant transition metal. The results indicate that all V3+, Cr3+ and Ti4+ occurs at the M(2) site and the <M(2)–O> bond lengths are in accord with this assignment. The X-ray scattering factors of Mg (Z = 12) and Al (Z = 13) are very close, and mean bond lengths must be used to assign [6]Al and [6]Mg as the sizes of [6]Mg (r = 0.72 Å) and [6]Al (r = 0.535 Å) are significantly different (Shannon, Reference Shannon1976). There are equations relating <M(2)–O> and <M(3)–O> distances to constituent cation and anion radii and to other stereochemical aspects of the adjacent sites (Hawthorne and Oberti, Reference Hawthorne, Oberti, Hawthorne, Oberti, Ventura and Mottana2007). Using these equations, [6]Al and [6]Mg were assigned to M(2) and M(3) such that there is an equally good fit between the observed and calculated <M(2)–O> and <M(3)–O> values; the deviations are within the error of estimate for each site given by Hawthorne and Oberti (Reference Hawthorne, Oberti, Hawthorne, Oberti, Ventura and Mottana2007). The resultant site-populations are given in Table 5.
The M(4) site
The unit formulae (Table 4) indicate that the M(4) site is occupied dominantly by Ca with minor Na, and the refined site-scattering values are in accord with this occupancy (Table 5). Thus the site populations were assigned directly from the formulae of Table 4.
The A site
In accord with previous work on local order–disorder in the A cavity of monoclinic amphiboles (e.g. Hawthorne and Grundy, Reference Hawthorne and Grundy1972, Reference Hawthorne and Grundy1973a,Reference Hawthorne and Grundyb; Hawthorne et al., Reference Hawthorne, Oberti and Sardone1996b), Na was assigned to the A(2) site and (Na + K) was assigned to the A(m) site in agreement with the refined site-scattering values at these sites (Table 5) and the formulae derived from electron-microprobe analysis (Table 4).
Short-range order in the C2/m amphibole structure
The infrared spectra of amphiboles are strongly affected by short-range order (SRO): the occurrence of local clusters of ions that may (or may not) give rise to discrete bands in the principal OH-stretching region of the infrared (Strens, Reference Strens1966). Hawthorne et al. (Reference Hawthorne, Della Ventura and Robert1996a) showed that SRO is common in amphiboles, and that bands in the infrared can be assigned to specific local clusters of ions that centre on the O(3) site (Hawthorne and Grundy, Reference Hawthorne and Grundy1976). Extensive work since then (Hawthorne et al., Reference Hawthorne, Della Ventura, Robert, Welch, Raudsepp and Jenkins1997, Reference Hawthorne, Welch, Della Ventura, Liu, Robert and Jenkins2000; Della Ventura et al., Reference Della Ventura, Hawthorne, Robert, Delbove, Welch and Raudsepp1999, Reference Della Ventura, Robert, Sergent, Hawthorne and Delbove2001, Reference Della Ventura, Hawthorne, Robert and Iezzi2003; Robert et al., Reference Robert, Della Ventura and Hawthorne1999, Reference Robert, Della Ventura, Welch and Hawthorne2000; Hawthorne and Della Ventura, Reference Hawthorne, Della Ventura, Hawthorne, Oberti, Ventura and Mottana2007; Leissner et al., Reference Leissner, Schlüter, Horn and Mihailova2015) has shown that both nearest-neighbour (NN) and next-nearest-neighbour (NNN) cations affect the principal OH-stretching frequency of the locally associated (OH) group, and both infrared and Raman spectroscopy of the principal OH-stretching region may be used as a sensitive probe of NN and NNN short-range arrangements in amphiboles.
The arrangement of atoms around the O(3) site in the C2/m amphibole structure is shown in Fig. 4. The O(3) site is situated at the centre of the strip of octahedra and is bonded to two M(1) and one M(3) cations. Hawthorne and Grundy (Reference Hawthorne and Grundy1976) found that where O(3) = (OH), the H atom is ~ 1 Å (0.957(6) Å) away from the O(3) site and that the H atom forms a hydrogen bond with one of the O(7) oxygen atoms, shown by the dashed black line in Fig. 4. The strength of the O(3)–H bond controls the frequency of the principal OH-stretching vibration which is in turn related to the strength of the H···O(7) hydrogen bond (Hawthorne et al., Reference Hawthorne, Della Ventura, Oberti, Robert and Iezzi2005). It follows that any variation in the occupancy of the sites locally associated with the O(3) and O(7) sites gives rise to fine structure in the principal OH-stretching region of the infrared. Such locally associated sites include the NN M(1)M(1)M(3), T(1)T(1) and A(2/m) sites. The M(1)M(1)M(3) sites are locally associated with the O(3)(OH) group which also interacts with the cation occupying the A site. Satisfaction of the bond-valence requirements at the O(7) site also influences the strength of the locally associated hydrogen bond and is controlled by the occupancy of the locally associated T(1) sites.
Fig. 4. (a) The local structure surrounding the O(3) site (red circle); (b) connectivity around the O(3) site in C2/m amphiboles projected onto (010). The dashed black line represents the H···O(7) bond in (a) and (b). T(2) sites have been omitted in (b) for simplicity. Modified from Della Ventura et al. (Reference Della Ventura, Hawthorne, Robert, Delbove, Welch and Raudsepp1999).
The configuration symbol and possible arrangements
Hawthorne et al. (Reference Hawthorne, Della Ventura, Oberti, Robert and Iezzi2005) introduced the idea of a ‘configuration symbol’ which denotes the NN and NNN cation sites associated with the O(3) site: M(1)M(1)M(3)–O(3)–A:T(1)T(1)–M(2)M(2)M(3)–M(2)M(2). Della Ventura et al. (Reference Della Ventura, Hawthorne, Robert, Delbove, Welch and Raudsepp1999) showed that the major bands in the spectrum of pargasite are slightly split by different occupancy of NNN sites. However, this splitting is small, and Robert et al. (Reference Robert, Della Ventura, Welch and Hawthorne2000) ignored this splitting in fitting of the spectra of pargasite–fluoro-pargasite solid solutions. We use the same approach here, and consider only NN and NNN effects involving the configuration symbol M(1)M(1)M(3)–O(3)–A:T(1)T(1). However, we need to incorporate the NNN effect of F across the occupied A site into the configuration symbol (see below for a discussion of this effect). We shall do so in the following way: M(1)M(1)M(3)–O(3)–A–O(3):T(1)T(1) where the following arrangements about the A site are possible: M(1)M(1)M(3)–OH–A–OH:T(1)T(1); M(1)M(1)M(3)–OH–A–F:T(1)T(1); and M(1)M(1)M(3)–F–A–F:T(1)T(1); the last arrangement has no expression in the infrared.
Constraints of composition
(1) Inspection of Table 4 shows that the A-group cations completely occupy the A site, and hence local arrangements will involve only A = Na* (Na* = Na + K).
(2) For Mg-rich compositions, it has been shown both crystallographically (e.g. Raudsepp et al., Reference Raudsepp, Turnock and Hawthorne1987a,Reference Raudsepp, Turnock, Hawthorne, Sherriff and Hartmanb; Oberti et al., Reference Oberti, Hawthorne, Ungaretti and Cannillo1995b; Welch and Knight, Reference Welch and Knight1999) and spectroscopically (e.g. Semet, Reference Semet1973; Raudsepp et al., Reference Raudsepp, Turnock, Hawthorne, Sherriff and Hartman1987b; Welch et al., Reference Welch, Kolodziejski and Klinowski1994, Reference Welch, Liu and Klinowski1998; Della Ventura et al., Reference Della Ventura, Robert, Hawthorne, Raudsepp and Welch1998b) that the trivalent C-group cations are partly disordered over the M(2) and M(3) sites, and Oberti et al. (Reference Oberti, Hawthorne, Ungaretti and Cannillo1995b) showed how the <M(2)–O> and <M(3)–O> distances can be used to derive the site populations associated with this disorder. Using the site populations of the M(3) site (Table 5), we may calculate the relative amounts of local arrangements at M(1)M(1)M(3) in the following manner: MgMgMg:MgMgAl = M(3)Mg*:M(3)Al (Mg* = Mg + Fe2+).
(3) Arrangements involving T(1)–O(7)–T(1) are affected by the amount of TAl in the structure. Hawthorne and Oberti (Reference Hawthorne, Oberti, Hawthorne, Oberti, Ventura and Mottana2007) state that T(1)Al–O(7)–T(1)Al arrangements do not occur unless O(7) is locally associated with Ca at the A site, as in fluoro-cannilloite (Hawthorne et al., Reference Hawthorne, Oberti and Sardone1996b). This is not the case for any of the amphiboles examined here (Table 4), T(1)Al–O(7)–T(1)Al arrangements cannot occur, and the site populations of Table 5 may be used to calculate the frequencies of occurrence of arrangements involving the T(1)T(1) sites: T(1)Al–O(7)–T(1)Si =T(1)Al/2 and T(1)Si–O(7)–T(1)Si = 1 – T(1)Al/2.
(4) There is only minor occupancy of the C-group by divalent cations other than Mg (Fe2+), and arrangements involving Fe2+ may be ignored (except perhaps for crystal AM1).
(5) Heavysege et al. (Reference Heavysege, Abdu and Hawthorne2015) proposed that arrangements involving M(1)M(1)M(3) = MgMgAl should be locally associated with the arrangement T(1)T(1) = SiAl, as the bridging O(7) requires more bond valence from the hydrogen bond when linked to SiAl than when linked to SiSi. This local arrangement is possible as T(1)Al > M(3)Al in all amphiboles of Table 5.
The nearest-neighbour effect of F
There are three possible local arrangements involving M(3) and OH,F: [1] OH–M(3)–OH; [2] OH–M(3)–F; and [3] F–M(3)–F; these arrangements gives rise to two, one and zero absorption events in the infrared, respectively. Thus the proportion of absorption events to null-absorption events is equal to the (OH):F ratio.
There is no disorder of trivalent cations over M(2) and M(3) in amphiboles where O(3) is occupied by F (Raudsepp et al., Reference Raudsepp, Turnock, Hawthorne, Sherriff and Hartman1987b; Oberti et al., Reference Oberti, Sardone, Hawthorne, Raudsepp and Turnock1995c, Reference Oberti, Hawthorne, Cámara and Raudsepp1998). This means that in amphiboles where both (OH) and F are present in major amounts, F will be strongly to completely associated with the local arrangement M(1)M(1)M(3) = MgMgMg and not with the local arrangement MgMgAl. Above (point (2)), we showed that the T(1)T(1) arrangements occur in the ratio T(1)Al/2:1 – T(1)Al/2. Inspection of Table 5 shows that T(1)Al/2 > M(3)Al for all crystals examined here, in accord with this short-range constraint. In addition, the number of arrangements, T(1)T(1) = SiSi = 1 – T(1)Al/2, is always less than the amount of F in the amphibole, and hence all local arrangements MgMgMg–X–Na:SiSi will have X = F and have no expression in the infrared. The local arrangement MgMgMg–OH–Na:SiSi gives rise to a band at 3730–3740 cm–1 (Della Ventura et al., Reference Della Ventura, Hawthorne, Robert, Delbove, Welch and Raudsepp1999; Hawthorne, Reference Hawthorne2016). In accord with the above discussion, this band is not observed in the spectra of the amphiboles examined here (Fig. 5). A similar absence of this 3730–3740 cm–1 band occurs in the spectra of fluoro-edenite and fluoro-pargasite (Della Ventura et al., Reference Della Ventura, Bellatreccia, Cámara and Oberti2014). In the Mogok amphiboles, the local arrangement MgMgMg–OH–Na:SiAl gives rise to a band at 3720–3710 cm–1 (~3711 cm–1) as T(1)Si substituted for by T(1)Al results in a relative band displacement of –20 cm–1 (Della Ventura et al., Reference Della Ventura, Hawthorne, Robert, Delbove, Welch and Raudsepp1999; Hawthorne, Reference Hawthorne2016). The occurrence of such a band is in accord with the site populations of these amphiboles, and this is typically the highest-frequency band observed (Fig. 5, band A).
Fig. 5. Comparison of the fitted spectra of each sample in the principal OH-stretching region. Vertical lines represent the peak positions of bands A, B, C and D. Black curves represent the observed spectra and red curves represent the sum of the fitted bands. Note the slight deviations in band centres corresponding to the same local arrangements in each sample.
The next-nearest-neighbour effect of F
Infrared spectroscopy of amphiboles in the tremolite–fluorotremolite series show a single OH-stretching band at 3674 cm–1 (Jenkins, Reference Jenkins1987; Gottschalk et al., Reference Gottschalk, Andrut and Melzer1999; Robert et al., Reference Robert, Della Ventura and Hawthorne1999), and the position of this band does not change with varying F content (apfu). This ‘one-mode behaviour’ (Chang and Mitra, Reference Chang and Mitra1968) is due to a lack of coupling between O(3) sites adjacent across the A cavity, in accord with the fact that the A site in tremolite is vacant and cannot couple O(3) arrangements across the A-site cavity (Hawthorne et al., Reference Hawthorne, Della Ventura, Oberti, Robert and Iezzi2005).
Amphibole with an occupied A site shows two-mode behaviour (Chang and Mitra, Reference Chang and Mitra1968) with regard to the variation in (OH) and F in the structure (Robert et al., Reference Robert, Della Ventura and Hawthorne1999, Reference Robert, Della Ventura, Welch and Hawthorne2000). Work on the richterite–fluoro-richterite series shows three distinct bands in the infrared, one at 3730 cm–1 due to the arrangement MgMgMg–OH–Na–OH:SiSi, one at 3674 cm–1 due to the arrangement MgMgMg–OH–□–OH:SiSi, and one at 3711 cm–1 due to the arrangement MgMgMg–OH–Na–F:SiSi (Della Ventura et al., Reference Della Ventura, Robert and Hawthorne1998a, Reference Della Ventura, Hawthorne, Robert, Delbove, Welch and Raudsepp1999; Hawthorne et al., Reference Hawthorne, Della Ventura, Oberti, Robert and Iezzi2005). This ‘two-mode behaviour’ (Chang and Mitra, Reference Chang and Mitra1968) suggests that the local OH-group arrangement is affected by the adjacent arrangement involving F; the occurrence of an additional band in the richterite spectrum (A = Na) compared to the tremolite spectrum (A = □) indicates that coupling of O(3) arrangements adjacent across the A cavity occurs only in the presence of an occupied A site. It should also be noted that the intensity of the band at 3674 cm–1 decreases with increasing F, further evidence of (OH)–F coupling across the occupied A site. Hawthorne et al. (Reference Hawthorne, Della Ventura, Oberti, Robert and Iezzi2005) suggested that this coupling is due to differential repulsion between H and the A-site cation, which forces the A cation to occupy a more central position. Where the adjacent O(3) site is occupied by F, no such repulsion occurs and thus the A-group cation moves further away from the OH-group. As a result, the vibrational frequency between the H and A-group cation is reduced, and the OH–ANa–F arrangement will absorb at a relatively lower wavenumber.
The frequency of local arrangements OH–ANa–OH, OH–ANa–F and F–ANa–F may be calculated from the F content of the crystal (Heavysege et al., Reference Heavysege, Abdu and Hawthorne2015) where x = F/(F + OH):
The arrangement F–ANa–F is not visible in the infrared, and the relative intensities for any arrangement involving A = Na (or K) and its F-shifted equivalent may be calculated from the relevant expressions above and the F content of the crystal. Moreover, the relative displacement of the F-shifted equivalent band is ~19 cm–1 (Robert et al., Reference Robert, Della Ventura and Hawthorne1999, Reference Robert, Della Ventura, Welch and Hawthorne2000). Accordingly, the F-shifted MgMgMg–OH–Na:SiAl arrangement should give rise to a band at 3700–3690 cm–1, which is indeed the case (Fig. 5, band B).
Above in point (2), we saw that the NN configuration has two principal arrangements, MgMgMg and MgMgAl. Hence the arrangements derived above, MgMgMg–OH–Na-OH:SiAl and (F-shifted) MgMgMg–OH–Na-F:SiAl, should have M(1)M(1)M(3) = MgMgAl equivalents: MgMgAl–OH–Na-OH:SiAl and (F-shifted) MgMgAl–OH–Na-F:SiAl. Thus we expect to see four bands in the infrared spectra of these amphiboles. These MgMgAl–OH–Na-OH:SiAl and MgMgAl–OH–Na-F:SiAl arrangements should give rise to bands at 3687–3677 cm–1 and 3667–3657 cm–1, respectively, as M(1,3)Mg substituted by M(1,3)Al3+ results in a relative band displacement of –33 cm–1 (Della Ventura et al., Reference Della Ventura, Hawthorne, Robert, Delbove, Welch and Raudsepp1999). Calculating the frequencies of occurrence of these last two arrangements via the relation MgMgMg:MgMgAl = M(3)Mg*:M(3)Al (Mg* = Mg + Fe2+) indicates that they are significantly less common than their MgMgMg analogues. However, their absorption is shifted to a lower frequency, and as shown by Skogby and Rossman (Reference Skogby and Rossman1991), the transition probability of absorption increases strongly with decreasing absorption frequency, and hence the ratios of local arrangements do not one-to-one correspond with the absorption intensities of the corresponding bands in the infrared.
Description and interpretation of spectra
The observed band intensities and the amounts of the local arrangements assigned to these bands in the spectra of each amphibole (Fig. 5) are given in Table 6. In general, the observed band intensities and the calculated amounts of the corresponding local arrangements are in reasonable accord. However, the disagreement between observed and calculated values tends to increase among arrangements corresponding to bands at lower frequencies. This is probably due to increased transition probabilities resulting in the lack of one-to-one correspondence between the relative amounts of local arrangements and the intensities of their associated absorption bands (Skogby and Rossman, Reference Skogby and Rossman1991; Della Ventura et al., Reference Della Ventura, Robert, Hawthorne, Dyar, McCammon and Schaefer1996a,Reference Della Ventura, Robert, Hawthorne and Prostb; Hawthorne et al., Reference Hawthorne, Della Ventura, Robert, Welch, Raudsepp and Jenkins1997). The results of this effect are apparent for AM2 and AM6. For these crystals, M(3)Al is low (0.01–0.05 apfu) (Table 5), and one expects the band intensity of any local arrangement involving M(3)Al (bands C and D) to be relatively low. However, this is not the case as the observed absorption intensities of the bands are significantly higher than predicted (Table 6). The NNN effects of band-splitting, which have been ignored here, could also cause slight discrepancies between band intensities and the calculated amounts of different local arrangements (Della Ventura et al., Reference Della Ventura, Hawthorne, Robert, Delbove, Welch and Raudsepp1999; Robert et al., Reference Robert, Della Ventura, Welch and Hawthorne2000).
Table 6. Band positions, band intensities and calculated amounts of the associated local arrangements for gem amphiboles from Mogok, Myanmar.
AM1–3 and 6–8 were each fit using four peaks, corresponding to the local arrangements: (1) MgMgMg–OH–Na–OH:SiAl; (2) MgMgMg–OH–Na–F:SiAl; (3) MgMgAl–OH–Na–OH:SiAl and (4) MgMgAl–OH–Na–F:SiAl (Table 6). Figure 5 shows that most of the observed bands corresponding to the same local arrangement are centred reasonably close to the same wavenumber (cm–1), as one would expect from the arguments proposed previously. However, not all bands corresponding to the same local arrangement are centred at exactly the same wavenumber (cm–1) in all samples. For example, Fig. 5 shows that band A is centred at ~3707 ± 4 cm–1 in all samples; however, it is tightly centred at ~3710 cm–1 in AM1, 3 and 8, and at ~3707 cm–1 in AM2 and 7. A similar correlation is observed for band B, which is tightly centred at ~3692 cm–1 in AM1, 3, 8 and 6 and at ~3684 cm–1 and ~3688 cm–1 in AM2 and 7, respectively (Table 6).
Most of the curves used to fit the observed spectra have band centres that fall well within the theoretical frequency ranges calculated previously. Nonetheless, certain chemical features may explain minor differences in band position. M(1,3)Fe2+ ranges from 0.02–0.12 apfu (Table 5) and results in a frequency shift of –15 to –18 cm–1 where substituting for M(1,3)Mg, only half the frequency shift produced by M(1,3)Mg ↔ M(1,3)Al (–33 cm–1) (Iezzi et al., Reference Iezzi, Della Ventura, Hawthorne, Pedrazzi and Robert2005; Della Ventura et al., Reference Della Ventura, Hawthorne, Robert, Delbove, Welch and Raudsepp1999). Even though the relatively low amount of Fe2+ may have discernible effects in the infrared, it is probably masked by the MgMgMg–OH–Na–F:SiAl arrangement (~3692 cm–1) as the arrangement MgMgMg–OH–Na–OH:SiAl may be shifted –15 to –18 cm–1 via the substitution M(1,3)Mg ↔ M(1,3)Fe2+, from 3711 cm–1 to 3693–3696 cm–1. The amount of AK in most samples is significant and ranges from 0.05–0.44 apfu (Table 5). Although all local arrangements are written with Na as the A-site constituents, K partly occupies the A site in all samples and may account for some minor differences in band position between samples as ANa ↔ AK results in a frequency shift of + 5 cm–1 (Robert et al., Reference Robert, Della Ventura and Thauvin1989).
Summary
In all samples, TAl occupies both T(1) and T(2) but is strongly ordered at T(1). M(1,2,3) are dominated by [6]Mg, [6]Al is partly disordered over M(2) and M(3) and is absent at M(1). [6]Fe2+ is disordered over M(1,2,3) and minor trivalent and tetravalent cations (Cr3+, V3+ and Ti4+) are weakly ordered at M(2). M(4) is completely occupied by Ca, except for AM1 which contains minor M(4)Na. A(2) is dominated by Na and A(m) is occupied by both Na and K (Table 5). The O(3)(OH):F ratio ranges from 1.42:0.58 (AM3) to 0.84:1.16 (AM6) (Table 4).
Band A at ~3707 cm–1 is the most intense (Fig. 5) and corresponds to the local arrangement MgMgMg–OH–Na–OH:SiAl. Band B at ~3692 cm–1 is typically the second most intense band and corresponds to the arrangement MgMgMg–OH–Na–F:SiAl, the F-shifted equivalent of band A. Bands C and D correspond to the arrangements MgMgAl–OH–Na–OH:SiAl and MgMgAl–OH–Na–F:SiAl, respectively. There is reasonable agreement between observed band intensities and calculated ratios of the corresponding arrangements (Table 6), supporting the assignment of these bands to these specific local arrangements.
Acknowledgements
This work was supported by a Discovery Grant from the Natural Sciences and Engineering Research Council of Canada to FCH, and by Innovation Grants from the Canada Foundation for Innovation to FCH. We would like to thank Dudley Blowett of Mountain Minerals, Colorado for supplying some sample material.
Supplementary material
To view supplementary material for this article, please visit https://doi.org/10.1180/mgm.2018.149