


Introduction
TomoTherapy (Accuray Inc, Sunnyvale, CA) is a unique Intensity-Modulated Radiation Therapy (IMRT) dedicated treatment modality in which 6 Mega-voltage (MV) photon treatment beam is delivered in a slice-by-slice manner, where the patient is simultaneously moved into the gantry bore at a predetermined constant speed while the gantry is rotating and delivering radiation dose modulated by binary Multi-Leaf Collimators (MLC) leaves at a fixed jaw size.Reference Mackie 1
Superficial target refers to the planning target volume (PTV) that is close to the body surface or extends up to the body surface. IMRT optimisation of superficial PTV becomes challenging due to the lack of build-up region for the 6 MV photon beam. Without any intervention during treatment planning, the inverse-planning TomoTherapy treatment planning system (TPS) will continuously boost the photon fluence at the surface of the superficial PTV in order to achieve the dose coverage. Virtual Bolus (VB) is a structure used only during treatment planning in TPS and it is not present in actual dose delivery. International Commission on Radiation Units and Measurements (ICRU) Report 62 suggested the use of artificial build-up material at the skin during optimisation but not in the actual treatment, known as the VB method.Reference Landberg, Chavaudra and Dobbs 2
There are only a few studies related to the use of VB for IMRT treatment planning optimisation for superficial PTV. Tyran et al. studied on the safety and benefit of using VB in breast IMRT planning; the study showed improved dose coverage and lower organ at risk (OAR) doses compared to the plans optimised without VB.Reference Tyran, Tallet and Resbeut 3 The use of VB in optimising total body irradiation (TBI) treatment plan allows larger margin for setup error with compromised yet acceptable reduction in dose coverage and increase in global dose. The use of VB will negate the photon fluence boosting phenomenon produced by the TPS at the superficial target regions, hence giving a more homogenous treatment plan. However, this will create uncertainties in the actual delivery because there is no presence of bolus during actual treatment.Reference Moliner, Izar, Ferrand, Bardies, Ken and Simon 4 There was a study which compared an alternative to the use of VB by reducing the PTV contour at a fixed distance from the body surface; it was shown to be not feasible as reducing PTV contour will cause reduction in actual dose coverage. The study showed VB is the superior solution.Reference Ashburner and Tudor 5 There is, however, limited data for the direct dosimetric effects of VB utilisation.
The primary aim of this research is to determine the optimal thickness and density of the VB used for the TomoTherapy optimisation of superficial PTV. This study characterises the VB in terms of its assigned thickness and density by comparing the optimisation results with the actual delivery measurements. The dose profiles of the actual delivery plans were measured using radiochromic films in a cylindrical phantom. The parameters of planning dose-volume histogram (DVH) were compared with the delivered DVH that were recalculated based on the acquired mega-voltage computed tomography (MVCT) scans. The MVCT was acquired prior to the treatment delivery for image guidance and dose recalculation.
Materials and Methods
A cylindrical phantom was simulated using Somatom Sensation Open (Siemens Medical Solutions, Erlangen, Germany) Computed Tomography (CT) scanner with departmental protocol of 120 kVp and 250 mAs. The CT images were imported in Oncentra MasterPlan® v4.5.3 (Nucletron BV, Veenendaal, Netherlands) software for contouring of the PTV and VB. The PTV was simply a dummy rectangular cuboid structure that extends up to the phantom surface. Two PTVs with exactly the same volume (70 cc) were delineated, with PTV A situated more superiorly than PTV B. Two VBs were contoured at the surface of PTV A and PTV B, respectively. The VBs were created in three thicknesses of 2, 4 and 6 mm. The VB for PTV A was assigned with 0·5 g/cc density, while the VB for PTV B was assigned with 1·0 g/cc density.
The contours delineated were exported to the TomoTherapy TPS v2.1.2 (Accuray Inc, Sunnyvale, CA) software. Four TomoTherapy plans were created, one being the control set and three other plans were optimised with the three respective VB thickness. All the experimental sets were prescribed to 15 Gy in ten fractions to the median of PTV A, and optimised using the same parameters of 2·5 cm jaw size, 0·43 pitch and 2·4 modulation factor.
Gafchromic EBT3 films (Ashland Specialty Ingredients, Bridgewater, NJ) were used in this study. The EBT3 were handled appropriately as described by Borca et al.Reference Langen, Meeks and Poole 6 One piece of EBT3 film was cut into 12 equal size films to construct a film calibration curve of 0–2·5 Gy. The films were irradiated with known radiation doses, and then scanned after 2 hours of post-irradiation using Vidar® Dosimetry Pro Advantage™ (VIDAR Systems Corporation, Herndon, VA, USA) red channel film scanner. The corresponding film pixel values and irradiated doses were computed into TomoTherapy Film Analyzer software to construct the film calibration file.
The phantom setup position was corrected to the best possible registration match using image guidance through TomoTherapy’s MVCT scan, known as the best setup in this study. The MVCT scan range included the whole phantom, so that it can be used for dose recalculation by the TomoTherapy Planned Adaptive v2.1.2 (Accuray Inc, Sunnyvale, CA) software. Langen et al. studied on the MVCT recalculations using TomoTherapy Planned Adaptive software and concluded that the dosimetric endpoints varied by less than 2% in general.Reference Langen, Meeks and Poole 6 A quarter of EBT3 film was used as depicted in Figures 1 and 2 to measure the dose profile for each experimental set.
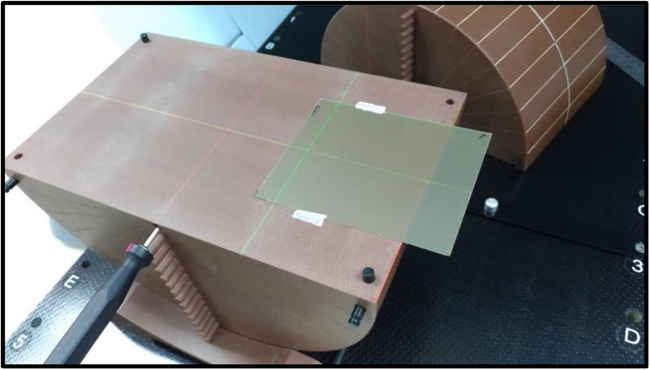
Figure 1. Position of the EBT3 Film.
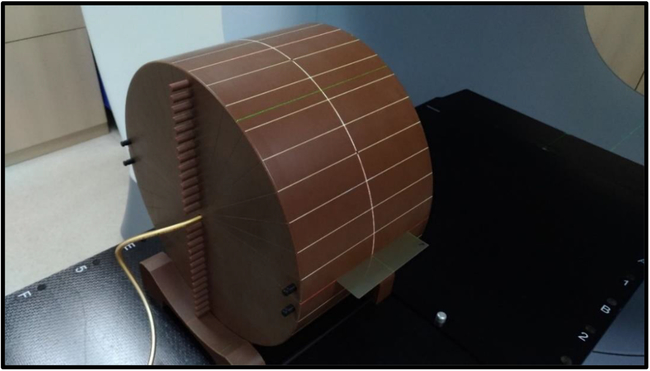
Figure 2. The actual setup of the experiment. Ready to perform pre-treatment MVCT verification and then irradiation.
Figure 3 shows one of the irradiated EBT3 films which covered both PTV A and PTV B, it was scanned after 2 hours of post-irradiation. The post-irradiation development of the EBT3 film was observed to be stable after 2 hours.Reference Borca, Pasquino and Russo 7 The scanned film is applied with the film calibration file to convert all the pixel values to absorbed doses. Five measurements of the central dose profiles were taken for PTV A and PTV B, respectively, for each plan. The standard error was calculated, and uncertainty of 1·96 times the standard error was used in this study indicating 95% confidence limit for the values reported in this study.Reference Swinscow and Campbell 8

Figure 3. EBT3 film scanned after 2 hours of post-irradiation, the red contour is PTV A while blue contour is PTV B.
After evaluating the results from the delivery at best setup, the plan optimised with 4 mm VB (Set 2) was observed to provide the best solution. Set 2 was then experimented again, by deliberately shifting laterally towards the high radiation fluence region with 1, 2 and 3 mm shifts. The shifts were accomplished through TomoTherapy’s MVCT image guidance by deliberately adding the specific shift distance to the image registration of the best setup.
Results
TPS plan optimisation
The dose coverage V95% and near minimum dose D98% were relatively similar for all the plans optimised with or without VB. However, without the use of VB (Control Set), the surface of the PTVs was covered with hot spots above 105%. The plan optimised with 2 mm VB was ineffective in reducing the hot spots. When 4 mm VB is used, the near maximum dose D2% was reduced to 103·00 and 102·57% for PTV A and PTV B, respectively. The density of the VB assigned to PTV A was 0·5 g/cc and PTV B was 1·0 g/cc. The plan optimised with 6 mm VB showed reduced hot spots too; the D2% was 102·49% for both PTV A and PTV B. The planning DVH data for all the plans are tabulated in Table 1.
Table 1. Planning DVH data from Tomotherapy TPS

Planned versus delivered dosimetry
The central dose profiles measured for all the experiment sets are plotted as shown in Figure 4. Figures 4a and 4b show that the planned and delivered dose profiles were relatively similar, which is expected since there was no VB used during optimisation for both the control sets. Figure 4c shows relative similar profiles too, where there was over-fluence photon peak observed. Figure 4d for Set 1-B shows a lower peak for the delivered dose profile compared to the planned dose profile. The maximum dose Dmax measured by EBT3 for Set 1-B was 104·24 ± 0·81% but the optimised Dmax was 108·83%. Figure 4e for Set 2-A shows a relatively homogenous profile with minimal increase in the peak at the phantom edge, and the measured profile fits relatively well with the computed planned profile. The Dmax measured by EBT3 for Set 2-A was 103·27 ± 0·56%, the TPS optimised Dmax was 104·34%. In Figures 4f–h for Set 2-B, although the over-fluence peak was not present, the measured profiles showed significant reduction in dose coverage at the phantom edge.

Figure 4. Central dose profiles for all the plans at best setup.
Figures 5–7 show the DVH parameters for the optimised and delivered plans. The delivered DVHs were reconstructed from the MVCT acquired prior to treatment delivery; the recalculations were performed by TomoTherapy Planned Adaptive software. Error bars of 1% are displayed for all the plotted data in Figures 5–7. The D2% for the planned and delivered plans was well within 1% except for Set 1-B. The D98% and V95% showed good agreement for the plans from Control Set up to Set 2-A. There was significant reduction for the D98% and V95% of Set 2-B and Set 3 when 4 mm VB with 1·0 g/cc density and 6 mm VB was used for the respective plan.
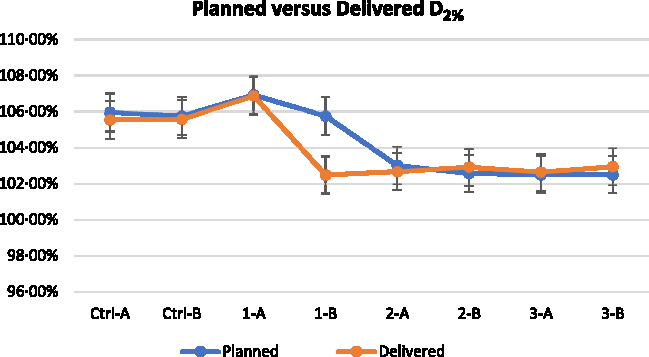
Figure 5. Near maximum dose D2% of planned and delivered for all the plans. (Note: 1% error bar).
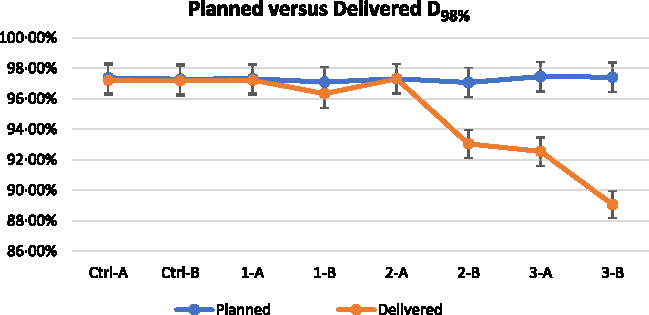
Figure 6. Near minimum dose D98% of planned and delivered for all the plans. (Note: 1% error bar).
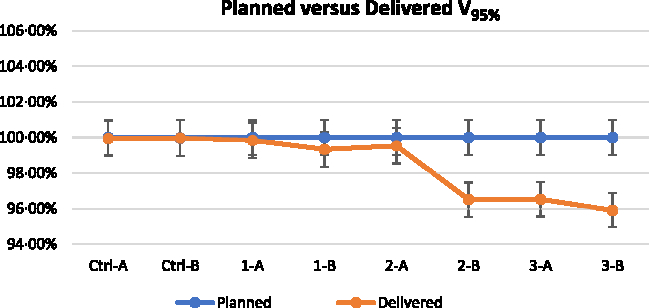
Figure 7. Dose coverage V95% of planned and delivered for all the plans. (Note: 1% error bar).
Optimisation of superficial PTV with the use of VB of 4 mm with 0·5 g/cc assigned density (Set 2-A) showed the best results when measured for the best setup. The plan for Set 2 was further experimented with lateral shifts to the higher photon fluence regions. Figures 8 and 9 show the measured central dose profiles for Set 2-A and Set 2-B, respectively, at 1, 2 and 3 mm shifts. The Dmax measured with EBT3 for the plan of Set 2-A at best setup was 103·27 ± 0·56%, and for 1, 2 and 3 mm shifted setup were 106·69 ± 0·58, 109·96 ± 0·97 and 109·92 ± 0·82%, respectively. The Dmax measured with EBT3 for the plan of Set 2-B at best setup was 103·31 ± 0·70%, and for 1, 2 and 3 mm shifted setup were 102·49 ± 0·80, 102·85 ± 0·49 and 103·41 ± 0·61%, respectively.
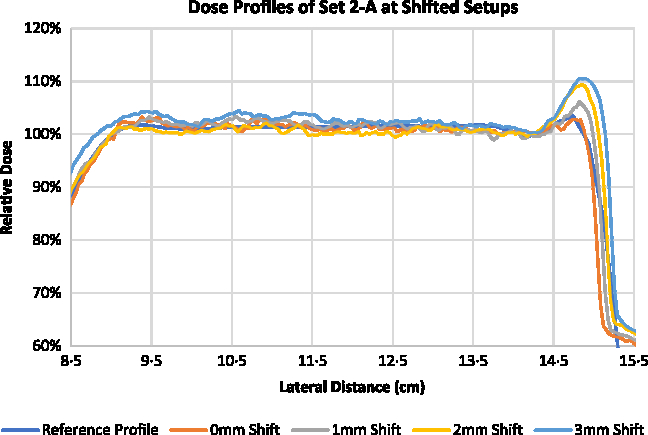
Figure 8. Central dose profiles for the delivered Set 2-A at lateral shifts.
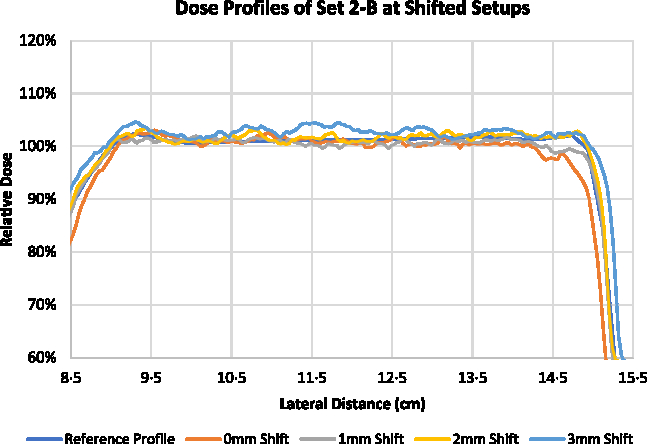
Figure 9. Central dose profiles for the delivered Set 2-B at lateral shifts.
Figures 10 and 11 illustrate the change in D2%, D98% and V95% for Set 2-A and Set 2-B, respectively, at 1, 2 and 3 mm shifted setups. Based on the reconstructed DVHs, the D2% of the delivered plans for Set 2-A increased from 102·91 to 106·54, 108·69 and 110·33% for 1, 2 and 3 mm shifted setups, respectively. The V95% and D98% for Set 2-A were relatively unchanged for the shifted setups compared to the best setup. For Set 2-B, the D2% remains relatively unchanged for the shifted setups compared to the best setup but the V95% increased from 96·33 to 99·85, 99·96 and 99·94% for 1, 2 and 3 mm shifted setups, respectively. The D98% also increased from 92·52 to 96·57, 96·69 and 96·56% for 1, 2 and 3 mm shifted setups, respectively.
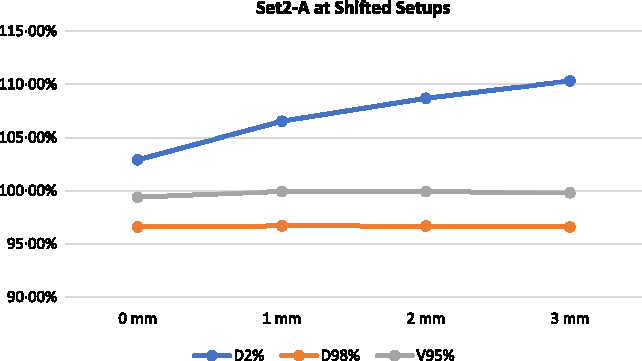
Figure 10. Delivered DVH parameters for the delivered Set 2-A at lateral shifts.
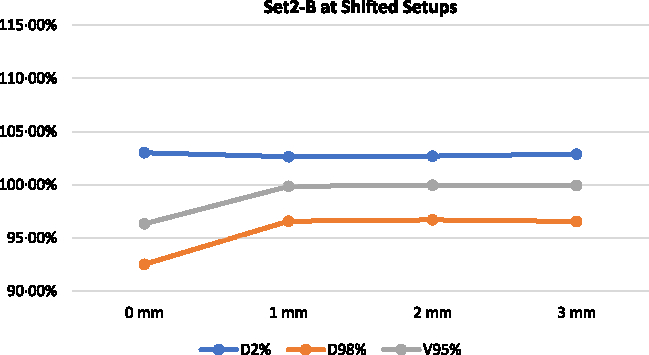
Figure 11. Delivered DVH parameters for the delivered Set 2-B at lateral shifts.
Discussion
For superficial PTV, the challenge in TomoTherapy TPS dose optimisation arises due to the lack of build-up regions for the photon beam. With the inverse planning algorithm, the TPS will continuously boost the photon fluence around the superficial target volumes in order to achieve the specified dose coverage.Reference Chui and Spirou 9 The plan optimisation stage of this study showed the use of 2 mm VB is insufficient to provide an adequate build-up region. The use of 4 and 6 mm VB was able to produce optimised plans with Dmax and D2% below 105%. This shows that virtual build-up depth of 4 mm and above is sufficient. The density assigned to the VB had minimal impact during plan optimisation as the planning DVH results for PTV A and PTV B showed no significant differences.
The utilisation of VB introduces discrepancies in actual dose delivery because there is no physical bolus used in actual delivery. The build-up region that the TPS took into account for calculation and optimisation is absent during the actual delivery. The D2% calculated from the TPS plans was relatively consistent for the delivered plans except for Set 1-B where 2 mm VB with 1·0 g/cc was used. The TPS overestimated the D2% for Set 1-B by 3·27%. The D98% and V95% were also overestimated by the TPS for Set 2-B and Set 3 when VB of 4 mm with 1·0 g/cc density and 6 mm VB were used. When VB with adequate thickness is utilised during dose optimisation, the TPS assumes there is sufficient matter in the photon paths for energy deposition and hence the photon fluence was significantly reduced to achieve the similar dose coverage. However, the use of 6 mm VB showed significant reduction in the delivered dose measurement for the PTV at the phantom edge. Overcompensation of virtual build-up depth resulted in insufficient photon fluence assigned by the TPS to achieve the desired dose coverage in actual delivery. VB of 2 mm was insufficient while VB of 6 mm was overcompensating for the lack of build-up region.
Following the results analysed for the plans at best setup, in which Set 2-A that uses the VB of 4 mm with 0·5 g/cc combination showed the best solution, it was decided that Set 2 to be experimented again with lateral shifts towards the higher fluence region. The space next to the superficial PTV at the phantom edge was assumed to be the higher fluence region. The D2% increased by approximately 2% with every 1 mm shift towards the higher fluence region for Set 2-A while it remained relatively consistent for Set 2-B up to 3 mm shifts. The D98% and V95% for Set 2-A remained consistent for best setup and up to 3 mm shifts. The D98% and V95% for Set 2-B increased by approximately 4 and 2·5%, respectively, for 1 mm, and remained consistent thereafter at 2 and 3 mm shifts.
At best setup, the results for Set 2-A showed the least discrepancies between planning and actual delivery, and it seemed to be ideal. However, when lateral shifts were applied, it was shown that the photon fluence at the phantom edge was significantly higher than when 1·0 g/cc VB was used. This implied that the VB combination of 4 mm with 1·0 g/cc provided a more robust solution to the optimisation of superficial PTV.
The findings of this study can be used as a guide for the dosimetrists to consider in using VB of 4 mm with 1·0 g/cc assigned density for IMRT optimisation of superficial PTV or target volume that extends to the patient’s body. Clinics should only use this as a guide and perform due diligence for verifications of this technique.
Conclusion
The optimal thickness and density of the VB to be used for the optimisation of superficial PTV using TomoTherapy are 4 mm and 1·0 g/cc, respectively. The use of this VB combination was able to maintain the dose coverage V95% above 95% and Dmax below 105% in actual delivery. It was also shown to be robust enough to account for shifts into the higher fluence region up to 3 mm with no increase in hot spots.
Author ORCIDs
Gim Chee Ooi, 0000-0003-2645-3123, Iskandar Shahrim Bin Mustafa, 0000-0003-3875-4943
Acknowledgements
None.


