PURPOSE OF ARTICLE
The purpose of this review is to provide a resource for non-specialists in radiocarbon (14C)- based geochronology to refute allegations that 14C values older than, at most, 10,000 BP are invalid. Those advancing such opinions argue that 14C laboratories using accelerator mass spectrometry (AMS) technology reporting 14C background values provide scientific support for their point of view. The specific question posed by these advocates typically takes a form similar to: “If organic samples purported to be hundreds of thousands to millions of years old and older are reported consistently to contain 14C by AMS laboratories, does not such data demonstrate that the true ages of these materials must be measured in the range of thousands of years not millions and hundreds of millions of years?”
It is our view that such a statement reveals that these individuals misunderstand a number of features of AMS technology as currently applied to the measurement of natural levels of 14C in samples. Such lack of knowledge extends to issues involving the requirements of sample processing and the inherent contamination of samples of infinite or near infinite 14C age by exogenous modern or near modern carbon. Because of these and other misunderstandings, the implications of background data reported by AMS 14C laboratories are misinterpreted.
In the following discussion, we would like to emphasize to general readers that all of the material presented here is well-known to those involved with the use of AMS instruments measuring natural level 14C. The general principals involved are also well understood by those scientists measuring other rare nuclides at or close to background levels. Also, we need to note that we will include considerations of issues that are not usually addressed in current 14C research papers, since general features of the various types of AMS 14C systems have already been well described in the literature (For example, Kutchera Reference Kutschera2005; Povinec et al. Reference Povinec, Litherland and von Reden2009; Chen et al. Reference Chen, Guo and Liu2011; Litherland et al. Reference Litherland, Zhao and Keiser2011).
In addition, some explanations, definitions of terms, and general understandings assumed in contemporary research presentations may not be immediately obvious to a general reader or non-specialist. Because of this, these items will be restated here in much greater detail than it is in the contemporary standard research literature. If some readers wish to refresh their overall understanding of the general features of the 14C dating method, the presentations in Taylor et al. (1992), Trumbore (Reference Trumbore2000), Jull and Burr (Reference Jull and Burr2014), and Taylor and Bar-Yosef (Reference Taylor and Bar-Yosef2014) contain helpful information.
NATURE OF THE MISUNDERSTANDINGS
In dealing with this topic, we suggest that the fundamental problem of those rejecting the validity of 14C values in excess of, at most, 10,000 years, citing the objection stated above as a basis of their objection, is that they appear to lack a basic understanding of the nature of AMS technology used in the measurement of 14C. Specifically, there are four areas where this lack of knowledge has led to erroneous statements when they comment on AMS-based 14C measurements on various types of infinite age samples.
By infinite age samples, we mean organics for which it can be reasonably assumed that, due to the ~5700-year 14C half-life, we can be confident that all of the cosmogenic (cosmic ray produced) 14C originally contained in these samples has long decayed away. This is because, based on various lines of scientific evidence, the geological and/or paleontological ages of these samples are at least several hundred thousand years and, in many cases, many orders of magnitude older. In making this statement, we assume, of course, that any infinite age sample has not been contaminated by younger organics. As we will see, this assumption will need to be significantly nuanced later in this discussion.
The four areas where these individuals appear to exhibit particularly deficient knowledge are (1) the definition and implications of “backgrounds” and “sample blanks” employed in AMS-based 14C measurements, (2) an understanding of the difference between finite and infinite 14C age determinations, (3) the distinction between “machine-based backgrounds” and “sample-based backgrounds” in creating net background values unique for each AMS system measuring natural 14C and, (4) the effects of trace amounts of modern or near modern contamination on measured 14C values when dealing with infinite age samples.
We will begin by outlining the basis on which AMS-based 14C measurements are obtained by first reviewing the general operational features and components of the majority of AMS systems currently measuring natural levels of 14C. We will then focus attention on the definition, nature, sources, and implications of backgrounds / sample blanks in obtaining 14C data. In commenting on the sources of AMS-based 14C backgrounds, we will provide the basis for our view that, of all of the possible scientifically relevant explanations concerning the sources of 14C when infinite age samples are being measured, those individuals holding the view stated above have elected to advocate the least probable explanation.
NATURAL 14C DETECTION TECHNOLOGY AND TERMINOLOGY
From the very beginning of 14C studies, researchers involved in instrument design for the measurement of natural 14C activity were confronted with several physical realities which had to be addressed if routine measurements of natural or cosmogenic 14C concentrations were to be accomplished at some reasonable level of accuracy and precision. In this discussion, accuracy addresses how close a 14C-derived age determination comes to the actual or true age of a given sample. Precision refers to the magnitude of the time segment or interval that is assigned to a 14C age value based on some clearly defined criteria. For 14C measurements, that time envelope is largely, but not entirely, dependent on the counting statistics associated with the measurement of the 14C content of a given sample and the various standards used in calculating 14C ages.
One of the principal challenges in obtaining natural level 14C measurements is the result of the very low concentration of natural 14C in organic samples at the level of about 1 14C atom for every 1012 12C atoms in modern organics. There is also artificial “bomb” 14C, which was produced during the detonation and testing primarily of thermonuclear weapons in the atmosphere beginning in the mid-1950s and accelerating in the early 1960s. The potential implications of the existence of bomb 14C for our topic will be discussed below.
Any type of technology designed to measure natural 14C levels at a reasonable level of accuracy and precision is confronted with the task of identifying and measuring pulses—typically in an electronic circuit—which usually indicate the presence of 14C in a sample. In AMS technology, the signals from non-14C mass 14 particles such as the most plentiful isotope of nitrogen, 14N, or mass 14 molecules such as 12CH2, would be multiple orders of magnitude more prevalent than 14C if it was not for a fortunate circumstance that will be explained below. Clearly, natural level 14C measurement technologies used for dating applications must deal with highly disadvantageous “signal to noise” isotopic ratios.
It is critical to an understanding of the issues raised in this paper to realize that all AMS systems measuring 14C concentrations, together with all other analytical instruments designed to obtain precise quantitative measurements of physical entities such as isotopes, elements, or molecules, share a well-known characteristic. This characteristic is referred to by somewhat different terms depending on the specific technologies employed. In the case of the methods used to measure natural level14C concentrations, that term is background. In some contexts, the term blank as in “machine blank” or “sample blank” is also used. In an instrument system designed to measure natural levels of 14C, a background or blank is the product of some pulse or signal appearing in an electronic circuit which typically indicates the presence of 14C when, in fact, indigenous 14C contained in a given sample can be reasonably assumed not to be present.
So that the point just made will not be passed over quickly, let us reiterate the statement made at the end of the previous paragraph. Every sensitive modern analytical instrument of which we are aware, no matter what type of physical entity such an instrument has been designed to measure, exhibits some type of background or sample / machine blank signal. There is, as far as we know, no exception to this statement. In the remainder of this discussion, we will use the term background to encompass all of these types of signals.
In 14C studies, a sample used for background measurements would be an organic of sufficient geological or paleontological age so that it can be reasonably assumed that, given the 14C half-life of ~5700 years, all of that sample’s original 14C content should have been reduced to zero. Examples of the types of organics used in the measurement of 14C as infinite age or background samples would be fossil organics of various types such as coal, natural gas, and petroleum products, as well as geological graphite and Mesozoic age limestone. We might here note that questions have been raised regarding the use of coal samples which have been contaminated with organics of more recent origin as the result of the presence of various types of in situ microorganisms to serve as background samples (Lowe Reference Lowe1989; Vorres Reference Vorres1989; Chapelle et al. Reference Chapelle, O’Neill, Bradley, Methe, Ciufo, Knobel and Loveley2002). Others report that if adequate chemical pretreatment methods are rigorously and consistently employed, the problems reported with coal can be resolved (Santos Reference Santos2011).
These types of organic samples are sometimes referred to informally as “dead” from a 14C perspective. Obviously, if such a sample has been contaminated in some manner by younger organics, the assumption of essentially zero 14C content would be invalidated. Unfortunately, as we will see, the effects on background samples of several types of trace 14C contamination from modern organics, even at the level of less than 100 parts per million, can be most dramatic. Using the definition stated here of the term background in 14C measurements, we can now consider the distinction between finite and infinite 14C ages.
Finite 14C Ages: A finite 14 C measurement and the age determination based on this measurement is one in which the measured 14 C content in a sample can be distinguished at some explicitly defined level of statistical confidence from that exhibited in a background sample in the same detector operating under a common set of experimental conditions (see Figure 4). Most published 14C “dates” are finite 14C ages. In AMS systems, the difference between the net mean measured 14C/12C ratio of a sample of unknown 14C age and that of the background material compared with the net mean 14C/12C ratio of a sample of known 14C content defining the activity of a sample of zero 14C age—a modern reference standard—is used in the calculation of a finite 14C age of the sample.
A finite 14C-based age measurement is indicated when the results of a measurement are cited in conjunction with a numerical value that expresses the experimental uncertainly associated with the calculated finite age value. By general agreement within the 14C research community, that experimental uncertainty is typically expressed in terms of a value which is dominated by counting statistics expressed at the ±1 sigma (±1σ) level which is equivalent to 68.3% of the age distribution. In some cases, an additional consideration of non-random scatter in the counting data is also included in the calculation. A definition and review of the concept of a statistically based standard deviation, as expressed in terms of “sigma” variations, can be found in any standard statistics reference text. Reviews and illustrations of how these statistical concepts are applied in expressing 14C ages can be found in Taylor and Bar-Yosef (Reference Taylor and Bar-Yosef2014:121–129) and the literature cited in that work.
A finite 14C age expression takes the form: [14C age in 14C years BP (Before Present)] ± [±1σ-based measurement uncertainly expressed in 14C years]. Therefore, a 14C age value expressed as, for example, 2450±20 BP is a finite 14C age. In this expression, the units (years) are assumed and “BP” can be understood initially as indicating “Before Present” although “Present” for technical reasons has a special meaning in 14C studies (Stuiver and Polach Reference Stuiver and Polach1977). Because of this, it was suggested early in the history of 14C studies that “BP” should be referred to as an abbreviation for “Before Physics.” It might also be helpful here to explain that the finite 14C “date” cited above represents a short hand expression that defines a probability-based age range. A more detailed explanation of the special meaning of “BP,” the statistics associated with the expression of conventional 14C-based age expressions, as well as details explaining how finite 14C ages are calculated can be found in Taylor and Bar-Yosef (Reference Taylor and Bar-Yosef2014:144–149) and references cited there.
Infinite 14C ages: An infinite 14 C measurement and the age based on such a measurement is assigned to a sample when its measured 14 C content cannot be distinguished at some stated level of statistical confidence from that exhibited in a background sample. It should be made clear that infinite 14C measurements only define lower age limits. There is no upper age limit indicated when an infinite age 14C age determination is cited. In the case of, for example, an expression of “> [greater than] 60,000 BP” (again “years” are assumed as the units) indicates that, on the basis of its 14C concentration, the true age of the sample could range from 60,001 years (ignoring for a moment statistical considerations) to literally the age of the universe. From the perspective of the 14C measurement obtained on that sample, it is not possible to determine an upper limit.
Infinite 14C values are indicated when the age expression takes the form: “>” followed by a value calculated based on a comparison with the background values measured by the same instrument, calculated following explicitly stipulated statistical protocols. For a general explanation of how infinite 14C ages are calculated, interested readers may consult Stuiver and Polach (Reference Stuiver and Polach1977) and Taylor and Bar-Yosef (Reference Taylor and Bar-Yosef2014:121–129).
AMS 14C TECHNOLOGY: MEASUREMENT ELEMENTS, PROCEDURES, AND BACKGROUNDS
With these general points in hand, we will now proceed to the explanation of the specific nature of the misinterpretations of the published background 14C values obtained on infinite age/background samples measured by AMS technology. To do this, we need to first provide a very brief overview of the essential components of a typical AMS system currently being used in the measurement of natural levels of 14C in sample materials. This will provide a context for a discussion of the most probable set of explanations for the presence of electronic pulses in detector circuitry indicating the presence of 14C from samples reasonably assumed to contain no measureable cosmogenic 14C. We will also define a few terms as applied specifically to 14C detection in the context of how these terms relate to the measurement of 14C backgrounds in AMS systems.
Although the first AMS-based 14C measurements were obtained on a cyclotron particle accelerator (Muller Reference Muller1977), the current generation of AMS instruments used for routine natural level 14C measurements, are, with a few exceptions, electrostatic accelerators (Tuniz et al. Reference Tuniz, Kutschera, Fink, Herzog and Bird1998; Tuniz and Norton Reference Tuniz and Norton2008). It is data from these types of AMS instruments which have been most often cited and misunderstood by current critics. As indicated by the term itself, AMS systems combine the technical capabilities of a mass spectrometer with that of a particle accelerator.
Mass Spectrometer: A mass spectrometer is an instrument that can measure the ratios or relative concentrations of selected isotopes, elements, or molecules exhibiting different physical masses, weights or concentrations. In the case of AMS systems used in obtaining 14C ages, the relevant values being measured to provide the basis of calculating 14C ages are the ratios of the atomic mass of the naturally occurring carbon isotopes, 12C, 13C, and 14C, as represented by 14C/12C and 13C/12C values.
14C/12C ratios measured in samples are the values used to infer the age of a sample using standardized algorithms and protocols. 13C/12C ratios (usually expressed as δ13C values) measure stable carbon isotope fractionation effects caused by several factors. Natural carbon isotope fractionation occurs, for example, depending from which carbon reservoir (e.g., terrestrial or marine) a given carbonaceous sample was derived. Also carbon isotopes in natural materials will exhibit different fractionation effects depending on which type of photosynthetic biochemical pathways are followed in different species and genera of plants.
Fractionation can also be introduced during an AMS-based measurement of a sample due to several aspects of the operating characteristics of a particle accelerator. Fortunately, in the calculation of a conventional 14C age, measured variations in the δ13C values will have a relatively small effect on the 14C/12C ratios exhibited in samples. However, to obtain the most precise determination of an inferred 14C age, adjustments or normalization of the 14C/12C ratios in terms of variations in the δ13C values are necessary to express a conventional 14C age. Stuiver and Polach (Reference Stuiver and Polach1977) and Taylor and Bar-Yosef (Reference Taylor and Bar-Yosef2014:26–27;124–127) explicitly define conventional 14 C ages and provide an explanation of how and why 14C/12C ratios are adjusted using δ13C values so that all such 14C age determinations are normalized to a common δ13C value.
Particle Accelerator: A particle accelerator is what the name indicates. It accelerates a beam of particles within a confined space under a set of specified conditions. The specific functions of various components of an AMS instrument in obtaining AMS-based 14C ages will be described after a consideration of the types of 14C backgrounds that are encountered in AMS systems and how certain required sample conversion procedures contribute to background levels.
Types of AMS Systems 14C Backgrounds: There are two major sources of 14C backgrounds registered in AMS systems: sample based and instrument based. Sample-based sources reflect the effects of (1) exogenous 14C contamination not removed by the application of appropriate sample physical and chemical pretreatment protocols and/or (2) 14C added during or after the application of sample conversion protocols that renders pretreated samples into a form required by the measurement technology. Instrument-based sources reflect backgrounds produced by the characteristics of how an AMS instrument operates in its measurement of natural carbon isotopic ratios. Both of these background types have multiple sources that can be operating in unique ways depending on sample processing protocols and instrument component configurations employed in different AMS laboratories at different times.
AMS Sample Preparation: With few exceptions, organic samples for which an AMS-based 14C age is desired must be subjected first, to pretreatment requirements and second, to conversion procedures.
Pretreatment procedures isolate by chemical and physical means a specific target carbon sample as free as possible from contaminating organics. Contaminating organics are those carbonaceous materials which were not present when a target organic ceased to exchange carbon with its environment. Typically, this occurs on the death of the organism from which the target organic was obtained. Conversion procedures employ various steps which will transform the isolated target carbon sample into a form that will allow the measurement of its 14C content to be undertaken as efficiently and accurately as possible in an AMS instrument using current technologies.
Pretreatment Procedures: The types of samples for which 14C-based age measurements are desired have typically been buried for lengthy periods of time within a variety of subsurface depositional environments which can contain many types of carbon-containing substances sometimes exhibiting a wide range of 14C concentrations. The goal of any 14C pretreatment approach is to remove all non-indigenous organics from a targeted sample, i.e., remove all organics which were not contained within that specified organic at the time of its death or withdrawal from whatever carbon reservoir it is derived. That is the goal. The reality is that with most natural materials, removing absolutely all, i.e., exactly 100.0%, of the carbon containing contaminants is, in many cases, not a routinely achievable goal.
Over the more than six-decade history of 14C dating, a variety of sample-specific chemical and physical pretreatment protocols have been developed. Some of these strategies are straightforward while others involve an extended series of chemical steps. Some samples, such as wood and charcoal, typically present the fewest problems in removing a very high percentage of post-death contaminating organics. Others, such as bone, have presented more challenging problems and a variety of procedures have been applied with the goal of removing as much contamination as possible on a routine basis. For a more detailed discussion of the issues and problems involved in sample preparation for 14C analyses, interested readers can refer to Chapter 3 in Taylor and Bar-Yosef (Reference Taylor and Bar-Yosef2014).
One of the points noted above needs to be reiterated. Although sample pretreatment strategies have become very efficient in removing contamination from many types of samples, it would be presumptuous of 14C laboratories to state that these techniques always, or even most of the time, remove 100.0% of the contamination mixed into or absorbed/adsorbed into samples. Thus, no research laboratory of which we are aware makes such a claim. What can be stated with a high degree of confidence is that if standardized sample pretreatment protocols have been carefully followed for standard samples such as charcoal and wood, it is highly likely that these standard methods will have, in the vast majority of cases, removed all but, at most, a few tenths of percent of contaminating organics.
For the majority of samples which have been dated by the 14C method to less than 10,000 BP, this proviso is usually not of major concern because the very small trace amounts of contamination remaining after standard pretreatment methodologies are applied would adjust the 14C content of a sample much less than the expected age range reflecting the analytical or measurement precision. However, when dealing with samples expected to exhibit 14C ages >30,000 years, and especially those exhibiting 14C contents at or close to background levels (>50,000 years), the effects of a few tens of percent or even at levels of 20–30 parts per million of modern organic contaminants will have significant measurable effects as will be reviewed in the next section.
An excellent example of the challenge of entirely removing contamination from a sample of infinite or close to infinite 14C age, which are generally considered most amenable to standard pretreatment approaches, is illustrated from an examination of the results of applying various chemical pretreatment modalities to samples of Kauri wood (Agathis austalis). The samples used in these studies are late Pleistocene in age which have been preserved in various peat swamp deposits located in New Zealand. The Kauri wood samples in Table 1 are assumed to be 14C “dead,” i.e., >65,000 years, based on several lines of evidence. Table 1, Part A, illustrates the varying apparent 14C ages of three compounds isolated from this sample, while Part B illustrates the increasing finite ages that are obtained depending on what types of pretreatment methodologies are employed.
Table 1 Radiocarbon measurements of various fractions Kauri wood from New South Wales, Australia, assumed to be of infinite age. Adapted from Taylor and Bar-Yosef (Reference Taylor and Bar-Yosef2014: Table 3.1).

a Decay counting (Chappell et al. Reference Chappell, Head and Magee1996).
b AMS counting (Santos et al. Reference Santos, Bird, Pilans, Fifield, Alloway, Chappell, Hausladen and Arneth2001).
c ABA-SC=acid/base/acid+stepped combustion.
d ABOX-SC=acid/base/oxidant (dichromate)+stepped combustion.
e CE-SC=cellulose-extraction (Loader et al Reference Loader, Robertson, Barker, Switsur and Waterhouse1997)+stepped combustion.
For a more detailed discussion of the many issues and problems involved in applying various physical and chemical pretreatment modalities to various categories of sample types employed in 14C studies, the materials contained in Gillespie (Reference Gillespie1984), Stuiver and Polach (Reference Stuiver and Polach1977) and Chapters 3 and 5 of Taylor and Bar-Yosef (Reference Taylor and Bar-Yosef2014) provide a number of examples.
Conversion Procedures: Following the completion of appropriate pretreatment steps, in all AMS systems currently measuring 14C on a routine basis, a sample must first be converted into an appropriate physical form. The initial step in this process involves for samples such as wood, charcoal, or bone, is combustion. In the case of, for example, shell or other carbonate samples, the process involves acidification.
In a typical situation in the case of combustion, the chemically pretreated sample plus copper oxide to provide oxygen for the reaction, and silver to react with and thus remove non-carbon combustion products such as sulfur or nitrogen oxides, are placed in a quartz tube. This tube is evacuated to remove atmospheric gases which contain modern CO2, then sealed, and the contents heated to 900°C. For acidification, the chemically leached carbonate sample is placed in a reaction tube, the tube is evacuated to remove atmospheric gases including CO2, and an acid is introduced. In both cases, the desired reaction product of either combustion or acidification is the same, carbon dioxide (CO2). Even though there is much focus on obtaining and processing materials such as copper oxide and silver used in the conversion of a sample into CO2 to be carbon free, minute traces of exogenous carbon inevitably remain in these reactants.
While a few AMS instruments can employ CO2 directly in their ion sources, in the majority of systems currently routinely operating, the CO2 is subjected to an additional set of chemical processes whose final end product is a form of filamentous graphite. This term is used to distinguish this type of synthesized graphite from naturally occurring geological graphite. Today, in most operational AMS laboratories, this graphitic form is produced by reducing the CO2 obtained from sample combustions/acidifications on iron acting as a catalyst in the presence of hydrogen or zinc at a temperature of about 500°C (Santos et al. Reference Santos, Southon, Griffin, Beaupre and Druffel2007). The amounts of this synthetic graphite typically employed in AMS systems range from a few milligrams (mg) down into the 10–20 microgram (μg) range where 1000 μg = 1 mg. The effects on 14C measurements as a function of using microgram amounts of this synthesized graphite below about 300 μg to obtain a AMS-based 14C measurement is illustrated in Figure 6.
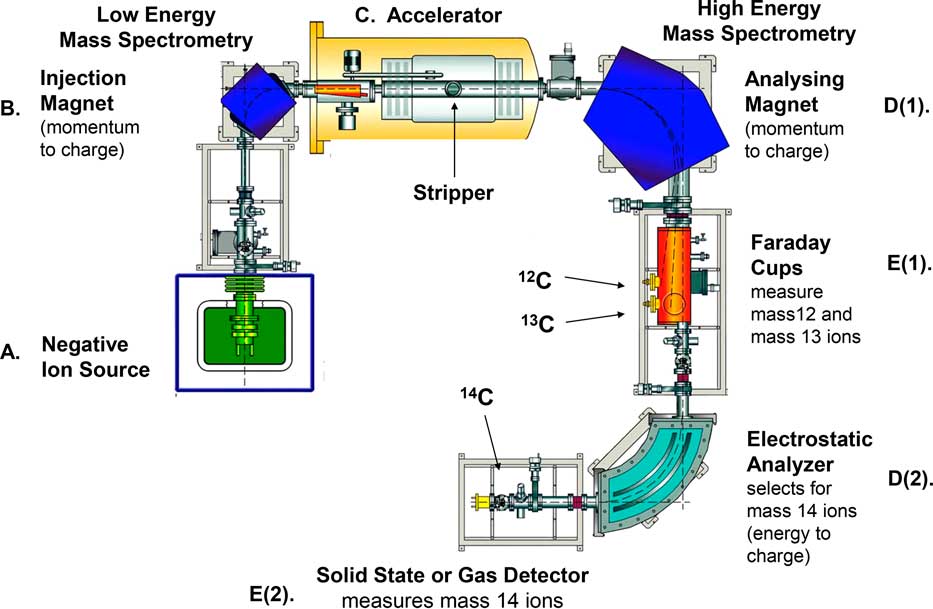
AMS Instrument Characteristics: We now turn to a brief description and operational purposes of the major components of a typical AMS instrument designed to measure as accurately and precisely as possible natural levels of 14C contained in a sample. Figure 1 is a simplified schematic representation of the major components of the AMS instrument currently operating at the Keck Carbon Cycle Accelerator Mass Spectrometry (KCCAMS) Laboratory located in the Department of Earth System Science, University of California, Irvine (Southon et al. Reference Southon, Santos, Druffel-Rodriquez, Druffel, Trumbore, Xu, Griffin, Ali and Mazon2004). The major components it incorporates are generally representative of those which are included in what is typically referred to as a “compact” AMS system. These AMS systems have been specifically designed to undertake natural level 14C/12C ratio measurements.

Figure 1 Simplified representation of major components of an Accelerator Mass Spectrometer (AMS) instrument measuring natural level 14C at the W. M. Keck Carbon Cycle Accelerator Mass Spectrometry (KCCAMS) Laboratory, Department of Earth System Science, University of California, Irvine. The letters (A to E) refer to the components listed in Table 1. Source: This figure is adapted from Figure 4.6 in Taylor and Bar-Yosef (Reference Taylor and Bar-Yosef2014).
In this type of AMS instrument, there are five major components (Figure 1, Components A through E) in addition to a control and data analysis system. These components include a (A) negative ion source, (B) injection magnet, (C) accelerator, (D) analyzing magnet, and (E) 12C, 13C, and 14C ion detectors. (The paragraph following the next one defines ions.)
The essential functions of and physical processes involved in each of the major components of an AMS system are briefly summarized in Table 2. We have already noted the preparation of a form of graphitic carbon synthesized from CO2 produced from either the combustion or acidification of a sample. Up to about 1 mg of this synthesized graphitic carbon from each sample is pressed into a small sample holder which, in the UCI AMS instrument, is then inserted into a wheel assembly holding 60 samples (Figure 2). This sample wheel is then mounted on a component (Figure 1, Component A) of the AMS system ion source (Figure 3). This component with the sample wheel attached can then be mated to the main body of the ion source and a high vacuum obtained. Once an appropriate vacuum is achieved, the ion source is opened to the beam line of the AMS system leading to the Injection Magnet (Figure 1, Component B).

Figure 2 Photograph of KCCAMS MC-SNICS ion source sample wheel which can accommodate 60 sample holders (cathodes). To the right of the sample wheel is a sample holder with its size indicated by reference to a United States one-cent piece. The hole into which the sample synthesized graphite (see text) is packed is 1 mm in diameter and has a depth of 4 mm.

Figure 3 Photograph of the KCCAMS MC-SNICS ion source sample wheel (Figure 2) with 60 samples mounted on a movable assembly which will be mated to the body of the ion source (on the right out of the photograph), a vacuum established, and a valve opened into the beam line. See text for details.
Table 2 Accelerator mass spectrometer: major components, functions and processes for measurement of 14C (Tuniz et al. Reference Tuniz, Kutschera, Fink, Herzog and Bird1998; Southon et al. Reference Southon, Santos, Druffel-Rodriquez, Druffel, Trumbore, Xu, Griffin, Ali and Mazon2004; Taylor and Bar-Yosef Reference Taylor and Bar-Yosef2014).

The function of the ion source is exactly what its name implies, the production of ions. An ion is an atom or molecule to which electrons have been added to or removed causing it to become a charged (either negative or positive) particle and thus rendered susceptible to the effects of electromagnet fields. Currently, for most AMS instruments designed to measure natural level 14C/12C ratios, the ion source is designed to produce negative ions. The reason for this is stated below. Some investigators have recently suggested that there would be certain advantages if initially, positive ions are produced from samples. These positive ions then would be immediately converted to, and accelerated as, negative ions (Freeman Reference Freeman2017; Paul Reference Paul2017).
Over the more than four-decade development of AMS technology, the ion source components of a typical AMS system have been the focus of almost constant technical evolution. The most important aim of modifications have been design changes which can enhance the efficiency by which ions are produced from graphitized samples. The principal purpose of these design changes is to increase the intensity of the beam current. One consequence of improvements made in the strength of the beam current is to allow more samples to be measured during a single measurement run of the same duration without compromising the precision of individual sample measurements.
A design feature of most ion sources contributes to the possibility of what is informally termed “cross talk” between samples can occur. Cross talk refers to trace amounts carbon from one sample being deposited on another sample during measurement or on the surface of components of the ion source itself. Figures 2 and 3 illustrate the close physical proximity of different samples in the wheel assembly. For the vast majority of finite age samples exhibiting ages less than about 40,000 years, such trace contamination can introduce very slight changes in 14C/12C ratios which is almost always assumed to be subsumed within the measurement precision. However, for samples of infinite or near infinite 14C age, the effects are measureable and contribute to the level of the backgrounds exhibited in such samples.
The ionization process causes particles to exhibit either a negative (electrons added) or positive (electrons removed) charge. In most AMS systems currently measuring 14C on a routine basis, the ion source is designed to add electrons which yields negatively charged ions. Since the movements of these negatively charged ions can now be influenced by electromagnetic fields, these particles can be accelerated and focused as a beam within a tube maintained at a high vacuum to greatly reduce (but not totally eliminate) the chances of collisions with other particles.
In a typical, currently routinely operating, compact AMS system, an injection magnet (Figure 1, Component B) directs the negatively charged ions exiting the ion source into a particle accelerator (Figure 1, Component C). In an AMS system measuring 14C, one of the major problems of identifying and measuring 14C ions is that, in addition to these ions, there are other mass 14 particles produced in the ion source. Normally, most of these mass 14 particles would be ions of ordinary nitrogen (14N) which are multiple orders of magnitude more prevalent than 14C ions. However, employing negative nitrogen ions, the major problem that would have been caused by the presence of nitrogen ions of mass 14 can be avoided because of a very fortunate circumstance.
That circumstance is that nitrogen either does not form a negative ion or, if a negative 14N ion is actually formed, it has a lifetime much shorter than the few microseconds (where 1 microsecond = 1/10,000 of a second) transit time of particles traveling from the exit point of an ion source to a detector at the opposite end of the beam line of the spectrometer [Figure 1, Component E(2)]. Thus when a negative ion source is employed in an AMS system, the result is that 14 N is almost completely (but not entirely) eliminated from the beam of particles exiting the ion source.
However, even with the elimination of almost all 14N ions, several other types of mass 14 ions will remain. There will be mass 14 molecules which include carbon atoms, such as 13CH– and 12CH2 –, as well as molecules of other elements, such as lithium, exhibiting mass 14 signatures. These mass 14 molecular species are almost entirely eliminated because of a major design feature in most AMS systems. This is a component of many accelerators typically referred to as a “stripper” (Figure 1, Component C). This is a gas-filled tube (in some AMS systems it is a very thin foil) which functions to remove electrons (or “strip” electrons) from the negatively charged ions as they pass through the gas (or a foil) with the result that the negative ions entering the accelerator are changed to positively charged ions. The important effect of this “stripping” process for 14 C AMS technology is that molecules are split apart into their constituent isotopic species.
In the majority of AMS instruments, the acceleration of particles is accomplished in a two-step or tandem mode in which the negative ions exiting the ion source are first directed into the accelerator by the injector magnet (Figure 1, Component B), and then “pulled toward” a positively charged high voltage terminal near the stripper. After passing through the stripper, because these ions are now positively charged, they are “pushed away” from the positively charged terminal. In a few AMS instruments, only single stage acceleration is employed.
These now positively charged particles then enter an analyzing magnet [Figure 1, Component D(1)] which separates them into mass 12, mass 13, and mass 14 ions. Mass 12 and mass 13 ions are directed to separate ion collection devices known as “Faraday cups” [Figure 1, Component E(1)]. These devices convert the impinging mass 12 and 13 ions into a current which can be calibrated so that the output from each cup accurately represents the number of ions impinging on it.
The final step of the measurement process involves passing the particle beam through an electrostatic analyzer [Figure 1, Component D(2)] which will only pass mass 14 ions and then direct these ions into a gas counter (some AMS systems employ a solid state device) where the number of individual mass 14 ions and their energies can be measured [Figure 1, Component E(2)]. The computerized instrument component controls and data analysis systems (Table 1, Component F) integrates the signals coming from the 12C, 13C, and 14C ion collection devices and, using appropriate algorithms, computes 14C/12C and 13C/12C ratios of the sample being measured.
Background Measurement Characteristics: It might be helpful to gain an appreciation of the nature of 14C background measurements in a typical AMS system in relationship to measurements obtained on other samples. Figures 4A and 4B provide examples of a portion of the set of data needed to calculate an AMS-based 14C age for two samples. The data illustrated in these plots are typical of that currently being obtained on the AMS system described in Figure 1 and Table 1 operating at the KCCAMS laboratory at the University of California, Irvine (Southon et al. Reference Southon, Santos, Druffel-Rodriquez, Druffel, Trumbore, Xu, Griffin, Ali and Mazon2004; Santos et al. Reference Santos, Southon, Griffin, Beaupre and Druffel2007).

Figure 4 Plots of the relationship between number of detected counts and increasing mass 14 energy channels within an energy window delimited by left and right vertical dotted lines for three types of samples: (1) a modern reference standard, (2) an unknown age, and (3) infinite 14C age background. Figure 4A represents unknown age sample exhibiting a mass 14 ion energy profile approximately half of that of the modern reference standard. Figure 4B represents an unknown age sample exhibiting a mass 14 ion energy profile which appears to be undistinguishable from the background energy profile.
Each plot represents the relationship between the number of detected ions on the y-axis and the energy of these ions falling into a series of energy channels that record each ion’s relative energy on the x-axis (with the energy of the ions increasing from left to right) for three types of samples. More than 99% of the ions detected in the energy window defined by the two vertical dotted lines are mass 14 ions and, of these mass 14 ions, more than 99% are 14C ions. In both figures, the data of three types of samples plotted are (1) a modern reference standard, (2) an unknown age sample and, (3) an infinite 14C age background sample.
The data represented in each plot has been collected over a period of 2.5 minutes. Data obtained during at least 8, 2.5-minute counting cycles, will typically be employed in the measurement of a 14C/12C ratio for each sample which is the principal basis of a calculation of a 14C age. The additional data required for each 14C age calculation is that obtained from two Faraday cup detectors (Component E(1) in Figure 1 and Table 1). They provide data that allows the number of 12C and 13C ions to be measured for each counting interval for each sample. Using the data received from the 12C, 13C, and 14C detectors and by employing appropriate algorithms, 14C/12C and 13C/12C ratios can be calculated for each sample and conventional 14C ages computed.
By simple visual inspection of the data plotted in Figure 4A, we note that the number of ions which are primarily 14C ions detected for the unknown age sample is approximately half of that recorded for the modern reference standard. We would then provisionally conclude that the age of this sample is about one 14C half-life old. Because of a convention adopted by members of the 14C research community that stipulates which 14C half-life should be used in computing a conventional 14C age, the 14C age cited for this sample would be ~5570 years, even though the most likely 14C half-life value is nearer to ~5700 years. The discussion in Stuiver and Polach (Reference Stuiver and Polach1977) provides an explanation of why the most likely 14C half-life is not used in the calculation of conventional 14C dates.
The plot in Figure 4B reveals that the number of mass 14 counts of the second unknown age sample appear, on the basis of visual inspection, to be indistinguishable from those attributable to the infinite 14C age background sample. When all of the measurement data for this sample is recorded, a standard statistical analysis of that data is undertaken. If it is determined that it is not possible to distinguish, at some defined measure of statistical confidence, the mean 14C/12C ratio exhibited by the unknown age sample and the mean 14C/12C ratio of the infinite 14C age background sample, an infinite 14C age would be calculated for this unknown age sample. The definition of and stipulations used in the calculation of infinite 14C ages are enumerated and discussed in Taylor and Bar-Yosef (Reference Taylor and Bar-Yosef2014:127–129), based on information in Stuiver and Polach (Reference Stuiver and Polach1977).
AMS 14C TECHNOLOGY: SOURCES OF BACKGROUND ACTIVITY
The summary contained in the two previous sections briefly reviewed sample pretreatment and preparation steps together with basic features and operational characteristics of AMS instruments undertaking measurements of natural level 14C/12C ratios. That discussion provides a context where we are able now to consider the most likely causes of the backgrounds reported by AMS laboratories.
In Table 3, we list 16 potential sources of 14C signals from carbon samples of assumed infinite 14C age in AMS instruments. Reflecting the two categories already identified in a previous section, the potential sources of AMS system backgrounds have been divided into two types: sample based and instrument based. Obviously, we do not include backgrounds that can be traced to equipment malfunction or non-standard operating conditions. Also, we should emphasize that we do not suggest that each potential source of contamination listed in Table 3 contributes equally to the magnitude of the measured 14C backgrounds in different AMS systems. That certainly would not be correct. The factors that separately and in combination contribute their background signals in AMS systems will be expressed in different levels in different instruments, although it would appear that the causes of the largest percentage of backgrounds which are reported may be very similar.
Table 3 Potential sources of 14C signal in AMS-based 14C measurements from samples of infinite 14C age (Adapted from Taylor and Southon Reference Taylor and Southon2007).

Sample-Based Sources: Twelve of the 16 possible sources of contamination listed in Table 3 would add carbon containing 14C of varying age in different concentrations to the infinite 14C age samples used for monitoring background levels in AMS ion sources. To provide a context that will give us some quantitative scale of what effects might be expected from various sources and amounts of contamination, Table 4 lists apparent ages in the range of 80,000 to 50,000 years in 10,000-year increments that would result from the addition of the indicated amounts of 2 types of environmental exogenous 14C contamination.
Table 4 Background contamination: Effects of addition of modern and 1963 bomb 14C in parts per million (ppm) amounts on apparent ages exhibited by infinite 14C age carbon.

a “Modern” 14C is defined as the 14C/12C ratio of 0.95% NBS OXI standard normalized to a δ13C value of –19‰.
b 1963 Bomb 14C is defined as 200% of the14C/12C of 0.95% NBS OXI standard normalized to a δ13C value of –19‰.
The first column lists the apparent age effects of the addition of various amounts of “modern” carbon measured in units of parts per million (Table 4, Column [A]). “Modern” carbon is a carbon sample whose 14C concentration would cause it to be assigned a “0” BP 14C age. Ordinarily, we might consider “contemporary” and “modern” carbon to be synonymous in terms of exhibiting the same 14C activity. However, in the measurement of 14C concentrations for dating purposes, “modern” is used in a special sense.
It turns out that the 14C activity of contemporary living organics obtaining their carbon directly or indirectly from current atmospheric or biospheric levels of 14C cannot be used to define “0” BP on the 14C time scale. This is due to the impact of the combustion of massive amounts of fossil carbon (e.g., first coal and later petroleum products) and more recently, the production of artificial or “bomb 14C” (see next paragraph). Primarily because of these two human-caused effects on contemporary 14C levels, “modern” or “0” age 14C content has had to be been redefined as a percentage of 14C/12C ratios exhibited by specially prepared standard samples which are used by 14C laboratories to define “modern,” i.e., 0 BP 14C age. For additional information on the nature of “modern” standards used in 14C studies, please refer to Stuiver and Polach (Reference Stuiver and Polach1977).
The second type of modern environmental 14C contamination of background samples is that of “bomb 14C.” The term “bomb” here refers primarily to the effects of thermonuclear weapons detonated in the atmosphere by the United States and the Soviet Union until the 1963 Partial Test Ban Treaty went into effect. One result of the detonation of these devices in the atmosphere was the production of large fluxes of neutrons which, in turn, caused the production of significant amounts of artificial (non-cosmogenic) “bomb” 14C. The maximum amount of this artificial 14C was present in the atmosphere and thus was also contained in living terrestrial organics in 1963 in amounts that resulted in almost doubling the amount of atmospheric and biospheric 14C (Fairhall and Young Reference Fairhall and Young1970; Stuiver and Braziunas Reference Stuiver and Braziunas1998). After 1963, due to the effects of the test ban treaty which prohibited continued atmospheric testing, the amounts of bomb 14C in the atmosphere and biosphere have continuously declined.
By referring to Table 4, we see that the addition of about 50 parts per million (ppm) of “modern” carbon or about 25 ppm of 1963 “bomb” 14C would result in having an organic sample which originally contained absolutely no 14C to exhibit a measured 14C age of ~80,000 BP. An age of ~70,000 BP would be measured in a background carbon sample of infinite 14C age if contaminated with about 160 ppm of modern carbon or about 80 ppm of 1963 “bomb” 14C. Figure 5 graphically illustrates why the addition of these trace amounts of modern or 1963 bomb 14C contamination in parts per million amounts can result in major increases in measured 14C concentrations in infinite age samples. Given the approximately 5700 year half-life of 14C, a plot of the 14C decay curve reveals that when natural 14C levels are at or below that which would indicate an age 50,000 years or older only a few tenths of a percent addition of exogenous “modern” carbon will have the effect of adding from multiple thousands of years to literally several tens of thousands of years to produce pseudo-finite 14C ages.

Figure 5 Relationship between 14C concentrations expressed as percentage of modern carbon (pMC) measured in a sample and the conventional inferred 14C age (14C years BP × 103). Inset figure plots the pMC relationship on a logarithmic scale.
Figure 5 provides a helpful visual representation of that reality by plotting the relationship between 14C concentrations in samples and their approximate inferred 14C ages. We can thus easily see that when residual 14C levels in samples drop below about 0.1% of modern, relatively small changes in 14C concentrations in samples translate into large offsets in inferred 14C ages which would be assigned to those samples. This is one of the reasons that the routine maximum finite 14C ages that are cited by laboratories typically range between 50,000 and 60,000 14C years.
Such an effect can be illustrated as the result of a phenomenon noted in routine operations of AMS-based 14C measurements. We have previously noted that the majority of AMS systems convert CO2 produced from sample combustions or acidifications into a form of synthesized graphitic carbon. Figure 6 presents the results of a series of measurements that provides direct information about the effects of a change in measured 14C ages exhibited in 1140 samples of 3 types of assumed infinite 14C age materials (calcite, wood, and coal) as a function of the amount of synthetic graphitic carbon produced in the graphitization process used at the UCI AMS (KCCAMS) laboratory (Santos et al. Reference Santos, Mazon, Southon, Rifai and Moore2007, Reference Santos, Southon, Drenzek, Ziolkowski, Druffel, Xu, Zhang, Trumbore, Eglinton and Hughen2010). It is assumed that the calcite and coal samples derive from Mesozoic age deposits making these samples at least 60 million years old while the wood was collected from a stratigraphic context associated with oxygen isotope stage 5a or 5c indicating an age of at least 80,000 years.

Figure 6 Relationship between sample size (in milligrams of synthesized graphite and measured 14C age (in 103 years) of 1140 background (infinite age) samples (>105 years calcite, wood, and coal) measured on the KCCAMS instrument. Source: Figure 4.7 in Taylor and Bar-Yosef (Reference Taylor and Bar-Yosef2014).
We observe in Figure 6 that down to ~0.3 milligrams (mg) [ ~300 micrograms (μm)] of synthesized graphitic carbon from an infinite 14C age sample, the measured 14C concentrations held approximately constant at ~0.2 percent of modern carbon (pMC) which is the equivalent to an apparent “age” of ~50,000 years. However, we note that as the amount of the synthesized graphite declines below ~0.3 mg, there are progressive increases in the measured background levels. We see, for example, that infinite age graphite samples of ~0.05 mg (=50 μg) exhibits an apparent age of ~30,000 years and at ~0.01 mg (=10 μg) the apparent ages of these 14C infinite age samples is ~20,000 years. What might the reason be for the consistent increasing 14C background values as a function of the declining amounts of infinite age material as part of the synthesized graphite contained in sample holders?
The cause of these effects has been demonstrated to be due to the very similar amounts of micro-contamination being added to all synthesized graphite samples during the combustion/acidification and/or graphitization process that we have previously described (Vogel et al. Reference Vogel, Nelson and Southon1987; Kirner et al. Reference Kirner, Taylor and Southon1995; Brown and Southon Reference Brown and Southon1997). The effects on the net measured 14C concentration in infinite age samples that contain 300 micrograms and above are not discernible at the level of precision exhibited in infinite age background measurements. However when the synthesized graphite sample weight drops below about 300 micrograms, roughly constant amounts of micro-contamination begin to be measurable as the percentage of exogenous contaminating carbon added to the graphite sample progressively increases.
One factor has been recently documented by a careful study of the effects of current levels of 14C contained in atmospheric gases such as CO2 and CH4 (methane) on 14C levels on the synthesized sample graphitic carbon. This study determined that for samples close to background levels, it was not possible to protect these samples from traces of atmospheric contamination during the periods when they are exposed to ambient conditions, even for relatively short time intervals. This contamination follows from the contrast between contemporary atmospheric 14C conditions being two to three orders of magnitude higher than the 14C contained in samples. Those who undertook this research concluded that “contamination on AMS sample targets by modern carbon is inevitable” (Paul et al. Reference Paul, Been, Aerts-Bijam and Meijer2016:407).
Someone might object that even if most infinite 14C age samples used for backgrounds have been graphitized, there are some infinite age samples which have not undergone a combustion/acidification and/or graphitization process and yet they exhibit finite 14C ages. One example of this would be 14C measurements on natural diamonds. Another would be the use of naturally formed geological graphite. What would reasonably explain the backgrounds measured in these samples? We now turn to instrument-based sources that are responsible for signals indicating the presence of 14C ions in the detector circuitry of an AMS system when various types of samples of assumed infinite 14C age which have not been subject to combustion/acidification and graphitization are being measured.
Instrument-Based Sources: The remaining four potential causes of pseudo-cosmogenetic 14C signals in AMS systems listed in Table 2 when measuring infinite age samples are instrument-based. The resultant backgrounds are typically collectively referred to as “machine backgrounds.” These types of backgrounds are the result of pulses recorded in the AMS system detector electronic circuitry which ordinarily indicates the presence of a 14C ion which has not been derived from the presence of 14C derived from an infinite age carbon sample converted to CO2, synthesized to graphic carbon, pressed into a sample holder which is then placed the ion source of an AMS instrument. The use of natural diamonds which have been placed into a sample holder with no pretreatment applied would be an example of such a sample.
The first potential source of machine background listed in Table 2 results from an instrument anomaly in which mass 14 ions are produced at some point within the beam line itself. In our view, the manner in which ion sources operate is the most likely component that would contribute the largest percentage of machine background. We have already noted that Figures 2 and 3 illustrate the close physical proximity of different samples in the component containing the samples in one ion source. The method widely used to ionize samples involves focusing cesium atoms onto the surface of the synthesized graphitic material. The resultant production of ions from a sample is widely scattered within all parts of the small cavity where the sample ions are extracted into a focused beam that exits the ion source. Design changes and the high vacuums maintained in the ion source significantly reduces the probability that 14C ions from a sample undergoing measurement will be contaminated by 14C ions which had been produced by a previously ionized sample. However, it will not totally eliminate them.
Modifications in the design of ion sources currently used in most AMS have responded to the need to minimize these “memory effects” or “sample crosstalk.” While 14C memory effects have been reduced to extremely low levels in the majority of ion sources, such sample crosstalk effects cannot be totally eliminated and a small numbers of 14C ions from previous samples can contribute to the 14C signal detected when subsequent samples are measured.
In the majority of finite age samples, that very low level of machine-produced contamination from memory effects is generally significantly below a level reflected in the variability introduced due to counting statistics. In any event, measured backgrounds are routinely employed to calculate net sample values. However, in a sample of infinite age which is assumed to contain no 14C, ion source memory effects can be responsible for producing sufficient amounts of 14C signal in the detector circuitry so that effects which cannot be distinguished from expected variations due to counting statistics for most samples become distinguishable when these background samples are measured.
EXAMPLES OF 14C BACKGROUNDS IN TWO AMS SYSTEMS MEASURING 14C
We have already noted that not all the potential sources of background levels of 14C listed in Table 2 would necessarily contribute to the backgrounds measured in every AMS system measuring 14C. The specific sources and magnitudes of 14C backgrounds are unique to each AMS system and may change over time in the same instrument. To illustrate the differences and similarities in these values in different laboratories, in Table 5 we summarize the results of mostly previously published experiments undertaken to define and quantify 14C background levels due to both sample-based and instrument-based sources in two laboratories. The first set of data comes from an AMS instrument was that operating in the Department of Physics at the University of Washington, Seattle, Washington, relatively early in the development of AMS-based 14C studies (Schmidt et al. Reference Schmidt, Balsley and Leach1987). The second AMS system is that described in Figure 1 and Table 2, that of the instrument at the University of California, Irvine. A portion of this data has already been reported (Taylor and Southon Reference Taylor and Southon2007) while four measurements were obtained in conjunction with the preparation of this paper and have not been previously reported.
Table 5 AMS-based instrument and sample background measurements at two AMS laboratories measuring 14C.

a Schmidt et al. (Reference Schmidt, Balsley and Leach1987: Table 1).
b Processed=sample converted to CO2 and graphitic carbon and placed in target holder. Unprocessed = sample itself placed in target holder.
c This report.
d Taylor and Southon Reference Taylor and Southon2007: Table 2.
e 14C measurements on six splits of the same diamond. Range in measured values reported.
f Range in measurement precision=±0.01 to ±0.02 pMC.
g Range in measurement precision = ±0.5 to ±0.8 ka yr BP.
Data such as this particularly illustrate that, in most cases, “unprocessed” infinite age samples, where the organic itself is measured without any conversion to synthesized graphitic carbon, generally exhibit “older” ages. In the case of the University of Washington instrument, we note that a measurement undertaken using only an aluminum target sample holder defines the unique “machine” background value for this instrument at the time the experiment was undertaken. The measurement of 14C signals obtained from silver packed into an aluminum target indicates for the UCI instrument a significantly different machine value obtained at the time this measurement was obtained. However, we note that diamonds used as the target material on this same instrument yielded much “older” results.
The significant variability in the inferred 14C “ages” assigned to infinite age materials on the basis of their measured 14C concentrations when those levels drop below about 0.1 pMC (percent modern carbon) is most reasonably interpreted as the result of the complex interactions of the many sample and instrument based contamination factors listed in Table 3. Obviously, an interpretation that these measurements indicate the presence of actual residual cosmogenic 14C cannot be totally excluded. However, given the many other much more likely factors that could be responsible for the 14C signals obtained on these infinite age samples, this interpretation would be, in our view, the least likely scientific explanation.
CONCLUSION
Those who dispute the validity of pre-Holocene 14C age determinations have offered their opinions concerning what they view as the implications of reports of various background levels observed by AMS laboratories undertaking 14C measurements. The typical ages of the organic samples used for these measurements are assumed, based on well-documented paleontological and/or geological criteria, to be greatly in excess of 100,000 years and most of these samples, such as natural diamonds, are much older than several hundred million years.
We have suggested that the cause of the confusion of these individuals is their lack of knowledge of the operating characteristics of the technology used in AMS systems as applied to the measurement of natural 14C concentrations. Specifically, these individuals misunderstand the experimental conditions and constraints that are present when AMS-based 14C measurements are obtained. Because of this, in our view, there is a misapprehension and thus misrepresentation on their part of the significance of the reported “ages” of 14C backgrounds reported by various AMS groups.
We have presented a list of 16 potential sources that could contribute to producing a background signal that would indicate or mimic the presence of a 14C ion in the detector circuitry of an AMS system. These 16 sources have been divided into two categories: sample-based and instrument-based. We have offered evidence regarding which of these categories are most likely to produce the majority of background values observed in an AMS instrument undertaking 14C measurements. Since different AMS systems make 14C measurements using somewhat different sample preparation protocols and instrumental configurations, we submit that it would not be appropriate to generalize for all currently routinely operating AMS instruments. We posit that various combinations of the sources of 14C detector signals indicating the presence of 14C ions in infinite age organics, as listed in Table 2, are responsible for the reported background values.
We conclude that the view advanced by those who insist that these backgrounds are the result of the presence of residual cosmogenic 14C contained in infinite 14C age samples constitutes the least probable explanation.
ACKNOWLEDGMENTS
We appreciate the very helpful comments of the editor and an anonymous reviewer. Some of the 14C measurements reported here were supported by the Gabriel R. Vierra Memorial Fund to RET.