


Introduction
Crop diversity at farm and regional levels in the USA has diminished markedly during the past 50 yearsReference Porter, Huggins, Perillo, Quiring and Crookston1, Reference Liebman, Ohno, Hatfield, Buhler and Stewart2, and monocultures and short rotation sequences are the prevalent cropping systems there and in many other developed countriesReference Brummer3, Reference Cook4. Simplification of cropping systems has been accompanied by greater reliance on synthetic pesticides and fertilizers, while conservation practices have sometimes been abandoned to increase productionReference Hartwig and Ammon5. Contamination of underground and surface water by nitrogen, herbicides and soil sediment is an on-going concern for agriculturalistsReference Barbash, Thelin, Kolpin and Gilliom6, Reference Liu, You, Amini, Obersteiner, Herrero, Zehnder and Yang7.
One of the major changes in US agriculture over the past two decades has been the wide-scale adoption of genetically engineered crops and associated management practices, creating ‘technology packages’. In 2011, 94% of US soybeans were genetically engineered for herbicide tolerance, principally glyphosate tolerance8. Similarly, in 2011, 72% of the US corn crop was genetically engineered with traits for herbicide tolerance, insect resistance, or both8. Concomitant with the introduction of traits for glyphosate tolerance has been a large increase in the use of glyphosate, making it the most heavily used agricultural pesticide in the USA9.
The rapid increase in the use of transgenic crops has taken place at the same time as there has been an effort among researchers and policy-makers to raise awareness of the environmental, social and economic consequences of intensive agriculture10, Reference Francis, Lieblein, Gliessman, Breland, Creamer, Harwood, Salomonsson, Helenius, Rickerl, Salvador, Wiedenhoeft, Simmons, Allen, Altieri, Flora and Poincelot11. This effort has led to attempts to improve agricultural sustainability through the design and management of agro-ecosystems that exploit ecological processes to maintain soil productivity, improve crop yield, and manage pest and weed populationsReference Liebman, Gallandt and Jackson12–Reference Shennan15. Some analysts of genetic engineering for crop production and protection have argued that it can improve agricultural sustainability and should be considered for use with other practices that are common to organic and low-external input (LEI) production systemsReference Ronald16, Reference Ronald and Adamchak17. Other analysts have raised concerns over the durability of genetic engineering approaches, noting the increasing prevalence of weed and insect pest resistance to genetically engineered corn and soybean genotypesReference Mortensen, Egan, Maxwell, Ryan and Smith18, Reference Gassmann, Petzold-Maxwell, Keweshan and Dunbar19.
LEI cropping systems are intended to reduce environmental, economical and social problems related to intensive pesticides and fertilizer applicationsReference Altieri20, Reference Liebman and Davis21. LEI cropping systems rely on manipulations of ecological processes, and the agricultural practices performed in these more diverse systems can lead to improvement in soil structureReference Raimbault and Vyn22, reduction in carbon and nitrogen lossesReference Drinkwater, Wagoner and Sarrantonio23, Reference Dinnes, Karlen, Jaynes, Kaspar, Hatfield, Colvin and Cambardella24, added organic matterReference Campbell and Zentner25, fixation of atmospheric nitrogen by legumesReference Riedell, Pikul, Jaradat and Schumacher26, reduction in the incidence and severity of crop diseasesReference Tilman, Cassman, Matson, Naylor and Polasky27, Reference Ghorbani, Wilcockson, Koocheki and Leifert28, reduction in weed densityReference Dyck and Liebman29, Reference Anderson30, increase in soil microbial biomassReference Bossio, Scow, Gunapala and Graham31, Reference Deng, Moore and Tabatabai32, and higher fossil-energy efficiencyReference Cruse, Liebman, Raman and Wiedenhoeft33. LEI systems use green and animal manures and other organic matter amendments as principal nutrient sources for crops, and to improve soil structure. Weed management, an important concern in LEI and organic systems, can be addressed through the application of small quantities of herbicides, cultivation, and other cropping practices, which expose weeds to multiple stress and mortality factorsReference Liebman, Gallandt and Jackson12.
Various studies have reported higher crop productivity and economic return in more diverse crop rotations than in simpler conventional systemsReference Archer, Jaradat, Johnson, Weyers, Gesch, Forcella and Kludze34, Reference Chavas, Posner and Hedtcke35, while other experiments indicated the contraryReference VanGessel, Froney, Conner, Sankula and Scott36. Previously, we reported the results of a multiyear cropping systems experiment established in Iowa to test the hypothesis that yield, weed suppression and profit characteristics of diversified cropping systems can match or exceed those of conventional systemsReference Liebman, Gibson, Sundberg, Heggenstaller, Westerman, Chase, Hartzler, Menalled, Davis and Dixon37. The experiment included a conventional 2-year corn–soybean rotation, and two more diverse rotations managed with low external inputs: a 3-year corn–soybean–small grain/red clover system, and a 4-year corn–soybean–small grain/alfalfa–alfalfa system. Over a 4-year period (2003–2006), net returns were highest for the 4-year rotation, lowest for the 3-year rotation, and intermediate for the 2-year system, with lower use of synthetic N fertilizer and herbicide in the more diverse rotationsReference Liebman, Gibson, Sundberg, Heggenstaller, Westerman, Chase, Hartzler, Menalled, Davis and Dixon37. Within that study, however, corn and soybean genotypes were not necessarily the same in the different rotation systems, i.e., rotation systems and management practices were confounded with crop genetic identity.
To address this issue, an experiment was initiated to determine whether effects of cropping system diversity on crop productivity were similar for management strategies that differ in the genotypes planted and the weed management programs implemented. We hypothesized that: (i) more diverse crop rotations can achieve similar or higher corn and soybean yields than a conventional, simpler rotation, regardless of the genotype planted and the herbicide and cultivation regime selected for weed management; and (ii) the total economic return of the more diverse rotations is similar or higher than the conventional, simpler rotation. There are several implications of having a similar increase in productivity though longer rotations, regardless of the genotype sown and weed management strategy implemented. First, it would enhance the flexibility of choosing the crop genotype to be planted according to the needs of each production unit, either for resistance to insects, diseases, or tolerance to certain herbicides. Second, it would reduce the inherent risk of depending on fixed external outputs and consequent price fluctuations. Third, the risk of developing herbicide resistance in weeds might be minimized by allowing the use of small quantities of herbicides with different active ingredients over time. And fourth, by favoring a more resilient agroecosystem, it might be possible to reduce the potential negative impacts of environmental and biotic factors on crop yield.
Materials and Methods
Experimental site
The experiment was conducted at Iowa State University's (ISU's) Marsden Farm, located in Boone County, Iowa. The site characteristics, management history, and agronomic performance of the crops from 2003 to 2008 are reported by Liebman et al.Reference Liebman, Gibson, Sundberg, Heggenstaller, Westerman, Chase, Hartzler, Menalled, Davis and Dixon37 and Cruse et al.Reference Cruse, Liebman, Raman and Wiedenhoeft33. Weather data were collected 1km from the study site.
In 2008–2010, the experiment was arranged as a split-plot design. Main plot size was 18m by 85m. Each crop within each rotation sequence was grown each year, constituting nine main plots in each of the four replicate blocks. The main plots corresponding to corn and soybean were split in halves and one of two sets of management strategies (‘GE’ or ‘non-GE’) was assigned to each subplot. For corn, the GE management strategy consisted of a genetically engineered hybrid plus the broadcast application of pre-emergence herbicides; the non-GE strategy consisted of a non-genetically engineered hybrid plus the application of post-emergence herbicides in a 38-cm band over the crop row. The GE corn was a stacked hybrid with genes to control both European corn borer, Ostrinia nubilalis Hübner, and corn rootworms, Diabrotica spp. For soybean, the GE strategy used a genetically engineered variety with resistance to the herbicide glyphosate plus the post-emergence broadcast application of that herbicide; the non-GE strategy consisted of a non-genetically engineered variety and the application of a mixture of post-emergence herbicides in a 38-cm-band over the crop row. The details of the corn hybrids and soybean varieties planted, and the pre- and post-emergence herbicides applied are provided in Tables 1 and 2.
Table 1. Hybrid or cultivar grown, planting and harvest date, seed density, seed mass and inter-row spacing used in contrasting crop rotations.
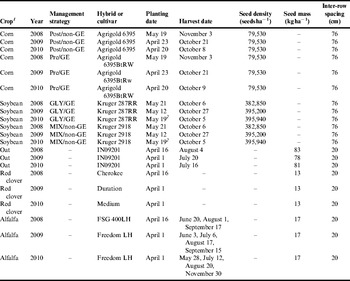
1 Corn and soybean were planted in all the rotation systems, oat was planted with either red clover in the 3-year rotation or with alfalfa in the 4-year rotation.
2 In 2010, soybean was planted on May 19 in blocks 1–3 and on May 25 in block 4.
Table 2. Weed management practices for each crop rotation from 2008 to 2010. Rate (kgha−1) of herbicide active ingredients shown in parentheses.

Crop management
Tillage operations varied among rotation systems. Fall chisel plowing occurred in all the rotations after corn harvest, to partially incorporate corn residue, and a shallow fall disking was performed after soybean harvest in the 3- and 4-year rotations to level the plots. Fall moldboard plowing was carried out in the 3-year rotation to incorporate the red clover and in the 4-year rotation to incorporate the second-year alfalfa. Spring cultivation was performed in all corn plots before planting in 2008–2010, and in soybean plots in 2009 and 2010.
Oat was planted with red clover in the 3-year rotation or with alfalfa in the 4-year rotation in the spring of each year. Oat straw was baled and removed after grain harvest, and red clover was used as a green manure. First-year alfalfa was harvested once in each seeding year and second-year alfalfa was harvested three times in 2008 and four times in 2009 and 2010. Crop hybrid or cultivar, planting and harvest dates, seed density, and row spacing are provided in Table 1.
Soil fertility management differed among rotations: we applied synthetic fertilizers in the 2-year rotation, whereas we used composted cattle manure and reduced rates of synthetic fertilizers in the 3- and 4-year rotations. Fertilizer rates were based on soil tests from each rotation. Soil samples (0–20cm depth) were collected each fall and submitted to the ISU Soil and Plant Analysis Laboratory to determine P and K requirements. Synthetic nitrogen was applied as urea to corn plots in the 2-year rotation before planting, and the late spring nitrate test was used to determine rates for post-emergence side-dress N applications in all corn plotsReference Jaynes, Dinnes, Meek, Karlen, Cambardella and Colvin38. In 2009 and 2010, no synthetic nitrogen was applied to corn plots in the 3- and 4-year rotations due to the presence of adequate amounts of nitrate in the soil, according to fertilizer recommendations for IowaReference Blackmer, Voss and Mallarino39. Composted cattle manure was applied to plots of red clover and alfalfa preceding corn in the 3- and 4-year rotations at a rate of 16.2Mgha−1 (fresh weight basis). Synthetic fertilizer rates and total calculated N, P, and K applied with the composted manure, following analyses conducted by the ISU Soil and Plant Analysis Laboratory, are shown in Table 3.
Table 3. Fertilization regimes for crops grown in contrasting crop rotations from 2008 to 2010.

1 TSP: triple super phosphate.
2 UAN: urea ammonium nitrate.
As noted previously, weed management differed among rotations and management strategies in corn and soybean plots (Table 2). Banded herbicides were supplemented with inter-row cultivation for weed control in the non-GE corn and soybean subplots. This cultivation occurred once in corn and twice in soybean in 2008, and two times in corn and soybean in 2009 and 2010. Oat stubble in the 3- and 4-year rotations was mowed 28–35 days after grain harvest to control weeds (Table 2). No explicit weed control was performed in established alfalfa plots.
To control soybean aphid (Aphis glycines Matsumura), we applied the insecticides lambda-cyhalothrin (0.027kga.i.ha−1) on August 13, 2008 and chlorpyrifos (0.531kga.i.ha−1) on August 14, 2009 to all soybean plots; no insecticide was applied in 2010.
Yield determination and data analysis
Six rows (382m2) of each corn and soybean subplot were harvested using a combine and grain yield was measured in a weigh wagon. Corn weight was adjusted to reflect a moisture concentration of 155gkg−1, whereas soybean weight was adjusted to a moisture concentration of 130gkg−1. Oat grain was harvested from entire plots (1530m2) using a combine, and the weight was adjusted to a moisture concentration of 140gkg−1. Alfalfa and oat straw were clipped and baled from entire plots, and the weight of the bales was determined and adjusted to a moisture concentration of 150gkg−1 and 100gkg−1, respectively.
Yield of each crop was analyzed separately. Analyses of variance (ANOVAs) of corn and soybean yields were performed using the MIXED procedure of SAS, specified for analysis of a split-plot experiment repeated over 3 yearsReference Littell, Stroup and Freund40. Rotation and management strategy were considered fixed factors, and replication and year as random factors. Orthogonal contrasts were used to analyze corn and soybean yield of: (i) the 2-year rotation versus the average of the 3- and 4-year rotations (simple versus more diverse systems); and (ii) the 3-year rotation versus the 4-year rotation (comparison between diverse rotations). Oat yield was analyzed using the GLM procedure of SAS, with rotation as a fixed factor and replication and year as random factors. Alfalfa yield over the 3 years was analyzed using the GLM procedure.
Weed biomass sampling and data analysis
In corn plots, above-ground weed biomass in eight 3.05×0.76m areas per sub-plot was clipped on September 30, 2008, September 23, 2009 and September 14, 2010, and then dried and weighed. The same methodology was used to determine weed biomass in soybean sub-plots on October 2, 2008, September 24, 2009 and September 30, 2010. In oat stubble with red clover, oat stubble with alfalfa, and second year alfalfa plots, weed biomass was collected, and then dried and weighed, from eight 0.25m2 randomly placed quadrats per plot on October 10, 2008, October 6, 2009 and October 15, 2010. Weed biomass values were transformed (ln [x+1]) to meet the ANOVA requirement for normal distribution. The same ANOVA and orthogonal contrasts performed in the crop yield analyses were used to test for differences in weed biomass, within the same crop, among years, rotations and management strategies.
Economic analysis
Labor requirements, costs and returns for the different rotation system and management strategy combinations were assessed using data from various sources. Labor times for machinery operations were based on values presented by HannaReference Hanna41 and costs for labor and machinery wear and maintenance were assigned based on reports by DuffyReference Duffy42–Reference Duffy44. Costs for fertilizer, seed, pesticides, interest on loans, crop insurance and miscellaneous items were estimated using data from DuffyReference Duffy42–Reference Duffy44 and local agricultural dealers. We considered an integrated low-external-cropping system representative of the region, where the crops are fed to livestock and cattle manure is applied to the crop fields. Manure was assumed to be generated by on-farm livestock and therefore free, but the costs of spreading it, i.e., labor and machinery, were calculated using data from HannaReference Hanna41 and DuffyReference Duffy42–Reference Duffy44. Iowa market year crop prices were obtained from the USDA National Agricultural Statistics Service 45.
We placed primary emphasis on determining the economic performance characteristics of the whole rotation systems under contrasting management strategies, rather than the economic performance of individual crop phases within the different rotations. Consequently, we evaluated gross revenue and net returns to land and management on a unit land area basis, with land units divided into two equal portions for corn and soybean in the 2-year rotation; three equal portions for corn, soybean, and oat with red clover in the 3-year rotation; and four equal portions for corn, soybean, oat with alfalfa, and alfalfa in the 4-year rotation. Net returns to land and management represented returns to a farm operation calculated without accounting for costs of land (e.g., rent or mortgage payments) or management time (e.g., marketing). Split-plot ANOVAs were conducted to examine variation in gross revenue and net returns, using year and block as random factors and rotation system (main plot) and management strategy (sub-plot) as fixed factors. Orthogonal contrasts were conducted to examine rotation effects, as described above for corn and soybean yield analyses. Treatment interactions with year were significant for both gross revenue and net returns, causing us to analyze results separately by year. However, we also evaluated these response variables averaged over the period of 2008–2010, as a means of examining economic performance over a longer time frame. For simplicity in presentation, we evaluated mean costs for each rotation system and management strategy combination by category averaged over the period of 2008–2010.
Results
Weather conditions
Air temperature did not differ from the long-term mean in any of the 3 years (Table 4). Precipitation fluctuation in 2008 and 2010 was significant. May, June and July 2008 were very wet months (Table 4), some plots were occasionally flooded for 2–3 days during those months. Very wet conditions also occurred in June and August of 2010 (Table 4).
Table 4. Mean monthly air temperature and precipitation determined 1km from the study site in Boone, IA.

1 Long-term mean for 1951–2010.
Nitrogen fertilizer and herbicide use
The quantity of synthetic nitrogen applied in the corn phase of the 3- and 4-year rotations was five times lower than in the corn phase of the conventional 2-year rotation (Table 5). Likewise, the overall synthetic nitrogen used in the 3- and 4-year rotations was 88 and 91% lower than in the 2-year rotation, respectively (Table 5). There were no differences in nitrogen use among management strategies.
Table 5. Mean herbicide and synthetic nitrogen fertilizer use over 2008–2010 in the three crop rotations.

Herbicide use was lower in the non-GE strategy than in the GE strategy in all the rotations due to banded applications (Table 5). Similarly, less herbicide was applied in the longest, most diverse rotation (Table 5) because weed control was done mechanically in the oat+alfalfa and alfalfa phases.
Crop yields
Corn
The main effect of year was not significant (P=0.2743), and no interactions were detected among years, rotations or management strategies. In 2008, standing water in one plot corresponding to the 3-year rotation with the GE management strategy caused a reduction in plant density and therefore a reduction in corn yield. This particular value was considered an outlier in the dataset after testing the normality of the distribution. We then performed an ANOVA and orthogonal contrasts with and without the outlying observation, and with the data transformed (logex) and untransformed. The outlier made the rotation main effect in the ANOVA not significant, whether or not the data were transformed. However, this value was not removed from the dataset because the significant rotation main effect remained evident through orthogonal contrasts (Table 6).
Table 6. Mean corn yield over the years 2008–2010.

Corn yield was highest in the 4-year rotation (mean=12.79Mgha−1), lowest in the 2-year rotation (mean=12.16Mgha−1) and intermediate in the 3-year rotation (mean=12.51Mgha−1) (Table 6). There were significant differences in corn yield between the conventional 2-year rotation and the more diverse 3- and 4-year rotations, but no differences were detected between the 3- and 4-year systems (Table 6). We also detected higher corn yield in the GE management strategy (mean=12.63Mgha−1) compared with the non-GE management strategy (mean=12.33Mgha−1), in all the rotations (Table 6), although this difference was small.
Soybean
Soybean yield was affected by a significant three-way interaction among year, rotation and management strategy (P=0.0022), therefore, soybean yield was analyzed separately by year. Orthogonal contrasts highlighted the higher soybean yield in the longer rotations versus the conventional corn–soybean rotation in 2009 and 2010 (Table 7).
Table 7. Soybean yield from 2008 to 2010 involving three rotations and two management strategies.

The ANOVA for each year detected significant differences in soybean yield between management strategies in 2009 and 2010 (Table 7). These differences could be the result of abiotic and biotic factors affecting the soybean plants in those years. In 2009, we observed severe temporary defoliation in the non-GE subplots sprayed with lactofen, but no precise quantification was made on each plot. In 2010, low soil temperatures at planting and high soil moisture during the summer favored the attack of the soil-borne pathogen Fusarium virguliforme Aoki & T. Aoki, which caused the disease known as sudden death syndrome (SDS). In the 2-year rotation, this attack affected 96% of the soybean plants in the non-GE management strategy and 27% of the soybean plants in the GE strategyReference Leandro, Robertson, Mueller, Liebman and Yang46. In contrast, in the 3- and 4-year rotations, fewer than 9% of the soybean plants of either management strategy were affected by SDSReference Leandro, Robertson, Mueller, Liebman and Yang46.
Oat and alfalfa
Oat grain yield was similar between rotations (P=0.1018) and between years 2008 and 2010, but higher in 2009 (P=0.0250) (Table 8). Alfalfa hay yield differed among years (P<0.0001): it was highest in 2010 (12.12Mgha−1), lowest in 2009 (5.48Mgha−1), and intermediate in 2008 (9.96Mgha−1) (Table 8). The differences in alfalfa yield among years could be attributed to extreme environmental conditions, such as flooding in spring of 2008 and summer of 2009.
Table 8. Oat grain and alfalfa hay yield from 2008 to 2010.

1 Mean yield of harvested oat straw in the 3-year rotation was 2.82, 2.81 and 1.86Mgha−1 in 2008, 2009 and 2010, respectively, and 2.59, 2.67 and 1.74Mgha−1 in the 4-year rotation.
2 Alfalfa hay yield for second-year stands. Mean first-year alfalfa hay yield was 1.03, 1.21 and 1.13Mgha−1 in 2008, 2009 and 2010, respectively.
Weed biomass
Overall, weed biomass in all the corn and soybean plots was very low (Table 9). Because of the few weeds present and their patchy distribution, the data were not normally distributed and the variability was high. This situation is common in agricultural fields with low weed densityReference Rew, Whelani and Mc Bratney47. The dominant weeds were Taraxacum officinale F.H. Wigg. aggr., Setaria faberi R.A.W. Herrm., Amaranthus rudis J.D. Sauer, Abutilon theophrasti Medik. and Chenopodium album L. The triple interaction of year, rotation and management strategy was significant for weed biomass in corn plots (P=0.0079), therefore weed biomass was analyzed by year. Weed biomass in corn was greater in the 4-year rotation with the non-GE management strategy in 2008, and in the 2-year rotation with the GE strategy in 2010. Higher weed biomass was detected in the non-GE than GE corn subplots in 2009 (Table 9). In soybean plots, no differences in weed biomass were evident among rotations or between management strategies (Table 9). Weed biomass in oat intercropped with a legume was affected by the interaction between year and rotation (P=0.0289). Weed biomass in oat did not differ between rotations in 2008 and 2010, but was lower in the 3-year rotation in 2009 (Table 9).
Table 9. Weed biomass in crop rotations involving two management strategies from 2008–2010. Transformed (ln [x+1]) means are in parentheses.

1 Transformed (ln[x+1]) standard error of the mean.
Economic analysis
In 2008, gross revenue was higher in the 2-year rotation ($1623ha−1yr−1) than in the 3-year ($1472ha−1yr−1) and 4-year ($1526ha−1yr−1) rotations, but was unaffected by management strategy (Fig. 1A; Table 10). Similarly, in 2009, gross revenue was higher in the 2-year rotation ($1474ha−1yr−1) than in the 3-year ($1284ha−1yr−1) and 4-year ($1210ha−1yr−1) rotations, but it was also greater with the GE ($1353ha−1yr−1) than the non-GE ($1292ha−1yr−1) management strategy (Fig. 1B; Table 10). In 2010, gross revenue was affected by an interaction between rotation system and management strategy such that gross revenue was greatest in the 2-year rotation managed with the GE strategy ($1806ha−1yr−1), least in the 2-year rotation managed with the non-GE strategy ($1466ha−1yr−1) and intermediate in the other rotation and management combinations (Fig. 1C; Table 10). Average gross revenue for the period of 2008–2010 was greatest for the 2-year rotation managed with the GE strategy ($1662ha−1yr−1), least for the 3-year rotation managed with the non-GE strategy ($1422ha−1yr−1), and intermediate for the other rotation and management combinations (Fig. 1D; Table 10).

Figure 1. Annual and mean gross revenue and net returns of crop management strategies in each rotation system.
Table 10. ANOVA of economic returns.

Two general patterns were evident for total production costs (Fig. 2). First, total production costs were highest for the 2-year rotation (mean=$780ha−1yr−1), least for the 3-year rotation (mean=$511ha−1yr−1) and intermediate for the 4-year rotation (mean=$620ha−1yr−1). Second, the GE management strategy was slightly more costly than the non-GE strategy in each rotation (mean difference=$44ha−1yr−1). With regard to cost categories, higher synthetic fertilizer costs were incurred by the 2-year rotation ($278ha−1yr−1) than in the 3-year ($57ha−1yr−1) and 4-year ($142ha−1yr−1) rotations. Higher quantities of synthetic nitrogen in the 2-year rotation, and lower quantities of P and K applied in the 3-year rotation explain these differences (Table 3). Seed costs were higher with the GE (mean=$162ha−1yr−1) than the non-GE (mean=$114ha−1yr−1) strategies. Pre-harvest machinery and operations costs differed little among rotations, but greater harvest expenses were incurred in the 4-year rotation (mean=$164ha−1yr−1) than the 3-year (mean=$125ha−1yr−1) and 2-year (mean=$122ha−1yr−1) systems due to harvest of alfalfa. Expenses for pesticides decreased with rotation length and increased with the use of the GE management strategy. Conversely, labor costs increased with rotation length, reflecting added work in plowing legume sod and spreading manure before planting corn, but decreased with the use of the GE management strategy, reflecting the absence of inter-row cultivation in corn and soybean with the GE strategy. Labor costs were, however, relatively small (<6.5%) in all rotation×management combinations. Insurance and miscellaneous expenses were lower in the more diverse rotation systems than in the conventional 2-year system.

Figure 2. Production costs of crop management strategies in each rotation system.
Despite differences among rotation systems and management strategies in gross returns and production costs, net returns to land and management were unaffected by rotation and management in 2008 (Fig. 1A; Table 10). However, in 2009, net returns were higher in the 2-year (mean=$819ha−1yr−1) and 3-year (mean=$818ha−1yr−1) rotations than in the 4-year (mean=$739ha−1yr−1) rotation, though they remained unaffected by management strategy (Fig. 1B; Table 10). In 2010, net returns were affected by a strong interaction between rotation system and management strategy (Fig. 1C; Table 10). Net returns in 2010 were greatest in the 3-year rotation and did not differ within that system between non-GE ($937ha−1yr−1) and GE strategies ($891ha−1yr−1). The 4-year rotation provided lower net returns than did the 3-year rotation in 2010 and there was no difference between the non-GE ($743ha−1yr−1) and GE ($728ha−1yr−1) management strategies. A significant difference was detected in 2010 between management strategies for the 2-year rotation, with lower net returns generated by the non-GE system ($442ha−1yr−1) than the GE strategy ($692ha−1yr−1). Average net returns for the period of 2008–2010 were greatest in the 3-year rotation regardless of whether it was managed with the non-GE ($937ha−1yr−1) or GE strategy ($928ha−1yr−1) (Fig. 1D; Table 10). The other rotation systems produced significantly lower net returns with significant differences between management strategies evident in both the 4-year rotation (non-GE: $847ha−1yr−1; GE: $823ha−1yr−1) and the 2-year rotation (non-GE: $738ha−1yr−1; GE: $831ha−1yr−1) (Fig. 1D: Table 10).
Discussion
This study and previous publicationsReference Cruse, Liebman, Raman and Wiedenhoeft33, Reference Liebman, Gibson, Sundberg, Heggenstaller, Westerman, Chase, Hartzler, Menalled, Davis and Dixon37 have been consistent in showing higher productivity of corn and soybean in rotations that are more diverse than the conventional corn–soybean system that is prevalent in the US Midwest, despite the lower use of synthetic fertilizer and herbicides. In the present study, composted manure and legume residues provided sufficient quantities of nitrogen so that no synthetic fertilizer was applied to the 3- and 4-year rotations in 2009 and 2010. The N made available from legume residues and composted manure in more diverse rotations is likely to be released more slowly than N provided by commercial fertilizers and may therefore be less susceptible to leaching into subsurface drainage lines that discharge into streams and lakesReference Dinnes, Karlen, Jaynes, Kaspar, Hatfield, Colvin and Cambardella24. This represents an important potential advantage at a time when reducing water contamination by nitrate comprises an important goal for the design of sustainable agricultural systems10. In the present study, the net economic returns from the more diverse rotation systems were high or higher than the conventional 2-year rotation, even when the labor requirement was higher in the more diverse systems. Higher economic return in the 3-year rotation than the 4-year rotation was due to the application of lower quantities of P and K in the 3-year rotation. The alfalfa hay harvested from plots of the 4-year rotation removed P and K that was not offset sufficiently by manure application, while the red clover was not removed but incorporated into the soil in the 3-year rotation.
We also found that in the more diversified 3- and 4-year rotation systems it was possible to implement management strategies that differ in crop genotypes and weed management activities, including the herbicides applied, without altering substantially the net economic returns of the cropping system. In the conventional 2-year rotation system, in contrast, choice of management strategy strongly affected net returns. It is important to note that these two management strategies do not constitute an extensive comparison between genetically engineered and conventional crop performance, but rather an evaluation of two specific sets of management tactics in which particular genotypes were coupled with chemical and/or physical weed control practices.
More diverse cropping systems that include crops with different botanical characteristics and the addition of organic matter increase microbial biomass and enhance the functional diversity of microbial communities that affect multiple processes within the soil, limiting the impact of some crop pathogensReference Ghorbani, Wilcockson, Koocheki and Leifert28, Reference Weller, Raaijmakers and Tomashow48 and potentially making the system more resilient. As an example, in the present work, we observed in 2010 a severe outbreak of SDS of soybean, in the 2-year rotation. The appearance of this disease was widespread in soybean fields in Iowa in 2010 and favored by certain weather and soil conditionsReference Leandro, Robertson, Mueller, Liebman and Yang46. In the soybean plants of the 3- and 4-year rotations, however, SDS incidence was much lower and similar between management strategies, suggesting a rotation effect that operates similarly regardless of the crop genotype plantedReference Leandro, Robertson, Mueller, Liebman and Yang46. In a similar cropping systems experiment, Porter et al.Reference Porter, Huggins, Perillo, Quiring and Crookston1 suggested an association between higher disease incidence observed in a 2-year corn–soybean rotation with lower soybean yield, compared to a 4-year corn–soybean–oat/alfalfa–alfalfa rotation, although they did not identify the diseases affecting soybean plants or quantify disease incidence or severity.
Having similar economic return regardless of the management strategy implemented gives the farmer higher flexibility when choosing the corn and soybean genotype to be planted and the herbicides to be applied, and decreases the risk associated with depending on a specific management strategy over time. Similarly, the N supplied by composted manure and legumes made the more diverse rotation systems less reliant on synthetic N, and therefore less affected by the variability in fertilizer prices.
Oat productivity in the 3- and 4-year rotations and alfalfa productivity in the 4-year rotation had important impacts on the rotation total economic return. Oat grain and alfalfa hay yields varied significantly among years, and both were less profitable than corn or soybean (data not shown). In order to maintain high rotation economic return, it is important to maximize the productivity of oat and alfalfa. Although weed biomass was low in both crops, when cold weather conditions reduced the alfalfa stand in 2009, weed seedlings emerged and colonized empty spaces, affecting crop growth. Weed biomass was significantly higher in 2009 because of the successful colonization of T. officinale in certain areas of the plots where the alfalfa plants were damaged. Nonetheless, weed management was generally successful in both conventional and more diverse systems, and in both management strategies. The implications of these results are that farmers who plant non-genetically engineered genotypes in more diverse cropping systems may achieve the same weed control as with genetically engineered crops, and would be less likely to depend on a single herbicide as the control method, thereby reducing the risk of selection for herbicide resistant weeds.
We conclude that diversified cropping systems can be as profitable as simpler, conventional systems, require less synthetic nitrogen and herbicide use, give greater crop management flexibility to farmers, and can be more resilient to biotic factors that affect crop performance. We acknowledge, however, that broad-scale shifts to diversified systems from the conventional corn–soybean system will favor changes in crop prices, due to changes in supply, which may create economic forces that countervail diversification. Policy and economic incentives that encourage cropping system diversification as a means of reducing agrichemical use, retarding the evolution of herbicide resistance in weeds, and improving environmental quality will likely be required to promote substantial change on a landscape level.
Acknowledgements
We thank L. Leandro for assistance with field evaluation of SDS of soybeans, B. Hartzler and S. Goggi for their comments and suggestions on the manuscript, and J. Anderson, B. Beelner, M. Cruse, M. Fiscus, B. North and A. Phillips for assistance with field operations. Funding for this study was provided by the USDA National Research Initiative (Project 2006-35320-16548) and the Leopold Center for Sustainable Agriculture (Projects 2007-E09 and E-2010-02).


