


Introduction
In the late nineteenth and early twentieth centuries, construction of the first stations began in Antarctica. This process accelerated during the International Geophysical Year (1957/1958), and since then it is believed (Tin et al. Reference Tin, Fleming, Hughes, Ainley, Convey and Moreno2009) that the intensity and scale of human activity in Antarctica have continued to grow. Quantitative assessments of trends of the levels of anthropogenic impacts on the environment due to the operation of Antarctic stations are valuable. In an article by Kakareka & Salivonchyk (Reference Kakareka2020), the results of air impact modelling for Vecherny Oasis (eastern part of the Thala Hills) for the period from 1985 to 2015 were presented. Levels of surface air concentrations and atmospheric depositions were estimated. The current article continues the development of the previously described approaches for a larger area, over a longer period and with greater temporal resolution.
The purpose of this research is to assess trends in the impacts of emission sources at Antarctic research stations on the atmospheric air pollution in Antarctica using the example of Thala Hills (Enderby Land) over the period of human activities (from 1963 to 2018).
Study area
The study area is the Thala Hills, located in the western part of Enderby Land (Fig. 1). This area was identified from the air by the Australian Antarctic Program in 1956. It is a chain of ice-free hills, ~20 km long and 2–5 km wide (AADC 2021), which includes two oases, later named Molodezhny and Vecherny. At present, there are two seasonal stations operating here: Molodezhnaya Field Base of the Russian Antarctic Expedition (RAE) and Mount Vechernyaya Station of the Belarusian Antarctic Expedition (BAE).
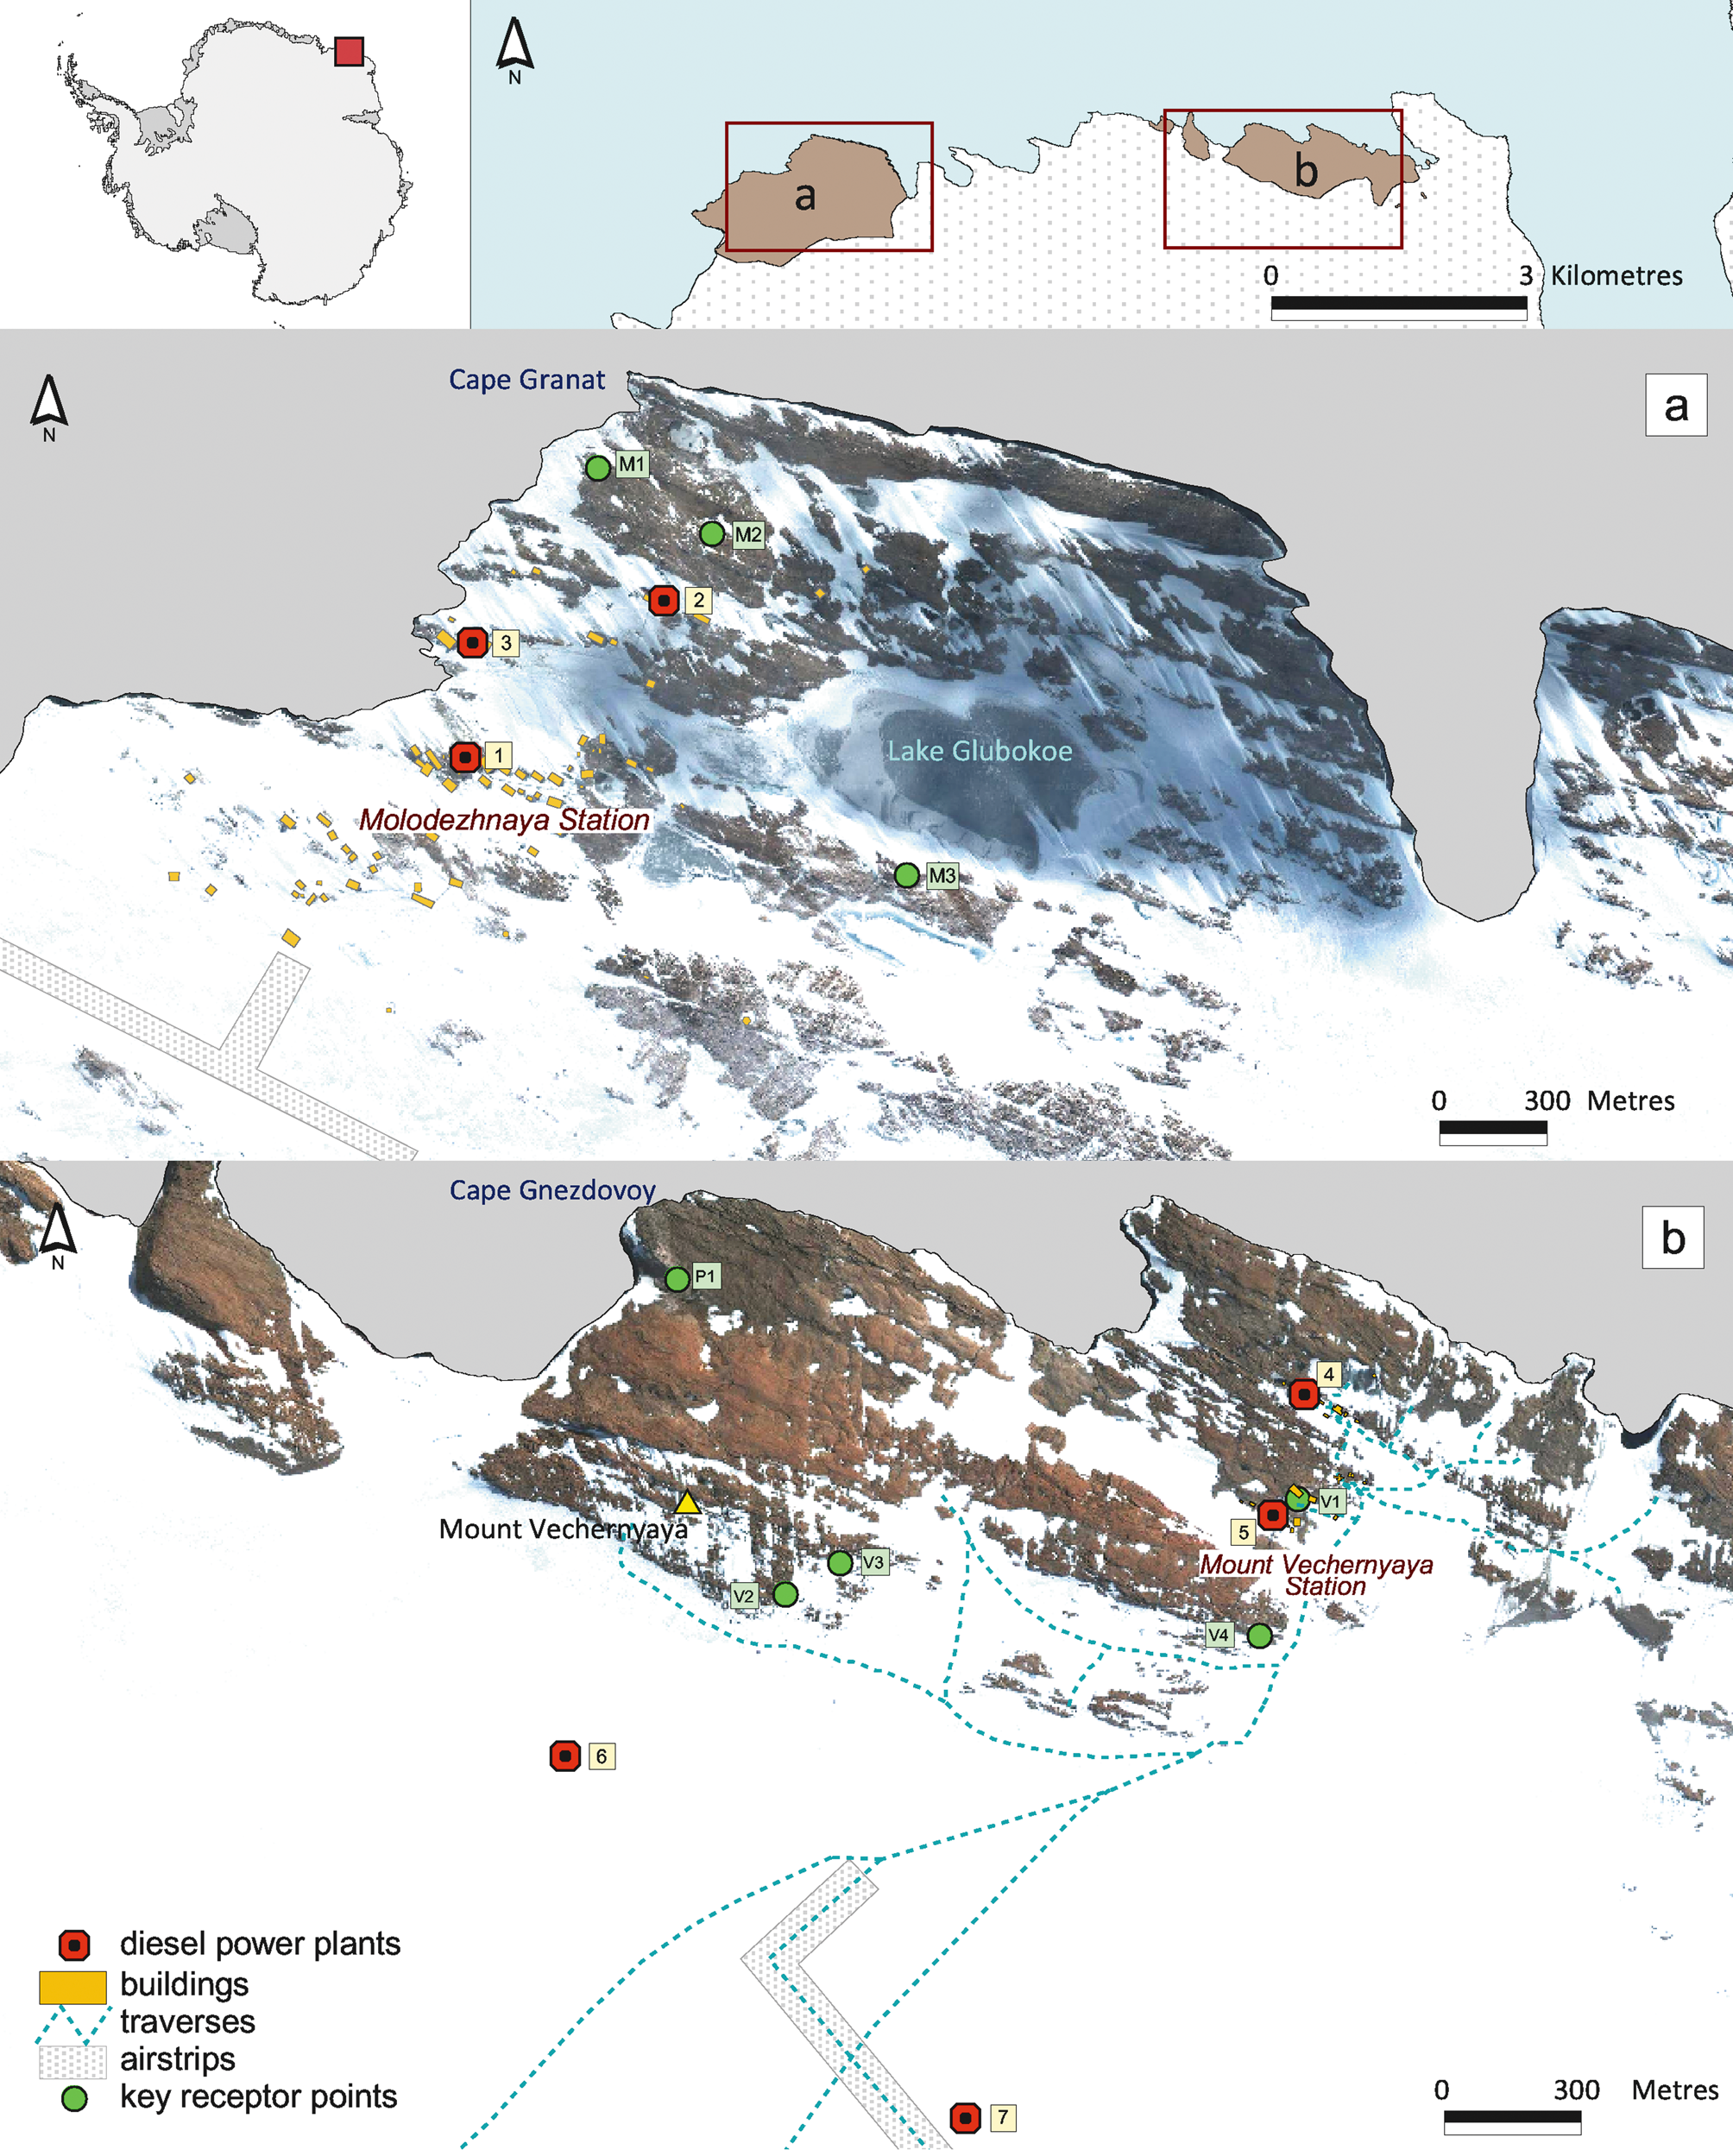
A small seasonal Molodezhnaya Station was opened by the 7th Soviet Antarctic Expedition (SAE) on 23 February 1962, when the foundations for a diesel power plant and a residential building were laid. During the 8th SAE in January 1963, construction of the permanent Molodezhnaya Station began. By the end of February 1963, construction of the station's main stationary facilities was completed, although station expansion continued until the early 1990s (Savatyugin & Preobrazhenskaya Reference Savatyugin and Preobrazhenskaya1999).
For > 30 years, Molodezhnaya has served as the main base of the SAE in Antarctica. The number of station buildings reached 70, and the number of winterers reached 174 people; the capacity of the installed diesel generators was > 4000 kW. Several dozen different road and off-road vehicles were exploited (Savatyugin & Preobrazhenskaya Reference Savatyugin and Preobrazhenskaya2000). However, in 1998, the station was transformed into a seasonal field base, and its gradual conservation and dismantling began. In subsequent years, a small expeditionary complex (five buildings) has been maintained on the territory of the Molodezhnaya Station, in which up to 10 people live in the summer season.
Field base Mount Vechernyaya was built in the Vecherny oasis in the late 1970s to serve the airfield for the heavy aircraft IL-76TD and IL-18D. In 1985–1987, the airfield squad numbered up to 23 people. The base functioned for > 10 years in a year-round autonomous mode, and then in a seasonal mode until 1995. By the mid-1980s, there were 13 buildings and structures on the base (Savatyugin & Preobrazhenskaya Reference Savatyugin and Preobrazhenskaya1999, Reference Savatyugin and Preobrazhenskaya2000). After the termination of transcontinental flights, the base was mothballed and most of the facilities were dismantled.
In December 2007, the BAE began its operations in the summer season at Mount Vechernyaya field base. After conducting the necessary procedures in accordance with the Protocol on Environmental Protection to the Antarctic Treaty in 2015, the construction of a permanent Belarusian Antarctic station began, and in the next few years 11 residential and service modules and infrastructure facilities of the station's first stage were put into operation (NASB 2015). The seasonal staff at the Belarusian Antarctic station number from 3 to 10 people.
Methods and data
General methodology for calculating pollutant emissions
The main sources of emissions in the Thala Hills oases are diesel generator sets, which provide energy to the stations and consume the bulk of the fuel. Other minor stationary sources of emissions, such as stoves and waste incineration installations, made a significantly smaller contribution to total emissions and are not taken into account in this study. The contributions of mobile sources to total emissions are not estimated due to a lack of data.
The emission estimation methodology used in this paper is traditional and based on the application of fuel combustion volumes and pollutant emission factors per unit of combusted fuel. The main difficulty is the assessment of fuel consumption with the necessary time resolution, because such data are fragmentary. In this paper, fuel consumption values were derived from the capacities of diesel generators and corresponding specific fuel consumption per unit of capacity at different loads; more details about this approach can be find in Kakareka (Reference Kakareka2020).
Information on the power of the diesel generators used in the Molodezhny and Vecherny oases was collected, and vectors of the use of diesel generators for a 56 year time interval from 1963 to 2018 were constructed. To obtain information on diesel generators in oases, reports of the RAE and BAE (ATCM40 2017, RAE 2021), as well as other publications (Savatyugin & Preobrazhenskaya Reference Savatyugin and Preobrazhenskaya1999, Reference Savatyugin and Preobrazhenskaya2000, Savatyugin Reference Savatyugin2001, Reference Savatyugin2009, NASB 2015, etc.), were used.
It was found that at the Molodezhnaya Station power plants, the locations of which changed during station operation, from 3 to 10 or more diesel generators were installed. The first power plant (three diesel generators with a total capacity of 92 kW) was built in 1963. In 1969, an automatic diesel electric station (ADES) with four AS-808 diesel generators (320 kW each) was installed. In 1989–1990, a new ADES in another place equipped with four KAS (500 kW) and two KAS (300 kW) diesel generators was built. For more efficient use of fuel, in 1996, two less powerful diesel generators (315 kW each) instead of two KAS-500 units were installed in this diesel power plant. In 1997–1999, a small diesel power plant with three diesel generators of 75 kW each was built.
Information about the diesel generators used at the Vechernyaya RAE field base is much more scarce. In Savatyugin (Reference Savatyugin2001), it is mentioned that three diesel generators (one DES-100 and two DES-75) in beams (lightweight transportable houses) were operated here in the 1980s. In 2007, on the territory of the field base, two diesel generators - AD-20 and AD-60 (16 and 48 kW) - as well as two small backup diesel generators were installed by BAE. According to ATCM40 (2017), at Mount Vechernyaya Station two container diesel power plants equipped with DEUTZ engines with capacities of 20 and 60 kW are currently operated, as well as two reserve power generators with capacities of 6 and 7 kW.
Emission source parameters
In the calculations, passport data on the parameters of the installed diesel generators were used; if passport data were not available, parameters of diesel generators with similar capacities were used. The main parameters of the diesel generators included in the calculation are shown in Table I.
Table I. Characteristics of diesel generator sets used in the Thala Hills oases.

a The rate of SO2 emissions in the period up to 1968 and from 1969 to 1983.
b The rate of SO2 emissions in the period from 1984 to 2014 and after 2014.
c The rate of SO2 emissions in the period up to 1983 and from 1984 to 2014.
PM10 = inhalable particulate matter with a diameter of ≤ 10 μm.
To verify the calculations of emissions based on the capacity of diesel generators and their load, the available data on fuel consumption at stations were used. Thus, according to Savatyugin & Preobrazhenskaya (Reference Savatyugin and Preobrazhenskaya1999, 2000), consumption of diesel fuel at Molodezhnaya Station was 800 t in 1969 and 1146.5 t in 1995. At Mount Vechernyaya Station, seasonal fuel consumption by diesel generators during the period from 2015 to 2017 amounted to 2–4 t per season (NASB 2015, ATCM40 2017).
Assessment of intra-annual load variability of diesel generator loads
For most of the period, Molodezhnaya Station was occupied year-round. To clarify the periods of operation of the Belarusian seasonal field base and subsequently the seasonal Belarusian Antarctic station at Mount Vechernyaya, as well as the Molodezhnaya field base, the data of the RAE and BAE reports were used. Time series of the operation of power plants with a sufficiently high completeness were reconstructed. They were used for the calculation of emission time series in the form of load vectors (monthly and daily).
Emission factors
Emissions of the following pollutants were estimated: NO2, SO2, inhalable particulate matter with a diameter of ≤ 10 μm (PM10) and CO. Emission factors from national guidelines (MNR RF 2001, GOST R 56163-2019 2019) (Table II) were used; international guidelines were also taken into account (AP-42 1996, EMEP/EEA 2019).
Table II. Emission factors for stationary diesel generators (MNR RF 2001, GOST R 56163-2019 2019) in g/kg fuel.

NOx = nitrogen oxides; PM10 = inhalable particulate matter with a diameter of ≤ 10 μm.
Due to the fact that the calculation of emissions covers a period lasting for > 50 years, it is advisable to take into account changes in emission factors over time. However, this is difficult to implement because emission guidelines do not provide such an opportunity. However, changes in specific sulphur emissions cannot be ignored. Therefore, changes in SO2 emission factors were determined based on the standards of sulphur content in diesel fuel in accordance with current and previous fuel quality standards for Diesel Winter and Diesel Arctic fuels. The following trend of sulphur content in diesel fuel was adopted: before 1969: 1%; 1969–1983: 0.5%; 1984–2014: 0.2%; after 2014: 0.035%.
Emissions dispersion modelling
Dispersion of pollutants from diesel generators was estimated using the United States Environmental Protection Agency (US EPA) AERMOD Gaussian model (US EPA 2004). Each generator was considered as a point source of emissions, for which coordinates and physical and emission specifications were described. Meteorological data series and characteristics of the underlying surface were set as in Kakareka & Salivonchyk (Reference Kakareka2020).
The intra-annual dynamics of pollutant emissions from diesel generators were taken into account by setting emission levels as fractions of the standard, and these were described for each source by month of the year. These factors were derived from previously calculated distributions of generator monthly emissions.
For terrain data, the Reference Antarctic Elevation Model (REMA) was used (Howat et al. Reference Howat, Porter, Smith, Noh and Morin2019). For the study area of 25 × 14 km, an ASCII file of a digital terrain model in the United States Geological Survey (USGS) DEM format from several original GEOTIFF sheets was obtained by transformation. The heights for all elements of the receptor network and diesel electric station locations were derived from it.
Modelling was carried out for a territory spanning 23.5 × 10.5 km using a receptor grid constructed with a 100 m step size (25,016 points). The penguin colony on Cape Gnezdovoy and a few lichen and moss ecosystems closest to the emission sources were selected as the key receptor points (Table III). In addition, for correlation with literature data, concentrations of pollutants at points located ~200 m and 1 km away from diesel generator installation sites on the windward side were estimated, taking into account the prevailing wind direction.
Table III. Description of key receptor points for pollutant dispersion modelling.

The maximum hourly, daily and monthly concentrations of SO2, NO2 and PM10 in the surface air and the monthly and annual dry depositions of PM10 were calculated, setting the background pollutant concentrations to zero.
In comparison with the previously performed calculations from the 1980s published in Kakareka & Salivonchyk (Reference Kakareka2020), 1) characteristics of the relief of the studied area were refined, 2) a receptor grid of greater coverage and of lower resolution was used and 3) time series of the emissions using data on annual fuel consumption for separate years and information on the specificity of use of various diesel generators over different periods were refined.
Results
Dynamics of annual emissions in the Thala Hills oases
The dynamics of annual emissions in the Thala Hills oases are shown in Fig. 2. The values of pollutant emissions in some periods differed by multiples of tens.

Fig. 2. Trends of pollutant emissions from diesel generators in the Thala Hills oases.
According to the results from the calculations, the average annual pollutant emissions during the first period (1963–1967) amounted to 1.7 t of SO2, 3.6 t of nitrogen oxides (NOx), 3.1 t of CO and 0.33 t of PM10. In the second period (1968–1989), emissions increased significantly. During the first part of the period, annual SO2 emissions increased to 7.4 t and then decreased to 2.9 t.
The period from 1990 to 1997 is characterized by the maximum annual emissions of most pollutants (except for SO2): 35.9–43.1 t of NOx, 31.5–37.8 t of CO and 3.3–3.9 t of PM10; SO2 emissions amounted to 3.5–4.2 t. The period from 2001 to 2005 was characterized by the lowest emission levels, which in some years dropped to zero due to the shutdown of the stations. Until 2014, there were also periods when the stations were not opened during the summer period.
The modern period, the beginning of which can be attributed to 2015, is characterized by emission levels of 0.02–0.03 t SO2, 0.88–1.79 t NOx, 0.77–1.57 t CO and 0.08–0.16 t PM10. The operation period of the stations lasts 2–4 months, and so during most of the year there are no emissions.
In general, the average current annual emissions of NO2, CO and PM10 have decreased by 30.9 times compared to the level of the early 1990s, and SO2 (compared to the late 1960s–late 1970s level) has decreased by 270 times.
Modelled ambient air concentrations and depositions
Comparing surface air concentrations of pollutants in the Thala Hills oases with the maximum permissible concentrations (MPCs) approved in Belarus, European Commission (EC) limit values and World Health Organization (WHO) air quality guideline values (WHO 2000, 2006, European Commission 2008, MHRB 2016) showed that the most significant change in the environmental situation is due to emissions of nitrogen oxides. At a diesel generator load of 75%, an excess of the hourly MPC of NO2 (250 μg/m3) and hourly WHO and EC limit values (200 μg/m3) could be observed during the period from 1964 to 1997, and an excess of the daily MPC (100 μg/m3) and WHO and EC limit values (75 μg/m3) could be observed during the period from 1964 to 1999.
NO2 air concentrations were the highest between 1968 and 1989. According to the calculations, locally they could reach 1.8 of hourly and 1.9 of daily WHO/EC limit values (Table IV). During the initial period of operation of Molodezhnaya Station (1963–1967), as well as in the period from 1990 to 1995, the maximum surface air NO2 concentrations were significantly lower, but nevertheless could exceed the permissible levels. If we do not take into account the years when the stations were not in operation, then the period after 2006 may be characterized by the lowest levels of air pollution in terms of NO2. As was shown in Kakareka & Salivonchyk (Reference Kakareka2020), exceeding the MPC at present in the Vecherny oasis is expected only at 100% power station load; at a standard load, exceeding the air quality standards should not be recorded.
Table IV. Maximum modelled pollutant air concentrations from emissions of diesel generators in the Thala Hills oases for different periods of power plant operation (at 75% load).

a Before 1969/from 1969 to 1983/after 1983.
b Before/after 2014.
PM10 = inhalable particulate matter with a diameter of ≤ 10 μm.
The dynamics of areas within which exceeding the limit levels of NO2 concentrations is possible, in contrast to the dynamics of concentration levels, are characterized by a maximum for the period from 1990 to 1995, which turns out to be slightly higher than the maximum from 1979 to 1989 (Fig. 3). However, in general, the size of the zones exceeding permissible values for NO2, even during the periods of the greatest impact, was relatively small, at maximum values of 8 and 4 ha for zones exceeding hourly and daily WHO/EC limit values, respectively. At the same time, the total area where an increase in NO2 concentration of ≥ 1 μg/m3 was recorded reached 160 km2 for hourly average concentrations and > 30 km2 for daily average concentrations (Fig. 3).

Fig. 3. Dynamics of the area of surface air pollution in the Thala Hills oases (m2).
The temporal dynamics of maximum SO2 air concentrations are somewhat different from the dynamics of the NO2 and PM10 concentrations. The highest concentrations could be observed from 1968 to 1983, before the introduction of more stringent standards for the sulphur contents of fuels. Therefore, in the period from 1969 to 1983, the increase in hourly SO2 concentrations in the surface air could reach 0.18 of the 20 min MPC (500 μg/m3) or 0.26 of the WHO limit value (350 μg/m3), or it could reach 0.16 of the daily MPC (200 μg/m3) or 0.26 of the WHO/EC limit values (125 μg/m3). In the period after 2015, according to the calculations, hourly concentrations of SO2 did not exceed 0.005 of the 20 min MPC or 0.007 of the WHO limit value, and daily concentrations did not exceed 0.007 of the MPC or 0.01 of the WHO/EC limit values (Table IV).
Regarding the dynamics of the areas in SO2 pollution halos, three maximums were revealed, falling on 1968, 1979–1983 and 1990–1995. For the third period, a more significant area of the surface air pollution halo over the sea was noted, which was associated with the peculiarities of the diesel generator set locations during this period (Figs 3 & 4).

Fig. 4. Change in the halos of maximum hourly concentrations of NO2 and SO2 from emissions of diesel generators in the Thala Hills oases in different periods of their operation (μg/m3).
An hourly concentration of SO2 at > 0.1 of the WHO limit value in the period of the most intense emissions (1968) could be observed over area of up to 30 ha, and daily concentrations > 0.1 of the WHO/EC limit values could be observed over an area of up to 14 ha. The zone of increase in background SO2 concentrations by ≥ 1 μg/m3 during the period of maximum load could extend over an area of up to 64 km2 for hourly average concentrations and up to 4.6 km2 for daily average concentrations (Figs 3 & 4).
The dynamics of maximum surface air PM10 concentrations are similar to the dynamics of the air concentrations of NO2. During the period of the greatest impact (1968–1989) and at 75% load of diesel generators, their level could reach 0.23 of 20 min MPC (150 μg/m3) and 0.24 of the daily MPC/EC limit values (50 μg/m3) or 0.12 of the WHO limit value (100 μg/m3). In the modern period, hourly concentrations of PM10 could reach 0.1 of the 20 min MPC, and daily concentrations could reach 0.13 of the MPC/EC limit values or 0.07 of the WHO limit value (Table IV).
Regarding the dynamics of areas with surface air contamination by PM10 and NO2, the maximum fell on 1990–1995, while significant areas of pollution could have been recorded over the sea (Figs 3 & 5). For hourly concentrations > 1 μg/m3, the area of pollution over the sea was more than two times larger than the polluted sector over the land (Fig. 3). The area over which such hourly PM10 surface air concentrations could be recorded (at least once) reached 22 km2, while the average daily concentrations of the same level reached ~0.8 km2. Hourly concentrations of > 0.1 of the 20 min MPC during the period of the most intense dispersion of PM10 could be observed over an area of up to 9 ha, and daily concentrations of > 0.1 of the MPC/EC limit values could be observed over an area of up to 7 ha, while values > 0.1 of the WHO limit value could be observed over an area of up to 2 ha (Figs 3 & 5).

Fig. 5. Change in the halos of maximum hourly concentrations of inhalable particulate matter with a diameter of ≤ 10 μm (PM10; μg/m3) and PM10 dry deposition fluxes (mg/m2 per year) from emissions of diesel generators in the Thala Hills oases in different periods of their operation.
The levels of PM10 total annual dry deposition fluxes were the highest in the period from 1978 to 1995, reaching > 200 mg/m2 per year at some points (Fig. 5). The area of largest impact could be observed in 1990–1995, and the highest flux (333 mg/m2 per year) could be observed in the period from 1979 to 1989. For the modern period, calculated fluxes of PM10 dry deposition do not exceed 41 mg/m2 per year. On average, for the whole receptor grid, these levels in the modern period have decreased in comparison with 1979–1989 by 18 times, and in comparison with 1991–1995 they have decreased by 21 times.
For the selected key receptor points (penguin colony and moss-lichen communities), the most unfavourable situation was connected with air pollution by NO2. Levels of NO2 concentrations closest to the threshold values could be observed at points M2 (1968–1989) and M1 (1968–1997) at Cape Granat, as well as at the moss-lichen community (point V1) near the command module of the Belarusian Antarctic station (2007–2018) (Table V). Over the most polluted point (M2) in the most unfavourable period, the maximum hourly concentrations were < 0.39 of the 20 min MPC or 0.49 of the WHO/EC limit values, and the maximum daily concentration was ~0.35 of the MPC or 0.47 of the WHO/EC limit values.
Table V. Maximum modelled NO2 air concentrations and PM10 annual dry depositions for key receptor points in the Thala Hills oases by period of station operation.

a Before 1969/from 1969 to 1983/after 1983.
b Before/after 2014.
PM10 = inhalable particulate matter with a diameter of ≤ 10 μm.
Only long-term limit values for the protection of vegetation have been established. Maximum daily NO2 and SO2 concentrations at point M2 in 1968–1989 according to modelling exceeded the WHO annual critical level for lichens (30 μg/m3 for NO2 and 10 μg/m3 for SO2). Concentrations of other pollutants at key receptor points were significantly lower than the limit values.
Discussion and verification
Verification of the modelled concentrations of NO2, SO2 and PM10 for the Thala Hills area is difficult, as air quality monitoring in this area has not been carried out on a regular basis. Therefore, the available data on environmental pollution for Molodezhnaya Station and observational data at other Antarctic stations were used.
The ecological situation at Molodezhnaya Station was studied in 1991–1992 during the 36th SAE, when the ecological team cleared the territory of station and developed the ecological plan. As a result, areas of soot on the ice in the vicinity of Opasnaya Bay were plotted, which were interpreted as consequences of the ADES operation near the coastline of the bay (Savatyugin & Preobrazhenskaya Reference Savatyugin and Preobrazhenskaya2000).
Using the AERMOD, total annual deposition fluxes of PM10 were calculated for the same period. The results of these calculations were overlaid with the traces of soot on the ice according to Savatyugin & Preobrazhenskaya (Reference Savatyugin and Preobrazhenskaya2000) (Fig. 6). There is a good correspondence between the zones of the modelled and measured halos of snow pollution.

Fig. 6. Total annual inhalable particulate matter with a diameter of ≤ 10 μm (PM10) dry deposition fluxes (mg/m2 per year) at Molodezhnaya Station according to the calculations using the AERMOD model for 1991–1992 and areas of soot stains on ice as mapped during the 36th Soviet Antarctic Expedition.
At a number of Antarctic stations (Amundsen-Scott, Palmer, Troll, Syowa, Halley, Neumayer III, King Sejong, Jang Bogo, etc.), atmospheric chemistry monitoring programmes are conducted. These are focused on obtaining background air characteristics; therefore, the measuring facilities are usually located at some distance from the stations. As a rule, greenhouse and reactive gases, aerosols and, less often, persistent organic pollutants are measured at such stations. Measurements of СО2, СО, O3 and N2O are common; very rarely are NO2 and SO2 measured. Thus, at Molodezhnaya and Mirny stations, observations of atmospheric air pollution, precipitation and snow for pesticides and other organochlorine compounds were made; they mainly included observations of the atmosphere transparency, the integral content of CO, measurements of the large aerosol particle concentration in the surface layer and the total ozone content in the atmosphere (Golitsyn et al. Reference Golitsyn, Grechko, Elansky and Pugachev1991).
A fairly lengthy campaign to measure the content of pollutants, including PM10, NO2 and SO2, in the surface air of the territory of the station itself was carried out at McMurdo Station from 1992 to 1997. Single measurements were also taken near Henryk Arctowski Station on King George Island, as well as at Maitri and Palmer stations. These studies demonstrate an increase in the content of pollutants at station sites. For example, in Tiwari (Reference Tiwari2017) and Khan et al. (Reference Khan, Klein, Katich and Xian2019), increases in air concentrations of suspended particles of various fractions near scientific stations were demonstrated.
Measurements at McMurdo Station are especially important because they were carried out simultaneously at several measuring points located at different distances up to 1000 m from sources of anthropogenic emissions (power plants, incinerators, etc.); this made it possible to assess the anthropogenic impact on the air. A paper by Truzzi et al. (Reference Truzzi, Lambertucci, Illuminati, Annibaldi and Scarponi2005) concludes that average PM10 concentrations at distances of up to 200 m and 1 km from the power plant and outside the station were 9.8, 3.7 and 1.6 μg/m3 for the summer season, respectively, and were several times higher than the background levels (from 0.18 to 1.49 μg/m3). Maximum daily values were 16.4, 13.2 and 7.8 μg/m3, respectively (Lugar Reference Lugar1994). It is noted that at 1 km distance from the station the share of fuel combustion in air PM10 content is ~14% (Mazzera et al. Reference Mazzera, Lowenthal, Chow and Watson2001a).
Maximum hourly and seasonal mean NO2 concentrations at McMurdo Station at a distance of 1 km downwind from the power plant showed increases, respectively, to 24.9 ppb (47.63 μg/m3) and 6.7 ppb (12.8 μg/m3) against background values of 0.5–4.0 ppb (0.96–7.65 μg/m3). For SO2, concentrations increased to 8.7 ppb (23.2 μg/m3) and 0.3 ppb (0.8 μg/m3), respectively, against background values of 0.02–0.20 ppb (0.05–0.53 μg/m3) (Lugar Reference Lugar1993, Reference Lugar1994, Mazzera et al. Reference Mazzera, Lowenthal, Chow, Watson and Grubı̆sı́c2001b).
The order of magnitude of air concentrations obtained during these studies is in good correspondence with the results from our calculations, according to which PM10 concentrations at receptor points located at distances of 200 m and 1 km from power plants in the direction of the prevailing winds may have increased during the period of greatest emissions by up to 9.4 and 2.4 μg/m3 for maximum hourly values, by 4.4 and 0.4 mg/m3 for daily average values and by up to 1.6 and 0.13 μg/m3 for monthly average values.
For NO2 at a distance of 1 km from power plants, our calculations showed an increase of the maximum hourly, daily and monthly average values, respectively, of up to 26.2, 4.4 and 1.4 μg/m3; for SO2, respectively, these values were up to 5.9, 1.0 and 0.32 μg/m3.
Sources of uncertainty
The accuracy of the pollutant emissions estimates is significantly influenced by the peculiarities of the diesel generators in operation in Antarctica, the variability of their load levels and the heterogeneity of the qualitative characteristics of fuel, especially the sulphur content, level of maintenance, etc. In particular, it was indicated (Savatyugin & Preobrazhenskaya Reference Savatyugin and Preobrazhenskaya2000) that there was a significant increase in soot emissions at Molodezhnaya Station in the early 1990s due to the use of low-quality fuel.
Uncertainties in the modelled air concentrations and atmospheric depositions are introduced due to uncertainties in the model parameterization, particularly regarding emission source parameters, as well as due to gaps in the series of meteorological data. Meteorological observations at Molodezhnaya Station were carried out only four times a day; therefore, for the use of such data in the AERMOD model, initial series were interpolated to produce rows with 1 h resolution. Another drawback of the initial meteorological information is the lack of data on hourly precipitation; this circumstance did not allow us to assess the wet deposition of PM10.
Conclusions
For the first time, this retrospective analysis allows for the construction of time series of anthropogenic impacts on the atmospheric air in an Antarctic region over > 50 years using the example of Thala Hills. It is shown that the average annual emissions reached their maximum values in the early 1990s, after which they decreased to zero in 2000–2001; in the subsequent period they increased, but remained 30.9 times less than the maximum values for NOx, CO and PM10 and 270 times less than the maximum value for SO2 (compared to the late 1960s–late 1970s).
The levels of surface concentrations of SO2, NOx and PM10 and atmospheric deposition of PM10 have been estimated. It was shown that the halos of surface air pollution with NOx, SO2 and PM10 reached maximum values in 1990–1995. It was shown that, during this period, the area in which an increase in NO2 surface air concentrations of ≥ 1 μg/m3 could be recorded was ~160 km2 for hourly concentrations and > 30 km2 for daily average values. The area of the halos, within which hourly PM10 air concentrations > 1 μg/m3 could be recorded, could reach 22 km2, while the area of average daily concentrations of the same level could reach ~0.8 km2. Regarding the dynamics of the areas of halos of atmospheric SO2 air pollution, three maximums were revealed, falling on 1968 and 1979–1983, when fuel with higher sulphur contents was used, and 1990–1995, during the period of operation of the most powerful diesel generators.
It was found that the levels of PM10 total annual dry deposition fluxes were the highest in the period from 1978 to 1995, at > 200 mg/m2 per year in the places of the greatest load. For the modern period, calculated fluxes of PM10 dry deposition do not exceed 41 mg/m2 per year. On average, for the computational grid, the levels of annual atmospheric deposition of PM10 decreased by a factor of 21.
The results of the comparison of these calculations with the available data on the measurement of surface air pollutant concentrations and atmospheric depositions were presented. Sources of uncertainties in the estimates of emissions, ground-level concentrations and depositions were described.
The developed approaches may be used to model the impacts on atmospheric air in other Antarctic oases, as well as for improvement of the methodological provision of impact assessments under the Protocol on Environmental Protection to the Antarctic Treaty, including cumulative impacts.
Acknowledgements
This article was prepared based on the results obtained in the framework of the State Program‘s project ’Monitoring of the Earth Polar Regions, Creation of the Belarusian Antarctic Station and Support of the Polar Expeditions for 2016–2020' (project registration number 20163266). The authors appreciate consultation support from the members of Russian and Belarusian Antarctic expeditions and constructive comments on this article made by reviewers.
Author contributions
SK: formulation of the general concept of the study, assessment of the parameters of diesel generator sets, calculation and analysis of pollutant emissions, drafting of the paper and conclusions. SS: modelling the dispersion of air pollutants and analysis of the results, mapping and design of the paper.


