Sea level changes around Scottish coasts have been remarked on for over 300 years. Accounts describe the great variety of shore features displaced above present sea levels, from the raised estuarine sediments, locally known as “carse”, in the “carselands” of the E and S, to the extensive raised rock platforms of the W. Important concepts in understanding the processes involved in sea level change were first identified in Scotland; for example, glacio-eustasy (Maclaren Reference Maclaren1842), glacio-isostasy (Jamieson Reference Jamieson1865) and shoreline diachroneity (Wright Reference Wright1914, Reference Wright1925). Building on a rich heritage of ideas, modern studies of sea level change in Scotland owe much to J. B. Sissons, whose research (e.g., Sissons Reference Sissons1962, Reference Sissons1966, Reference Sissons1972, Reference Sissons1974a, Reference Sissons1981; Sissons et al. Reference Sissons1966) greatly influenced later work. Detailed field and laboratory studies continue to disclose relative sea level (RSL) changes, whilst models of glacial isostatic adjustment (GIA) and shoreline-based isobase models now provide the context for such changes.
This review takes as its benchmark the Quaternary of Scotland Geological Conservation Review (GCR) volume (Gordon & Sutherland Reference Gordon and Sutherland1993). It comprises sections contributed by research scientists working in the field of Scottish sea levels. It examines developments which have taken place since 1993 in: (1) methodologies and techniques; (2) studies of both offshore and onshore evidence for RSL change and extreme events; and (3) GIA modelling. Key research questions are identified. All dates are given in sidereal (calibrated) years before AD1950 (BP). Where individual dates are quoted, a 2σ range is given. Where several dates are quoted, as for a specific event, the total range and number of dates are given. Otherwise, approximate ages are expressed in thousands of years BP, thus “19 ka”. Altitudes are quoted with respect to Ordnance Datum Newlyn (OD), with a few unsurveyed altitudes recorded as above sea level (asl). In this paper, Late Devensian is taken as the period from the maximum of the Devensian in Scotland (the LGM) to the end of the Younger Dryas, or from 26 ka BP to 11.7 ka BP, and Lateglacial as the period of the Windermere Interstadial (14.7 ka BP to 12.9 ka BP) and the Younger Dryas (12.9 ka BP to 11.7 ka BP). The Holocene is divided into Early (11.7 ka BP to 8.2 ka BP), Middle (8.2 ka BP to 4.2 ka BP) and Late (4.2 ka BP to present), following Walker et al. (Reference Walker, Berkelhammer, Björck, Cwynar, Fisher, Long, Lowe, Newnham, Rasmussen and Weiss2012). Locations discussed in this paper are shown in Figures 1 and 7.
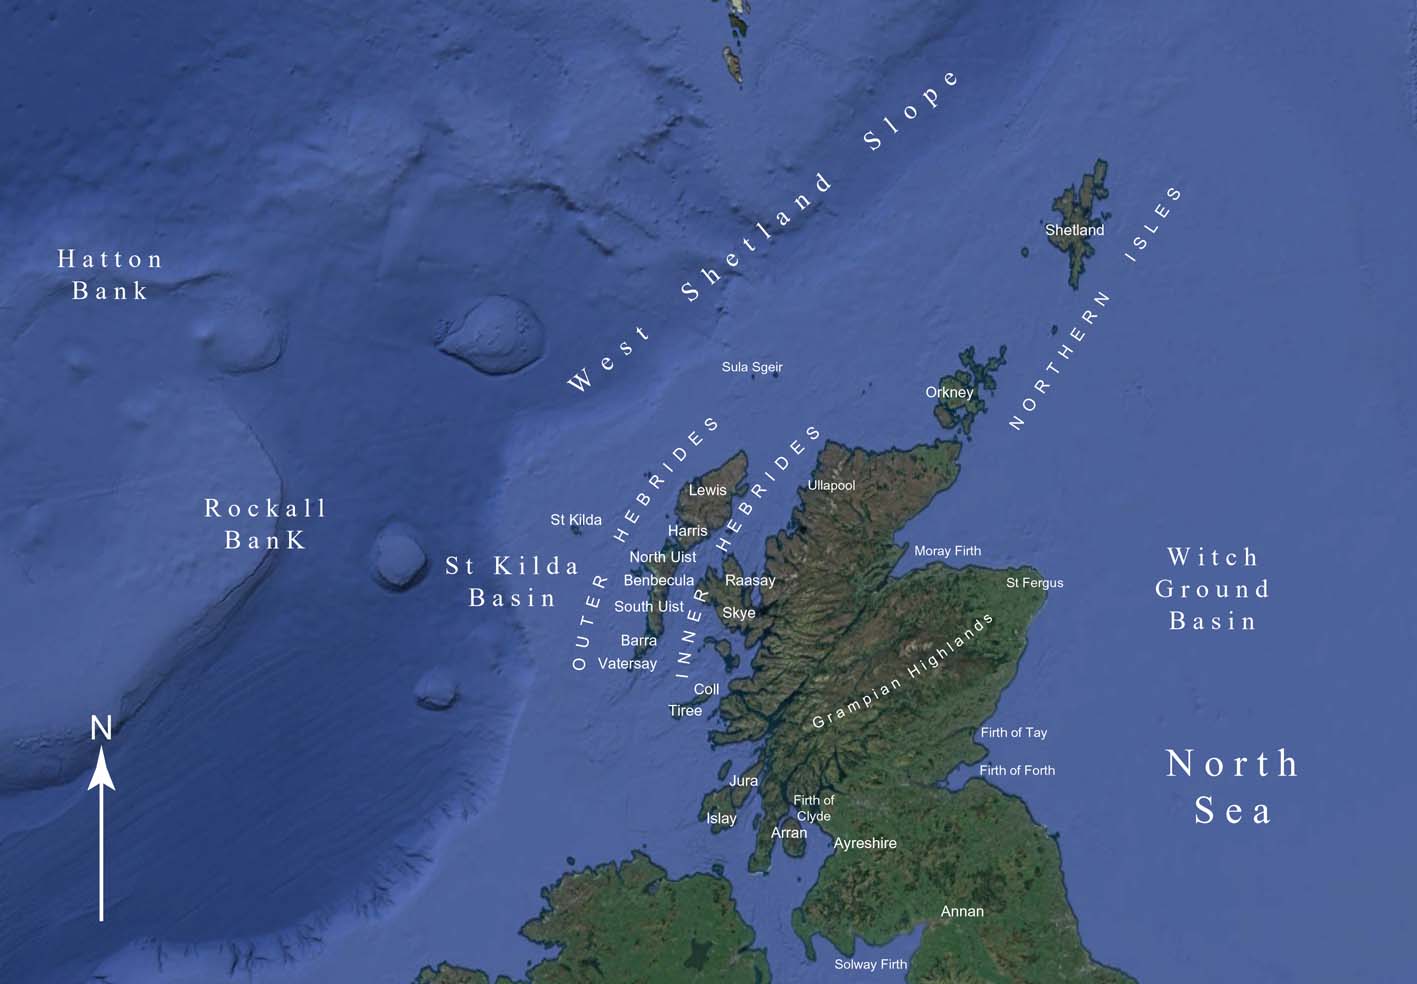
Figure 1 Scotland, showing its location on the continental shelf offshore NW Europe (adapted from Google Earth).
1. Methodology and techniques
[David Smith and Jason Jordan]
1.1. Methodology
A major development which began in 1993 is the work on isolation basins. Isolation basins are closed depressions in the coastal landscape already present before changes in RSL occurred. These depressions, in rock or glacial sediments, may at different times have been either connected to or isolated from the sea by changes in RSL. Isolation basin sediments, deposited in a low energy environment, can provide information on changes in the nearshore and sometimes the offshore marine environment, whilst the lowest elevation on the threshold or sill of the basin provides a measure of RSL altitude at the point in time when the basin was flooded by, or isolated from, the sea during episodes of RSL change. The methodology was probably originally developed in Sweden, where Sundelin (Reference Sundelin1917) studied basins at the margins of the Baltic Ice Lake. It was first applied in Scotland at Arisaig (Shennan et al. Reference Shennan, Innes, Long and Zong1993) and since then has been applied at several sites in western Scotland, largely by Shennan and co-workers (e.g., Shennan et al. Reference Shennan, Lambeck, Horton, Innes, Lloyd, McArthur, Purcell and Rutherford2000a).
The study of estuaries and coastal embayments continuously connected to the sea, and with sedimentary records of RSL in low-energy environments, has increased. Most such studies since 1993 have been in the estuarine carselands of eastern and southwestern Scotland (e.g., Smith et al. Reference Smith, Wells, Mighall, Cullingford, Holloway, Dawson and Brooks2003a, Reference Smith, Davies, Brooks, Mighall, Dawson, Rea, Jordan and Holloway2010), but less accessible estuarine areas and coastal embayments in northern Scotland and the Outer Hebrides have also provided information on RSL change (e.g., Smith et al. Reference Smith, Hunt, Firth, Jordan, Fretwell, Harman, Murdy, Orford and Burnside2012). Together with the results of isolation basin studies, these developments have provided an increasingly detailed picture of RSL change in the Late Devensian and Holocene in Scotland (e.g., Smith Reference Smith2005). However, there are differences in approach between the two methods. Studies in carseland areas now routinely use mean high water spring tides (MHWST) from the nearest tidal station in a comparable setting, as well as OD as a datum, having established that the carseland is a former saltmarsh surface, the landward margin of which approximates to MHWST (e.g., Smith et al. Reference Smith, Wells, Mighall, Cullingford, Holloway, Dawson and Brooks2003a). Studies of isolation basins and coastal marshland areas on the W coast, using detailed microfossil and stratigraphical evidence, compare the horizons they date with the tidal frame in establishing a reference water level, in addition to OD (e.g., Shennan et al. Reference Shennan, Innes, Long and Zong1993, Reference Shennan, Innes, Long and Zong1994). Both approaches base graphs of RSL change on sea level index points (SLIPs), identifying transgressive and regressive overlaps as defined by Tooley (e.g., Tooley Reference Tooley1982) and with limiting points defining the limits of evidence for RSL in the stratigraphy (see Figures 8 and 9 below). Both approaches recognise error margins in the altitudes obtained, both in tidal frame estimates as well as in survey. In estuarine sites, estimates for sediment compaction are provided. Full details of error margin estimates are given in the works quoted, notably in Shennan et al. (e.g., Reference Shennan, Innes, Long and Zong1995a, Reference Shennan, Lambeck, Horton, Innes, Lloyd, McArthur, Purcell and Rutherford2000a) and Smith et al. (e.g., Reference Smith, Wells, Mighall, Cullingford, Holloway, Dawson and Brooks2003a). In registering RSL change, isolation basin sediments and estuarine sediments each have their benefits: isolation basin sediments can be more accurate than estuarine sediments, provided the threshold (across which the changing RSL rose and fell) is accurately known, whereas estuarine sediments provide greater continuity. However, each method is appropriate to the topographical setting: isolation basins on W and NW coasts and estuaries mainly on SW and E coasts.
An important development since 1993 has been in the modelling of spatial patterns of GIA. Before then, glacio-isostatic uplift for Scotland as a whole was identified in terms of generalised isobase maps, based upon altitude measurements of former shorelines (e.g., Sissons Reference Sissons1976; Jardine Reference Jardine1982) or modelled isobase maps for specific areas (Smith et al. Reference Smith, Sissons and Cullingford1969; Gray Reference Gray1978). Graphs of RSL change for specific locations based upon GIA modelling (e.g., Lambeck Reference Lambeck, Sabadini, Lambeck and Boschi1991a, Reference Lambeckb) were produced, but no modelled isobase maps for the whole of Scotland were provided. Since 1993, GIA models based upon geophysical, rheological, water and ice loading parameters in both the near and far field (e.g., Lambeck Reference Lambeck1993a, Reference Lambeckb, Reference Lambeck1995; Bradley et al. Reference Bradley, Milne, Shennan and Edwards2011; Shennan et al. Reference Shennan, Milne and Bradley2012), depicting patterns of uplift for the whole of Scotland, have been produced. These have been further improved in recent years with the advent of terrain correction (Shennan et al. Reference Shennan, Bradley, Milne, Brooks, Bassett and Hamilton2006a), particularly important in an area with considerable local variation in topography (Fretwell et al. Reference Fretwell, Smith and Harrison2008). At the same time, models based upon the statistical analysis of shoreline altitudes have been produced. These models have normally involved polynomial quadratic trend surfaces (e.g., Smith et al. Reference Smith, Cullingford and Firth2000, 2002), but recently, a new approach, employing Gaussian quadratic trend surfaces (e.g., Fretwell et al. Reference Fretwell, Peterson and Smith2004; Smith et al. Reference Smith, Fretwell, Cullingford and Firth2006, Reference Smith, Hunt, Firth, Jordan, Fretwell, Harman, Murdy, Orford and Burnside2012), provides a better fit than polynomial trend surfaces and has the additional benefit of defining a zero level for the surfaces computed. Modelling approaches to isostatic uplift in Scotland were recently reviewed by Stockamp et al. (Reference Stockamp, Bishop, Li, Petrie, Hansom and Rennie2016).
1.2. Techniques
Since 1993, the study of RSL change in Scotland has seen improvements in the techniques used. Offshore, high resolution survey methods have disclosed increasing detail of the sea floor. Onshore, morphological studies supported by instrumental survey are now regularly used. Current stratigraphical work is commonly more detailed than that previously carried out, and has benefitted from a greater concentration of boreholes in order to more accurately reconstruct underlying stratigraphy. This is exemplified by detailed work in isolation basin studies (e.g., Shennan et al. Reference Shennan, Innes, Long and Zong1993). Powered coring systems are increasingly used, especially in the carseland areas (e.g., Holloway Reference Holloway2002) and in low-lying machair locations of the Western Isles (e.g., Jordan et al. Reference Jordan, Smith, Dawson and Dawson2010). There has also been increasing interest in sediment structures (e.g., Barrass & Paul Reference Barrass and Paul1999; Tooley & Smith Reference Tooley and Smith2005).
Microfossil studies now frequently employ new biological proxies in addition to pollen and diatoms, notably in isolation basin studies. Thus, Shennan et al. (e.g., Reference Shennan, Rutherford, Innes, Walker, Andrews, Austin, Bergsten and Jennings1996b, Reference Shennan, Lambeck, Horton, Innes, Lloyd, McArthur, Purcell and Rutherford2000a, Reference Shennan, Lambeck, Flather, Horton, McArthur, Innes, Lloyd, Rutherford, Wingfield, Shennan and Andrews2006b) used dinoflagellate cysts, foraminifera and thecamoebians in reconstructing RSL change at several locations in W and NW Scotland, whilst Lloyd (Reference Lloyd2000) employed foraminifera and thecamoebians in order to reconstruct the majority of the Holocene sequence from Loch nan Corr in NW Scotland. Smith et al. (Reference Smith, Wells, Mighall, Cullingford, Holloway, Dawson and Brooks2003a) used ostracods and foraminifera in a study in the Cree valley, SW Scotland.
With the increased use of newer techniques and proxies, the need to better understand modern sedimentation and the current environmental conditions of coastal sites has led to the development of contemporary analogue studies. For example, Lloyd & Evans (Reference Lloyd2002) employed the use of contemporary analogues of foraminifera to better understand the palaeodepositional processes affecting fossil assemblages. The natural development of this mode of research has been to extend the statistical measurement of changes via a transfer function approach, as in western Scotland (e.g., Zong & Horton Reference Zong and Horton1999; Barlow et al. Reference Barlow, Long, Saher, Gehrels, Garnett and Scaife2014). Transfer functions aim to explore the relationship between tidal level and the habitat range of microfossils which, once determined, allow the former RSLs to be identified alongside radiometric dating of the relevant horizons. The determination of sedimentation rates in modern saltmarshes allows further inference to be made about the fossil structures. The use of the natural radionuclide Pb210 and anthropogenically produced Cs137 has been used in the Firth of Lorn area and on Mull (Teasdale et al. Reference Teasdale, Collins, Firth and Cundy2011), as well as in NW Scotland (Barlow et al. Reference Barlow, Long, Saher, Gehrels, Garnett and Scaife2014), to determine accretion rates.
2. Quaternary sea levels on the continental shelf
[David Long]
Due to surveying techniques and constraints in obtaining samples offshore, the evidence used to determine former sea levels differs from that used onshore. As the volume of material available for physical examination is very small, evidence of former sea levels normally consists of indirect evidence of former water depths differing from those at present and often with limited dating control (locations discussed are shown in Fig. 1).
As global sea levels changed during the Quaternary, the extensive continental shelf around Scotland has seen dramatic environmental changes. However, much of the evidence for the level and position of former shorelines has been disturbed by the last episode of coalesced British and Scandinavian Ice Sheets (Graham et al. Reference Graham, Lonergan and Stoker2007; Bradwell et al. Reference Bradwell, Stoker, Golledge, Wilson, Merritt, Long, Everest, Hestvik, Stevenson, Hubbard, Finlayson and Mathers2008; Sejrup et al. Reference Sejrup, Nygård, Hall and Haflidason2016) that extended in many places to the shelf edge. Beyond the shelf edge the extent of iceberg scouring provides some indication as to contemporary sea level, as scouring intensity and extent of cross-cutting reflect palaeo-bathymetry. Iceberg scours have been identified to more than 500 m below present on the West Shetland Slope, and around both Rockall and Hatton banks, with extensive sea bed scouring by icebergs on the outer shelf and topmost slope (e.g., Jacobs Reference Jacobs2006). By comparison with modern ice fronts, this suggests sea levels more than 100 m below present in the outer parts of Scotland's offshore area.
Recent detailed sea floor morphological studies show that the retreat and breakup of the last ice sheet was probably strongly controlled by sea level (Bradwell et al. Reference Bradwell, Stoker, Golledge, Wilson, Merritt, Long, Everest, Hestvik, Stevenson, Hubbard, Finlayson and Mathers2008). Calving drove ice sheet retreat and Bradwell et al. (Reference Bradwell, Stoker, Golledge, Wilson, Merritt, Long, Everest, Hestvik, Stevenson, Hubbard, Finlayson and Mathers2008) suggested that during the abrupt RSL rise around the time of Heinrich Event 2 (24 ka BP), a large marine embayment opened in the northern North Sea, as far south as the Witch Ground Basin. This marine embayment changed the entire configuration of the British and Scandinavian ice sheets forcing them to decouple rapidly along a north–south axis E of Shetland. This marine embayment terminated in the Witch Ground Basin, in an area of ice scouring where differences in the morphology of a surface dated as 17–18 ka BP support a sea level between 125 m and 100 m below present (Stoker & Long Reference Stoker and Long1984). Sejrup et al. (Reference Sejrup, Nygård, Hall and Haflidason2016) recently elaborated upon the extent and process of decoupling of the British and Scandinavian ice sheets in this area.
Detailed analysis of selected offshore cores shows that significant changes in sea level have occurred. Cores examined in the St Kilda Basin, on the continental shelf west of the Outer Hebrides, show that prior to the Younger Dryas, water depths were probably less than 40 m at a site presently 155 m below sea level (Peacock Reference Peacock, Andrews, Austin, Bergsten and Jennings1996).
Unlike offshore England, where submerged peats have regularly been recovered from the shallow waters of the southern North Sea (Hazell Reference Hazell2008), there have been few instances of dateable material indicative of former exposure recovered offshore Scotland. Where they have been found, they are restricted to very nearshore. For example, Hoppe (Reference Hoppe1965) reported peats dated to 7–5.5 ka BP, recovered at Symbister, Shetland, implying sea levels more than 9 m below present. He noted several other locations around Shetland where submerged peats have been recovered, but not analysed.
Although undateable, the finding of a flint suggestive of anthropogenic modification in the northern North Sea at 135 m water depth implies extensive former exposure. However, it should be noted that the morphological setting of this find suggested that it was not in situ, but had been transported from a nearby former exposed landscape (Long et al. Reference Long, Wickham-Jones, Ruckley and Roe1986).
3. Inherited rock shorelines
[Adrian Hall]
3.1. Introduction
Inherited rock shorelines occur where sea level has returned to a former level and reoccupied the shoreline (Blanco Chao et al. Reference Blanco Chao, Costa Casais, Martínez Cortizas, Pérez Alberti and Trenhaile2003). In Scotland, inheritance is most readily apparent where landforms of marine erosion cut in rock can survive glaciation and be modified by glacial erosion or buried by glacial deposition (Fig. 2A, B). Such inherited coastal forms can shed light on the sea level history around Scotland. This history is examined in three time periods: the Pliocene and Early Pleistocene (5.3–0.78 Ma); the Middle and Late Pleistocene (780–20 ka); and the Lateglacial and early Postglacial (since 14.7 ka BP).

Figure 2 (A) Actively eroding rock shoreline. LWM = Low water mark; HWM = High water mark (outlined here with black squares). (B) The same shoreline after a period of glaciation: 1 = direction of ice flow; 2 = till; 3 = bevelled cliff edge; 4 = stump of former wall; 5 = crag and tail; 6 = roche moutonnée with striated surface; 7 = stump of former stack with striated surface; 8 = beach gravel preserved below till. Cliff at high water mark has been locally eroded.
3.2. Pliocene and Early Pleistocene
Throughout almost all of the Pliocene, global mean sea level was above present, reaching a maximum elevation of 22 m asl (Miller et al. Reference Miller, Wright, Browning, Kulpecz, Kominz, Naish, Cramer, Rosenthal, Peltier and Sosdian2012). The global variability in the elevation of observed Pliocene shorelines, however, is large, ranging over tens of metres, due to uncertainties over the age of the shoreline features and the influence of dynamic topography (Dutton et al. Reference Dutton, Carlson, Long, Milne, Clark, DeConto, Horton, Rahmstorf and Raymo2015). In the cooler Early Pleistocene, global sea level only reached a few metres higher than present during brief interglacial periods; otherwise sea level was normally between 0 m and -60 m (Lisiecki & Raymo Reference Lisiecki and Raymo2005). The uplift history of Scotland during the Plio-Pleistocene is poorly known; a fact that greatly complicates reconstruction of the sea level history of this period. A significant phase of uplift is identified at 15 Ma in the North Sea (Japsen Reference Japsen1997) and on the North Atlantic shelf (Holford et al. Reference Holford, Green, Hillis, Underhill, Stoker and Duddy2010), but base level rose by 500 m on the Norwegian inner shelf in the early Pliocene (Løseth et al. Reference Løseth, Kyrkjebø, Hilde, Wild and Bunkholt2017). Pliocene fluvial erosion and the onset of glacial erosion in the Pleistocene removed rock mass from Scotland, but the elevation of peripheral planation surfaces indicates that passive unloading did not generate more than 100 m of uplift (Hall et al. in press (this volume)).
Extensive areas of low elevation bedrock surfaces exist close to present sea level in the Inner Hebrides to the S of Skye and across much of the Outer Hebrides, as well as on the shallow shelf to the W (Dawson Reference Dawson1994; Dawson et al. Reference Dawson, Dawson, Cooper, Gemmell and Bates2013a). Comparisons are compelling with the strandflat, the extensive coastal platform of western Norway (Nansen Reference Nansen1922; Larsen & Holtedahl Reference Larsen and Holtedahl1985). In Norway, these uneven, glacially-roughened and partly submerged rock platforms are cut across diverse rock types and slope gently seawards for many kilometres from the coastal mountains (Holtedahl Reference Holtedahl1998). In western Scotland, the islands of South Uist, Benbecula and North Uist in the Outer Hebrides mostly consist of extensive low rock platforms, 3–15 km in width, developed in Lewisian gneiss, which extend westwards from hills along the eastern margin of the island chain and pass below sea level west of the present Atlantic shoreline (Dawson et al. Reference Dawson, Dawson, Cooper, Gemmell and Bates2013a). On Coll and Tiree in the Inner Hebrides, survey of the platforms has shown that the strandflat includes multiple, tilted, km-wide rock platforms that rise to an inner margin against cliffs at ∼30 m asl (Dawson 1994). The ubiquity of glacial and marine erosional forms on the strandflat makes clear that glacial and marine erosion have been fundamental to its recent development. Indeed, these processes must have been highly effective as, in both Norway and Scotland, erosion has maintained the strandflat close to present sea level and kept pace with Plio-Pleistocene uplift of the coastal mountains (Evans et al. Reference Evans, McGiveron, Harrison, Bryn and Berg2002; Knies et al. Reference Knies, Mattingsdal, Fabian, Grøsfjeld, Baranwal, Husum, De Schepper, Vogt, Andersen, Matthiessen, Andreassen, Jokat, Nam and Gaina2014).
The considerable age of the strandflat is shown by its great extent and also by its configuration, with its elimination by glacial erosion in zones of fast ice flow. The strandflat, however, includes inherited elements that are not of marine or glacial origin. In northern Norway, Plio–Pleistocene erosion has exhumed and lowered a deeply weathered and peneplaned surface of Triassic to Early Jurassic age (Olesen et al. Reference Olesen, Kierulf, Brönner, Dalsegg, Fredin and Solbakk2013; Fredin et al. Reference Fredin, Viola, Zwingmann, Sørlie, Brönner, Lie, Grandal, Müller, Margreth and Vogt2017). In the Outer Hebrides, the low basement surface included in the strandflat also retains pockets of weathered rock that formed above sea level (Godard Reference Godard1956). Moreover, the development of topographic basins along the inner margin of the strandflat, for example within altered shear zones near Leverburgh on southern Harris, indicates a subaerial origin for the wider erosion surface. In the Inner Hebrides, the fragments of strandflat appear to be part of extensive, low-relief surfaces formed initially by subaerial processes in the Pliocene and later dislocated, tilted and then modified by glacial and marine erosion (Le Coeur Reference Le Coeur1988).
The strandflat is a polycyclic and diachronous feature, initiated by subaerial weathering and planation close to sea level in the Pliocene, perhaps trimmed by high Pliocene sea levels (Dawson et al. Reference Dawson, Dawson, Cooper, Gemmell and Bates2013a) and substantially modified and lowered by the successive phases of glacial and marine erosion through the Pleistocene.
3.3. Middle and Late Pleistocene
The strandflat in Hebridean Scotland subsumes fragments of till-covered or striated raised rock platforms and former sea cliffs that are older than the last glaciation (Gray Reference Gray1985). Similar inherited coastal features are remarkably widespread around the Scottish coast (Fig. 3A). Landforms typical of high wave-energy rock coasts have been over-ridden by the last ice sheet and striated and roughened by glacial erosion and masked by the deposition of till (Fig. 3B). On Shetland, no till plugs are reported from geos and caves but the lengths of many geos, reaching several hundred metres, coupled with the brief, ∼1000-yr duration of present sea level (Figs 5 & 6 below), suggest that these are largely inherited features. Around the Shetland Isles, cliff bases extend below −30 m and indicate formation at low glacial sea levels (Flinn Reference Flinn1964, Reference Flinn1969; Hansom Reference Hansom, May and Hansom2003b). On Orkney, wide rock platforms developed in Devonian flagstones and sandstones pass beneath till (Fig. 3B). On the island of Hoy, raised beach gravels rest on a narrow rock platform at 6–12 m asl and are covered by till (Wilson et al. Reference Wilson, Edwards, Knox, Jones and Stephens1935; Sutherland Reference Sutherland, Gordon and Sutherland1993b). In Caithness (Crampton et al. Reference Crampton, Carruthers, Horne and Peach1914) and Aberdeenshire (Walton Reference Walton, Miller and Watson1959; Hansom Reference Hansom, May and Hansom2003c), coastal cliffs and geos are locally encased by till. Striated and till-covered inter-tidal rock platforms also occur (Merritt et al. Reference Merritt, Auton, Connell, Hall and Peacock2003; Hall & Riding Reference Hall and Riding2016).
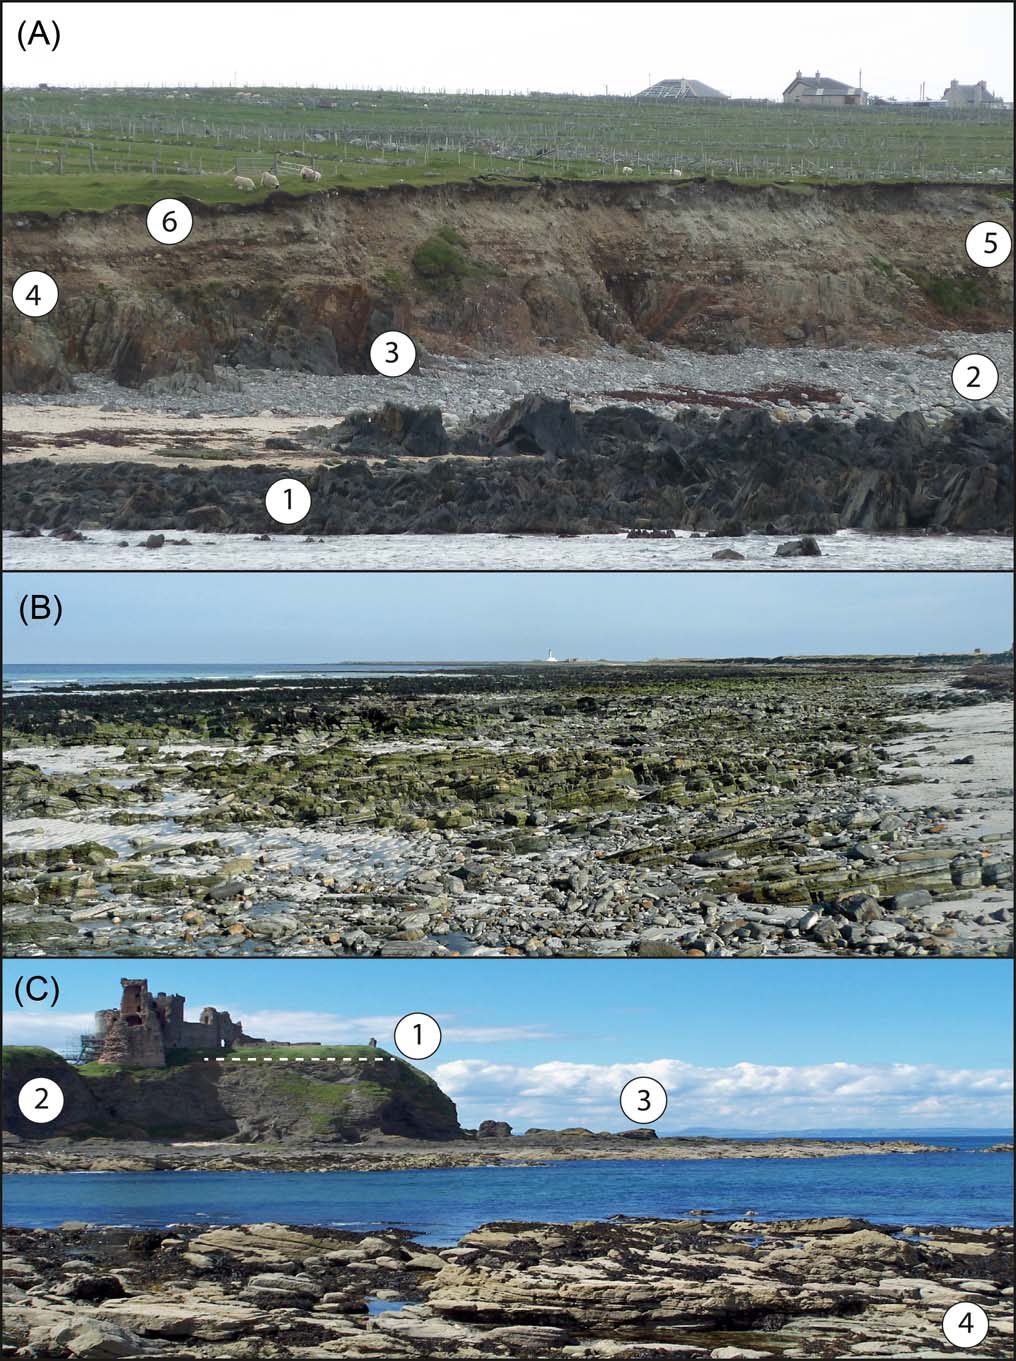
Figure 3 Inherited elements of rock coasts in Scotland. (A) The Galson Beach at Melbost Borve, Lewis: 1 = modern ITRP – note the irregularity of the platform surface developed in closely fractured Lewisian gneiss; 2 = modern storm beach; 3 = shallow weathering of basic dykes in the gneiss; 4 = raised shore platform at ∼6 m OD, locally covered by patches of red-brown till with Torridonian and Cambrian glacial erratics derived from the NW Highlands; 5 = sub-horizontally bedded cobble- to boulder-gravels of the Galson Beach; 6 = Late Devensian till. (B) Start Point, Sanday, Orkney. ITRP developed in dipping Devonian flagstones, with many glacial erratics incorporated into the storm beach on its surface. The platform is 600 m wide where it passes beneath the eastern tip of the Point. (C) Tantallon, East Lothian, showing a mix of inherited and dynamic landforms in a rock coastline: 1 = till-covered HRP at ∼20 m asl; 2 = modern cliff developed in Carboniferous volcanic tuff and agglomerate. At Seacliff, 1–2 km to the S of Tantallon, the cliff line is degraded and fronted by beaches of the Main Postglacial Raised Shoreline (MPS). East of Tantallon towards North Berwick, however, parts of the cliff-line appear to be locally plastered with till and to be mainly inherited features; 3 = remnants of the shore platform of the MPS, preserved in resistant rock units; 4 = modern ITRP. In weak Carboniferous sandstones and marls, the ITRP is being lowered at rates of ∼1 mm/yr (Hall Reference Hall2011). At a few nearby locations S and W of Tantallon, however, the ITRP and the raised platform beneath the MPS retain patches of till (Hall Reference Hall1989).
Inherited coastal forms are particularly well developed on northwest Lewis (Fig. 3A). Here, a raised rock platform lying at 7–10 m, up to 150 m wide (McCann Reference McCann, Bowen, Carter and Taylor1968; von Weymarn Reference von Weymarn1974) and backed by low cliffs, is overlain by till, organic sediments, the Galson raised beach gravels and by a further till layer (Peacock Reference Peacock1984; Sutherland & Walker Reference Sutherland and Walker1984; Hall Reference Hall, Gilbertson, Kent and Grattan1996). The raised rock platform predates at least two phases of glaciation and may have formed before MIS 6. The warm temperatures indicated by the palynology of the organic deposit indicate a last interglacial age, implying that the Galson beach formed in the interval from MIS 5–3. Raised beach gravels resting on a narrow rock platform at 5–8 m OD and preserved beneath till are also present on Barra and Vatersay (Peacock Reference Peacock1984; Selby Reference Selby1987).
The existence of till-covered rock platforms in the Inner Hebrides has long been known (Wright Reference Wright1911). Platforms are developed across rock type and structure and so are distinct from other extensive low angle surfaces close to present sea level developed on resistant Palaeogene basalt lava flows and sills (Bailey et al. Reference Bailey, Clough, Wright, Richey and Wilson1924). Two extensive and continuous old platforms, backed by cliffs, have been recognised on the west coasts of Islay and Jura: the High Rock Platform (32–5 m OD) (Dawson Reference Dawson, Dawson and Edwards1993b) and the Low Rock Platform (below 5 m OD) (Dawson Reference Dawson1980). Many smaller platform fragments also have been identified at other elevations, including a former sea cave with a till–covered floor at ∼45 m OD on Ulva (Sissons Reference Sissons1967). Many of these platform fragments are mantled by Holocene raised shoreline deposits, but the presence of till-covered rock hollows below the shoreline deposits and records of striated and ice-roughened rock surfaces of the platforms show that some fragments predate the last glaciation (Sissons Reference Sissons1981; Gray Reference Gray1989).
In contrast, the absence of such features, together with the presence of fragile sea stacks on platform surfaces, has been used to distinguish fragments of the Main Rock Platform, which developed during the Lateglacial (Sissons Reference Sissons1981; Dawson Reference Dawson, Dawson and Edwards1988). Inherited rock shoreline fragments occur extensively in SW Scotland. In Kintyre, one fragment with its backing cliff stands at 13 m OD (Gray Reference Gray, Gordon and Sutherland1993) and platforms, stacks and cliffs with in situ or slumped till occur commonly in the southern part of the peninsula (Gray Reference Gray1978). In southern Arran, till-covered platforms have not been reported, but the base of the cliff at Kildonan is mantled by till. In the inner Firth of Clyde, till-covered platforms are identified from the Kyles of Bute and Cardross (Browne & McMillan Reference Browne and McMillan1984). Till-covered platforms at ∼10 m OD occur also on the Rhinns of Galloway (Sutherland Reference Sutherland, Gordon and Sutherland1993a), which may correlate with features on the opposite side of the North Channel (Stephens Reference Stephens1957). In western Islay, a raised rock platform at c.10 m OD is buried by a thick sequence of till and glaciomarine deposits (Benn & Dawson Reference Benn and Dawson1987). Extensive terraces or shorelines are developed in the deposits that rise to 70 m OD. Thermoluminescence ages of 41–54 ka BP on clays from the glaciomarine deposits suggest formation of the rock platform before MIS 3 (Dawson et al. Reference Dawson, Benn, Dawson, Dawson and Dawson1997). Alternatively, if the ages are in error, the glaciomarine deposits may have been deposited at a time of low sea level early in the last deglaciation (Peacock Reference Peacock2008).
Inherited landforms reappear along the coastline of eastern Scotland within three broad altitudinal ranges. Remnants of till-covered high rock platforms have been described at elevations of 15 to 25 m OD N of Berwick (Rhind Reference Rhind1965; Sissons Reference Sissons1967) and at 23 m OD at Dunbar (Sissons Reference Sissons1967) (Fig. 3C). Raised platforms standing a few metres above present sea level, and the inter-tidal rock platform, also retain till-filled fractures and depressions W of Torness (Hall Reference Hall1989). In East Fife, the abandoned cliff line of the Main Late Glacial Shoreline turns inland at St Andrews, where its base is covered by till (Sissons Reference Sissons1967). The presence of dark shelly till, predating the last interglacial at elevations as low as 15 m OD in Kincardineshire (Campbell Reference Campbell1934; Auton et al. Reference Auton, Gordon, Merritt and Walker2000), implies that at least the higher raised shore platforms along this coast started to form before MIS 6 (Bremner Reference Bremner1925).
Beyond the present-day coastline of Scotland, the sea floor retains widespread morphological evidence of low former sea levels. Off the W coast, Sutherland (Reference Sutherland1984b) described pre-Late Devensian rock platforms at −120 m off St Kilda and at −155 m and −125 m off Sula Sgeir. Submerged shorelines have been identified off the Firth of Lorn (Hall & Rashid Reference Hall and Rashid1977). Off the E coast, submerged, low-relief rock surfaces occur extensively at −70 m off Shetland and at ∼−60 m off Orkney (Flinn Reference Flinn1964, Reference Flinn1969). Submerged platforms off Stonehaven slope away from the coast at 0.5–2.0 m/km and are separated by low irregular steps (Stoker & Graham Reference Stoker and Graham1985). The upper platform at −30 m is 1 km wide; the middle platform at −45 m to −50 m is 4.5 km wide. Both platforms are cut in Devonian strata and covered by till. The lower platform lies at −60 m to −70 m and is 7.5 km wide. It is cut across Permo-Triassic red beds and pre-Holsteinian (MIS 11) sediments and overlain by till, indicating a Middle Pleistocene age. The recent availability of high-resolution bathymetric and side scan sonar data for the sea bed around Scotland provides new opportunities to re-examine these and similar submerged platforms (Bradwell et al. Reference Bradwell, Stoker and Larter2007; Howe et al. Reference Howe, Dove, Bradwell and Gafeira2012).
Viewed as an assemblage, it is clear that fragments of former rock shorelines exist at between +50 m and −100 m around the coast of Scotland (Fig. 4). Shore platforms are cut at sea level and when an area is not covered by glacier ice. The duration of the periods when sea level was at its present and slightly higher (+5 m OD) elevation since the last deglaciation has been brief in peripheral locations, but rock shorelines closer to the main Late Devensian ice centres have been reoccupied at different intervals during the Lateglacial and Holocene (Figs 4, 6). With the presently limited information on platform distribution and structural controls, it is appropriate to follow Sissons (Reference Sissons1981) and view inherited shore platforms as occupying broad altitudinal zones in relation to present sea level: submerged (SBRP) (<0 m OD), inter-tidal (ITRP) (0–3 m), raised (RRP) (3–10 m) and high rock platforms (HRP) (>10 m). Comparison with the history of the British–Irish Ice Sheet (BIIS) and the global mean sea level curves for the last glacial cycle (Fig. 5) allows consideration of when these groups of platforms may have formed or been reoccupied:
• SBRPs were likely extensively eroded during low sea level stands in MIS 3 and 5 (Fig. 5). The km-wide extent of SBRPs, as compared to the much narrower platforms found along the present coast, reflects the generally lower resistance of the sedimentary rocks found offshore, the long duration of low sea level phases in the Middle and Late Pleistocene and, perhaps also, intense winter frost action operating in the inter-tidal zone during cold intervals.
• Till-covered ITRPs at the Scottish coast (Fig. 3) have been attributed to formation in earlier interglacial periods (Wright Reference Wright1911), due to the brief period that sea level has been close to the present in the Holocene (Fig. 5). The Scottish ITRPs are regarded as essentially horizontal in gradient (Dawson Reference Dawson1984). Detailed surveys are few, however, and multiple platforms close to present sea level exist at localities such as Dunbar (Sissons Reference Sissons1974b; Hall Reference Hall1989) and more widely in western Scotland (Dawson Reference Dawson1980). Moreover, the prior occupation during the Lateglacial and Holocene of many modern shore platforms (Fig. 5) is a reminder that inherited ITRPs also may have been lowered and re-trimmed repeatedly by marine erosion before the last glaciation. Nonetheless, horizontal gradients and a position near to sea level are consistent with an interglacial age for inherited Scottish ITRP fragments, with global ice volumes close to those of the present (Fig. 5).
• Inherited RRPs across Scotland may also have had complex and different erosion histories. In peripheral locations such as the Outer Hebrides, where sea level has never been above its present level since the end of the last glaciation, RRPs may relate to high interglacial sea levels. RRPs on the inner coastlines of Scotland may have developed during periods when lower global mean sea level was accompanied by crustal loading from mountain ice caps covering western Scotland. Such intervals may have included the early parts of Pleistocene stadials, when the Scottish ice sheet expanded before the much larger Laurentide and Scandinavian ice sheets (Sissons Reference Sissons1981, Reference Sissons1982, Reference Sissons, Smith and Dawson1983; Sutherland Reference Sutherland1981b, Reference Sutherland1984a) or periods of sustained mountain ice cap development, such as in MIS 5b–d and MIS 3 (Fig. 5). Inherited, till-covered RRPs may date from earlier phases of rebound during the retreat of the MIS 4 and MIS 6 ice sheets.
• The high elevations of HRPs require profound isostatic depression by a thick ice sheet covering Scotland and so are likely to have formed only in brief phases of early ice sheet build-up and decay in MIS 4 and in late MIS 3 and 2 (Fig. 5).

Figure 4 Distribution and elevation of inherited elements in the coastline of Scotland. Numbered symbols: 1 = cliff; 2 = rock platform; 3 = till cover; 4 = glacially striated or roughened surface; 5 = raised beach gravel below till. Data sources: Shetland (Flinn Reference Flinn1969, Reference Flinn1973; Hansom Reference Hansom, May and Hansom2003a, Reference Hansom, May and Hansomb); Orkney (Berry Reference Berry2000); Buchan (Walton Reference Walton, Miller and Watson1959; Merritt et al. Reference Merritt, Auton, Connell, Hall and Peacock2003); Angus (Bremner Reference Bremner1925; Stoker & Graham Reference Stoker and Graham1985; Auton et al. Reference Auton, Gordon, Merritt and Walker2000); Outer Forth (Rhind Reference Rhind1965; Sissons Reference Sissons1967; Hall Reference Hall1989); Galloway (Jardine Reference Jardine1971, Reference Jardine, Kidson and Tooley1977; Sutherland Reference Sutherland, Gordon and Sutherland1993a); Kintyre (Gray Reference Gray1978, 1993); Islay (Dawson Reference Dawson1979, Reference Dawson1980, Reference Dawson1991, Reference Dawson, Dawson, Cooper, Gemmell and Bates1993a, Reference Dawson, Dawson and Edwardsb; Benn & Dawson Reference Benn and Dawson1987); Mull (Wright Reference Wright1911; McCann Reference McCann, Bowen, Carter and Taylor1968); Barra (Peacock Reference Peacock1984; Selby Reference Selby1987); St Kilda (Sutherland Reference Sutherland1984b); North Lewis (Peacock Reference Peacock1984; Sutherland & Walker Reference Sutherland and Walker1984; Hall Reference Hall1995). Includes unpublished data from A. M. Hall. The numbers on the map refer to sites listed in Figure 6.

Figure 5 Time intervals for formation of rock platforms in the Inner and Outer Hebrides. Greenland GRIP-2 ice core data (from GRIP Ice-Core Project Members 1993). Global sea level curve for the last glacial cycle from Cutler et al. (Reference Cutler, Edwards, Taylor, Cheng, Adkins, Gallup, Cutler, Burr and Bloom2003). Glaciation curve based on estimates of ice extent derived from ice core data (Clapperton Reference Clapperton and Gordon1997) and projected onto the SW–NE oriented main ice dome of the last ice sheet in Scotland. IS = ice sheet in Scotland extending onto neighbouring shelves; MIC = largely land-based mountain ice cap.

Figure 6 Duration of occupancy of the shoreline in the last 15 ka at mean sea levels of 0±2 m and 5±2 m OD. The periods of occupancy are from Shennan et al. (Reference Shennan, Bradley, Milne, Brooks, Bassett and Hamilton2006a). Locations of sites are shown on Figure 4.
Improved understanding of the origins and ages of inherited elements in the rock shorelines of Scotland must await detailed mapping, improved constraints on the exposure histories of rock platform surfaces and further dating of overlying sediments.
4. Late Devensian and Holocene relative sea levels before 2000 BP
[David Smith, Callum Firth and Jason Jordan]
4.1. Introduction
Since 1993, evidence for RSL change in the Late Devensian and Holocene has been published from over 30 site locations, involving over 90 separate sites (see Fig. 7). Here, these locations are summarised and briefly discussed (section 4.2) following which, patterns of RSLs are inferred and evidence for fault movement and shoreline dislocation is examined (section 4.3).

Figure 7 Site locations onshore from which evidence for Late Devensian and Holocene RSLs has been published since 1993.
4.2. New site locations published since 1993
4.2.1. N Scotland: Cape Wrath–Moray Firth, and the Northern Isles
(Fig. 7, site locations (sls) 1–6, 36). In northern Scotland, research has provided new information on both the mainland and the Orkney Islands, although crucially no further studies on Shetland, other than research on the Holocene Storegga Slide tsunami, (see section 6.2 below) have been published. In studies of Late Devensian RSLs, the work on RSLs and ice limits in the Moray Firth area reported in Gordon & Sutherland (Reference Gordon and Sutherland1993) was further developed by Merritt et al. (Reference Merritt, Auton and Firth1995), who recorded a fluctuating ice margin in the area but a progressive fall in RSL from 13 ka BP, with a sequence of glacio-isostatically tilted shorelines. On the N coast, Auton et al. (Reference Auton, Firth, Pearson and Spencer2005) identified shoreline fragments between 27 and 15m OD in Strath Halladale and Armadale Bay (Fig.7, sls 3, 4), whilst at Loch Eriboll (Fig. 7, site location (sl.) 1), Long et al. (Reference Long, Barlow, Dawson, Hill, Innes, Kelham, Milne and Dawson2016) traced RSL from a Lateglacial highstand at 6–8 m OD at 15 ka BP.
In studies of Holocene RSLs, a back-barrier environment at Scapa Bay on Orkney (Fig. 7, sl. 5) (de La Vega-Leinert et al. 2007) records a rise in RSL from −5.4 m OD at 9,675–9,277 BP to −0.6 m OD at 5,603–5,306 BP. At nearby Carness (Fig. 7, sl. 6), also behind a barrier (de la Vega-Leinert et al. 2012), a rise in RSL in the middle Holocene between 7,570–7,339 BP at −3.2 m OD and 6,726–5,751 BP at −1.7 m OD is recorded. On the mainland, in the lower Wick River valley (Fig. 7, sl. 2), Dawson & Smith (Reference Dawson, Benn, Dawson, Dawson and Dawson1997) identified a sequence of three successively younger Holocene estuarine deposits in stratigraphic order, with regressive overlaps dated at respectively 6,940–6,705 BP at 1 m OD, 2,390–1,115 BP (range of two dates) at 1.6–1.3 m OD and 1,220–805 BP (range of three dates) at 2.4–1.3 m OD (Fig. 8D). At Loch Eriboll (Fig. 7, sl. 1), Long et al. (Reference Long, Barlow, Dawson, Hill, Innes, Kelham, Milne and Dawson2016) traced the RSL rise in the Middle and Late Holocene to reach c.1 m OD between 7 ka and 3 ka BP, before falling to present levels. They identified evidence of transgressive overlaps after the peak of Holocene RSL rise in the area, but maintained that local coastal processes may have been responsible for these later events, and hence were unable to correlate the evidence from Loch Eriboll with the evidence from Wick River valley to the E. They argued that RSL change was broadly similar across the N coast of Scotland, implying similar ice loading across that area. The sites at Scapa Bay, Carness, Loch Eriboll and Wick collectively indicate declining isostatic uplift northwards from the northern mainland to the Orkney Islands, in broad agreement with both GIA (Bradley et al. Reference Bradley, Milne, Shennan and Edwards2011) and shoreline-based (Smith et al. Reference Smith, Fretwell, Cullingford and Firth2006, Reference Smith, Hunt, Firth, Jordan, Fretwell, Harman, Murdy, Orford and Burnside2012) models, as shown in Figures 13, 14 and 24, below.

Figure 8 Graphs of MHWST with OD equivalent for estuarine locations in the western Forth valley (A), Girvan (B), the Cree valley (C), Wick (D) and Harris (E), based on data from Dawson & Smith (Reference Dawson, Benn, Dawson, Dawson and Dawson1997), Smith et al. (Reference Smith, Wells, Mighall, Cullingford, Holloway, Dawson and Brooks2003a, Reference Smith, Cullingford, Mighall and Fretwell2007a, Reference Smith, Hunt, Firth, Jordan, Fretwell, Harman, Murdy, Orford and Burnside2012) and Jordan et al. (Reference Jordan, Smith, Dawson and Dawson2010). Local dates for the Holocene Storegga Slide tsunami are not plotted on these graphs. Altitudes are referenced to OD and the local equivalent present MHWST. Error margins are explained in the references quoted. See section 1.2 above for definitions of the points plotted.
4.2.2. E and SE Scotland: Moray Firth–Berwick-upon-Tweed
(Fig. 7, sls 7–14). In eastern and south-eastern Scotland, Peacock (Reference Peacock1999) described pre-Windermere Interstadial raised marine sediments from an area extending from St Fergus in the N to Berwick-upon-Tweed in the S (Fig. 9), and maintained that these were diachronous, beginning at 15–14 ka BP offshore and continuing to as recently as 13 ka BP in the Forth estuary. Later, Peacock (Reference Peacock2002, Reference Peacock2003) and Holloway et al. (Reference Holloway2002) described Windermere Interstadial marine deposits from the Tay and Forth areas. Peacock (Reference Peacock2003) examined the Errol Clay Formation marine deposits at Gallowflat claypit (Fig. 7, sl. 13) and Inchcoonans (Fig. 7, sl. 14), on the Tay estuary, and concluded that the deglaciation of the middle Tay estuary occurred between 14.5 ka and 14 ka BP from 14C and U–TH dating (Rowan et al. Reference Rowan, Duck and Black2001). Holloway et al. (Reference Holloway, Peacock, Smith and Wood2002) maintained from Windermere Interstadial marine deposits in the upper Forth valley that RSL may have lain at 15–20 m OD in that area, before falling during the Younger Dryas. Later, McCabe et al. (Reference McCabe, Clark, Smith and Dunlop2007a, Reference McCabe, Clark, Smith and Dunlopb), using AMS radiocarbon dates from in situ mono-specific foraminifera contained in marine muds at Lunan Bay (Fig. 7, sl. 10) and at Bertha Park, Perth (Fig. 7, sl. 11), maintained that the region was deglaciated before 21 ka BP and proposed that there had been two readvances of the ice sheet after the LGM in eastern Scotland: the Lunan Bay Readvance, dating to sometime between 20.2 ka BP and 18.2 ka BP, in which RSL W of the Lunan valley reached possibly 22 m OD, and the Perth Readvance, dating to between 17.5 ka BP and 14.5 ka BP, in which RSL reached up to 38 m OD in the Stirling area. They thus reasserted the concept of the Perth Readvance, originally proposed by Sissons (Reference Sissons1963, Reference Sissons1964), following Simpson (Reference Simpson1933). Peacock et al. (Reference Peacock, Armstrong, Browne, Golledge and Stoker2007) disagreed, arguing that the readvance limit in the Tay valley was questionable, but McCabe et al. (Reference McCabe, Clark, Smith and Dunlop2007b) pointed to the morphological and stratigraphical evidence for ice-contact features and outwash merging with shoreline terraces at the readvance limit. Evidence for ice sheet fluctuations may be reflected in changes in deposition of the St Andrews Bay Member of the Forth Formation offshore eastern Scotland, showing distinct pulses in sedimentation (Stoker et al. Reference Stoker, Golledge, Phillips, Wilkinson and Akhurst2008). The argument between Peacock et al. (Reference Peacock2007) and McCabe et al. (Reference McCabe, Clark, Smith and Dunlop2007a) reflects a contrast between the morphological and stratigraphical approach of Cullingford (Reference Cullingford, Gray and Lowe1977) and Cullingford & Smith (Reference Cullingford and Smith1980) and the mainly stratigraphical and biostratigraphical approach of Browne et al. (Reference Browne, Armstrong, Paterson and Aitken1981). The issues were debated by Smith & Cullingford (Reference Smith, Cullingford and Seymour1982) and Browne et al. (Reference Browne, Armstrong, Paterson and Aitken1982), and illustrate the need for an inclusive approach to RSL studies in which both morphological and stratigraphical work are seen as complementary.

Figure 9 Distribution of the Late Devensian, pre-Windermere Interstadial marine strata and associated glacigenic deposits and the adjacent sea area (the “Red Series” and Wee Bankie Formation), based on Peacock (Reference Peacock1999).
Research into Holocene RSL change in the Moray Firth area has focused on the Dornoch Firth (Fig. 7, sl. 7), where Smith et al. (Reference Smith, Firth, Turbayne and Brooks1992) and Firth et al. (Reference Firth, Smith, Hansom and Pearson1995) recorded evidence for an equivalent of the Main Buried Beach in SE Scotland, which they dated at 10,708–11,125 BP, followed by a rapid rise during which the Holocene Storegga Slide tsunami of 8.15 ka BP is registered. Further S, in the Ythan estuary (Fig. 7, sl. 12), Smith et al. (Reference Smith, Firth, Brooks, Robinson and Collins1999) documented a rapid rise in Early–Middle Holocene RSL. Later, Smith et al. (Reference Smith, Harrison and Jordan2013) attributed a noticeably rapid rise in RSL between 8,637–8,445 BP and 8,366–8,177 BP to the release of water from pro-glacial Lake Agassiz–Ojibway in North America (e.g., Barber et al. Reference Barber, Dyke, Hillaire-Marcel, Jennings, Andrews, Kerwin, Billodeau, McNeely, Southons, Morehead and Gagnon1999; Teller et al. Reference Teller, Leverington and Mann2002). This rise was followed by the Holocene Storegga Slide tsunami, dated there at sometime between 8,363 BP and 7,871 BP (range of two dates) (see Fig. 19 below). In the Forth lowland (Fig. 7, sls 8, 9, Fig. 8A), arguably the closest location studied to the centre of glacio-isostatic uplift in Scotland (Smith et al. Reference Smith, Davies, Brooks, Mighall, Dawson, Rea, Jordan and Holloway2010, Reference Smith, Hunt, Firth, Jordan, Fretwell, Harman, Murdy, Orford and Burnside2012), Robinson (Reference Robinson1993) identified sites disclosing Holocene RSL and provided detailed pollen, diatom and molluscan records. Near the head of the present Forth estuary, Paul et al. (Reference Paul, Peacock and Barrass1995, Reference Paul, Barras, Mein, Jardins, Potts and Higgins2004), Paul & Barrass (Reference Paul and Barrass1998) and Barrass & Paul (Reference Barrass and Paul1999), working on sediments at Bothkennar near Grangemouth, provided a sedimentary context for much of the work on Holocene RSL change in the Forth area. In the Forth lowland and estuary, RSL fell after the Younger Dryas through three buried estuarine levels (the High, Main and Low “Buried Beaches”, dated at between 11.7 ka BP and 9.7 ka BP) to a low point achieved during a relatively short period around 9.5 ka BP, after which the fall in RSL was reversed and a rise occurred, marked by evidence for the Holocene Storegga Slide tsunami at 8.15 ka BP, before culminating at 7.8 ka BP at the Main Postglacial Shoreline in the Forth valley. RSL subsequently fell further in the Forth valley to a prominent carseland terrace at 4.8 ka BP, the Blairdrummond Shoreline, but this shoreline overlaps the higher feature towards the periphery of uplift (Smith et al. Reference Smith, Davies, Brooks, Mighall, Dawson, Rea, Jordan and Holloway2010, Reference Smith, Hunt, Firth, Jordan, Fretwell, Harman, Murdy, Orford and Burnside2012).
4.2.3. SW Scotland: Solway Firth–Kintyre
(Fig. 7, sls 15–18). In SW Scotland, research since 1993 has focused on the Holocene. In the lower Cree valley (Fig. 7, sl. 15, Fig. 8C), Smith et al. (Reference Smith, Wells, Mighall, Cullingford, Holloway, Dawson and Brooks2003a) mapped three Holocene terraces across a carseland area of 20km2, with a buried terrace locally beneath. Radiocarbon dates of 9,711–9,539 BP and 9,528–9,026 BP were obtained for the −1.1 m to −0.5 m OD buried terrace, believed to correlate with one of the “Buried Beaches”. At the surface, visible terraces were correlated with later shorelines: dates of 7,560–7,251 BP and 7,209–6,752 BP were obtained for the Main Postglacial Shoreline, at 7.7–10.3 m OD, which is confined to the head of the valley; and 5,991–5,588 BP for the Blairdrummond Shoreline, the highest Holocene RSL over most of the valley (and locally overlying deposits of the Main Postglacial Shoreline), reaching 7.8–10.1 m OD at the mouth of the valley. Below these shorelines, a terrace correlated with the Wigtown Shoreline measured at 5.5–8.0 m OD is less securely dated at 3.1 ka BP. To the E, the Nith valley (Fig. 7, sl. 16) carselands occupy over 15km2 (Smith et al. Reference Smith, Wells, Mighall, Cullingford, Holloway, Dawson and Brooks2003b). Here, RSL is shown to have been rising at 8,640–8,170 BP (range of four dates) at 3.4–6.9 m OD; briefly falling at 8,190–7,610 BP (range of four dates) at 4.6–7.0 m OD, before resuming and culminating at 6,470–6,210 BP at 9.4 m OD. Subsequently, RSL fell to present, possibly in stages (Smith et al. Reference Smith, Wells, Mighall, Cullingford, Holloway, Dawson and Brooks2003b). From the inner Solway Firth, comparison between a site at Priestside Flow, near Annan (Fig. 7, sl. 17) on the N shore and sites on the S shore supports differential crustal movement between the two shores (Lloyd et al. Reference Lloyd, Shennan, Kirby and Rutherford1999). Along the Ayrshire coast and outer Firth of Clyde, the altitudes of raised coastal features are orthogonal to the isobase pattern shown in Figures 13 and 14 (Smith et al. Reference Smith, Cullingford, Mighall and Fretwell2007a). At Girvan (Fig.7, sl. 18, Fig. 8B), a buried surface reaching c.7.8 m OD was dated at 7,290–6,780 BP (range of two dates) and correlated with the Main Postglacial Shoreline, which is overlapped by deposits of a higher estuarine surface, reaching 8.6 m OD and dated at 4,140–3,900 BP, correlated with the Blairdrummond Shoreline (Fig. 8B). North of Girvan, where the Main Postglacial Shoreline becomes the highest Holocene shoreline, the fall in RSL is reflected in suites of terraces and barriers, notably on the Isle of Bute and the adjacent mainland.
Working at Blair's Croft in the Cree valley, Lawrence et al. (Reference Lawrence, Long, Gehrels, Jackson and Smith2016) have disclosed evidence for three rapid increases in RSL, which occurred at the time of the release of meltwater from pro-glacial Lake Agassiz–Ojibway in North America and are dated at 8.65 ka BP, 8.5 ka BP and 8,231–8,163 BP. Taken with the evidence for a rapid rise in RSL from the Ythan valley (Smith et al. Reference Smith, Firth, Brooks, Robinson and Collins1999, Reference Smith, Harrison and Jordan2013), and with possible evidence for an increase in RSL at a similar time in Skye (Selby & Smith Reference Selby and Smith2015, Reference Selby, Smith, Ballantyne and Lowe2016), it is likely that the effects of the discharge of the lake are registered widely around the Scottish coastline.
4.2.4. W and NW Scotland: Kintyre–Cape Wrath including the Hebrides
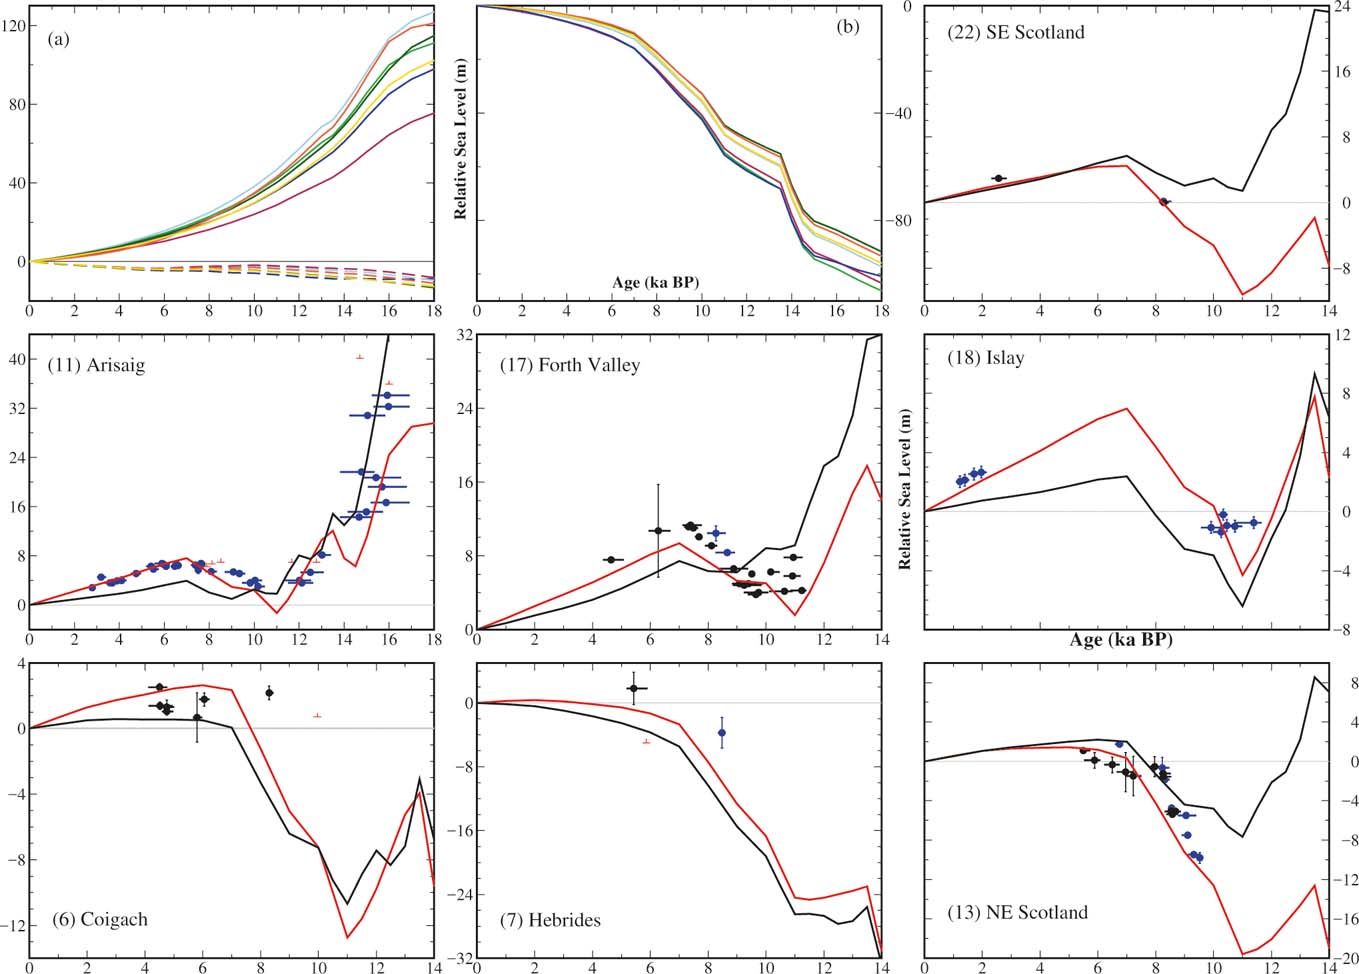
(Fig. 7, sls 19–35). Since 1993, much research on Late Devensian and Holocene RSL change in Scotland has been concentrated on the W and NW mainland, where from the Arisaig area, Shennan et al. (e.g., Reference Shennan, Innes, Long and Zong1993, Reference Shennan, Innes, Long and Zong1994, Reference Shennan, Innes, Long and Zong1995a, Reference Shennan, Innes, Long and Zongb, Reference Shennan, Hamilton, Hillier and Woodroffe2005, Reference Shennan, Bradley, Milne, Brooks, Bassett and Hamilton2006a) compiled the longest dated record of Late Devensian and Holocene RSL change in the UK (Figs 10D, 22(11)).

Figure 10 Graphs of RSL (relative to the reference water level identified in the original papers) for isolation basin and coastal wetland sites at Assynt and Coigach (A), Loch Alsh and Loch Duich, Kintail (B), Kentra Moss (C), the Arisaig area (D) and Knapdale, Kintyre (E), based on data from Shennan et al. (Reference Shennan, Lambeck, Horton, Innes, Lloyd, McArthur, Purcell and Rutherford2000a, Reference Shennan, Hamilton, Hillier, Hunter, Woodall, Bradley, Milne, Brooks and Bassett2006b) and Hamilton et al. (Reference Hamilton, Lloyd, Barlow, Innes, Flecker and Thomas2015). Equivalent OD values and error margins are explained in the references quoted. See section 1.2 above for definitions of the points plotted.
In the N of this area, isolation basin sites in Eddrachillis Bay, at Duart Bog and Loch Duart marsh (Fig. 7, sl. 19) were examined by Hamilton et al. (Reference Hamilton, Lloyd, Barlow, Innes, Flecker and Thomas2015), who found a Holocene highstand at below 2.4 7±0.59 m OD. They maintain that GIA models need to incorporate thicker ice in the NW sector of the BIIS to explain the values for RSL obtained for the timing of the Lateglacial fall and early Holocene RSL rise there. Further south, at Coigach (Fig. 7, sl. 20), N of Ullapool, Shennan et al. (Reference Shennan, Lambeck, Horton, Innes, Lloyd, McArthur, Purcell and Rutherford2000a) examined coastal wetland and back barrier sites at Dubh Lochan, Loch Raa and Badentarbat, where they found the Holocene highstand reaching “no more than ∼2.5m above present”, the highest level having been reached at Loch Raa at 4,804–4,354 BP and slightly lower at Dubh Lochan at 6,192–5,913 BP (Fig. 9A).
Further south, in Applecross (Fig. 7, sl. 21) on Loch Torridon, at Fearnbeg, an isolation basin, the Middle Holocene maximum lies below 5.7 m OD, while 3 km to the NW at Fearnmore, in a raised tidal marsh, the highest Holocene RSL index point was identified at 5.17 m OD at 4,839–4,444 BP (Shennan et al. Reference Shennan, Lambeck, Horton, Innes, Lloyd, McArthur, Purcell and Rutherford2000a). At Kintail (Fig. 7, sl. 22, Fig. 10B), Shennan et al. (Reference Shennan, Lambeck, Horton, Innes, Lloyd, McArthur, Purcell and Rutherford2000a, Reference Shennan, Bradley, Milne, Brooks, Bassett and Hamilton2006a) obtained a series of RSL index points from Loch Alsh and Loch Duich. From the head of Loch Duich at the Loch nan Corr isolation basin, with a threshold at 2.70 m OD, they interpreted maximum RSL as having been achieved at 8,131–7,916 BP (range of two dates) and on Loch Alsh, in an isolation basin at Nostie, a date of 2.7–2.1 ka BP for the cessation of tidal influence at c.6.36–6.56 m OD (the elevation range may be greater) was obtained. At Kirkton, W of Nostie, the Late Holocene RSL fall was taking place across a surface of sand and gravel at c.3.0–3.8 m OD by 1,503–1,816 BP. Given the spread of sites, in which the head of Loch Duich lies c.10–12 km nearer the area of maximum glacio-isostatic uplift than Kirkton and Nostie, the graph in Figure 9B is only a general indication of RSL change over the area involved.
Farther S, at Arisaig (Fig. 7, sl. 23, Fig. 10D), where much of the work on isolation basins in Scotland has been concentrated, a record of RSL change has been obtained in which the marine limit reached as high as 36.5±0.4 m OD as early as 16,220–15,458 BP at Upper Loch Dubh. This was followed by an apparently uninterrupted fall (Shennan et al. Reference Shennan, Green, Innes, Lloyd, Rutherford and Walker1996a, Reference Shennan, Rutherford, Innes, Walker, Andrews, Austin, Bergsten and Jenningsb), thought to have continued to the early Holocene, although believed to have slowed during the Younger Dryas, during which RSL remained within a narrow height range for some time (Shennan et al. Reference Shennan, Lambeck, Horton, Innes, Lloyd, McArthur, Purcell and Rutherford2000a), enabling the formation of the marked cliff and platform of that age originally identified by Sissons (Reference Sissons1974a) as the Main Lateglacial Shoreline. The subsequent rise to the Holocene maximum was followed by an episode during which RSL is believed to have occurred within c.1 m over an extended period from 8 ka–5 ka BP (Shennan et al. Reference Shennan, Lambeck, Horton, Innes, Lloyd, McArthur, Purcell and Rutherford2000a), perhaps with a slight peak of c.1000 years centred on 7.6 ka–7.4 ka BP (Shennan et al. Reference Shennan, Hamilton, Hillier and Woodroffe2005). At Kentra Moss (Fig. 7, sl. 24, Fig. 10C), a coastal marsh and peat moss where biogenic sediments overlie outwash deposits, the fall from 7.7 m OD at 4,471–4,462 BP is apparently uninterrupted to present (Shennan et al. Reference Shennan, Innes, Long and Zong1995b).
The most southerly study is from Knapdale, Kintyre (Fig. 7, sl. 25, Fig. 10E), where from isolation basin and coastal wetland sites, Shennan et al. (Reference Shennan, Hamilton, Hillier, Hunter, Woodall, Bradley, Milne, Brooks and Bassett2006b) recorded a limiting date for falling RSL of 17,910–16,770 BP at 30.5±1.1 m OD to less than 9.6±0.3 m OD at c.12,780–11,440 BP (range of two dates), before rising then falling after 5,650–5,490 BP at 8.0±0.6 m OD, or 4,830–4,530 BP at 10.1±0.2 m OD to present. Shennan et al. (Reference Shennan, Hamilton, Hillier, Hunter, Woodall, Bradley, Milne, Brooks and Bassett2006b) expressed some uncertainty about the oldest date, because the area is in a limestone catchment and the sample was from the base of the dated organic horizon, directly overlying inorganic material, and this appears to have been later confirmed in reconstructions of ice sheet retreat (e.g., Clark et al. Reference Clark, Hughes, Greenwood, Jordan and Sejrup2012; Finlayson et al. Reference Finlayson, Fabel, Bradwell and Sugden2014), which show the area occupied by ice at the time.
Apart from evidence for RSL change, sites in the Arisaig area provide information on climate and oceanic circulation changes from the foraminiferal and dinoflagellate cyst record in the context of pollen and diatom records. In a landmark study, Shennan (Reference Shennan1999) sought to identify evidence for post-LGM meltwater pulses from the detailed record of RSL change at isolation basins in the Arisaig area. Whilst no evidence for Meltwater Pulse 1B could be inferred from the record, Shennan (Reference Shennan1999) maintained that Meltwater Pulse 1A may be present, although no firm evidence could be found in the isolation basin sediments. Shennan (Reference Shennan1999) provided a constraining estimate of c.22 mm/yr for the increase in RSL rise at 14 ka BP, later revised to c.30 mm/year (Shennan et al. Reference Shennan, Hamilton, Hillier and Woodroffe2005, Reference Shennan, Hamilton, Hillier, Hunter, Woodall, Bradley, Milne, Brooks and Bassett2006b). Globally, estimates for the rise during Meltwater Pulse 1A range up to 80 mm/yr (e.g., Liu et al. Reference Liu, Milliman, Gao and Cheng2004; Deschamps et al. Reference Deschamps, Durand, Bard, Hamelin, Camoin, Thomas, Henderson, Okuno and Yokoyama2012; Lambeck et al. Reference Lambeck, Rouby, Purcell, Sun and Sambridge2014), but the work at Arisaig indicates that at least at far-field locations, the rise during Meltwater Pulse 1A may have been at the lower end of the range quoted, perhaps for near-field sites half the range predicted by Fairbanks (Reference Fairbanks1989, Reference Fairbanks1990).
In the Inner Hebrides, on Skye, Selby et al. (Reference Selby, Smith, Dawson and Mighall2000) and Selby & Smith (Reference Selby and Smith2007, Reference Selby and Smith2015, Reference Selby, Smith, Ballantyne and Lowe2016) described evidence from both back-barrier environments and isolation basins. Isolation basins on the Sleat peninsula at Inver Aulavaig (Fig. 7, sl. 26) and Point of Sleat (Fig. 7, sl. 27) provide evidence for RSL change, although the basal dates from sediments directly overlying Durness limestone are questionable. At Inver Aulavaig, estuarine conditions already present in the basin at 9,030–7,960 BP withdrew after 6,387–6,024 BP, but were reintroduced between 3,638–3,382 BP and 3,459–3,253 BP before again withdrawing. In the nearby back-barrier site of Peinchorran (Fig. 7, sl. 28), estuarine conditions are replaced by a freshwater environment between 7,610-7,335 and 4,868-4,551 BP. Other back barrier sites at Ardmore (Fig. 7, sl. 29) and Lyndale (Fig. 7, sl. 30) were also studied and, taken together, these several sites record possibly two falls in the rising Middle–Late Holocene RSL in the area. To the E, on the mainland, a fluctuation is recorded at Loch nan Eala, Arisaig, where a brief episode of freshwater conditions replaced an estuarine environment at 7,579–7,435 BP (Shennan et al. Reference Shennan, Innes, Long and Zong1994). In contrast, at Gruinart Flats on Islay (Fig. 7, sl. 31), Dawson et al. (Reference Dawson, Long and Smith1998) concluded that evidence supports RSL having departed little from c.4–5 m OD between 7 ka BP (by inference from nearby Colonsay dates) and 2 ka BP, although no dates from Islay supporting the start of this period are offered, and the record they quote contrasts sharply with the modelled record in Figure 22(18).
From Lismore (Fig. 7, sl. 32), Stone et al. (Reference Stone, Lambeck, Fifield, Evans and Creswell1996) obtained cosmogenic 36Cl dates for the Main Rock Platform (Main Lateglacial Shoreline), which lies at 7–8 m OD in that area, and is believed to have been formed during the Younger Dryas (Dawson Reference Dawson, Long and Smith1988). They obtained dates younger than expected (10,400±900 BP to 8,900±1,100 BP), but maintained that “shielding” of the platform by the higher Holocene RSL may explain the age obtained and estimate an age of between 12,200+1,900/−1,500 BP and 10,500+1,600/−1,400 BP.
In the Outer Hebrides, a rise in RSL from at least the Middle Holocene to present is recorded from coastal wetland areas at Horgabost (Fig. 7, sl. 33) and Northton (Fig. 7, sl. 34), Harris (Fig. 8E), where at least two transgressive overlaps at 5,450–4,861 BP at −0.5 m to 1.6 m OD and 3,375–1,948 BP (range of two dates) at −0.3 m to 2.3 m OD, respectively, and a possible extreme flooding event occurred in the Middle Holocene, dated at 8,348–7,982 BP and crossing a threshold at −0.1 m OD (Jordan et al. Reference Jordan, Smith, Dawson and Dawson2010). The flood could relate to the Holocene Storegga Slide tsunami or to the discharge of Lake Agassiz–Ojibway, but as yet its origin is unclear.
4.3. Late Devensian and Holocene RSL changes in Scotland before 2000BP
4.3.1. Late Devensian RSLs
Following the LGM, as decay of the BIIS took place, the varied topography beneath was progressively revealed. Along emerging coastal areas, irregularities in topography were occupied by sediment accumulations, whilst at coastal glacier margins, suites of outwash terraces and related shoreline terraces formed as sea level changes occurred against the background of glacio-isostatic uplift. Shoreline sequences formed during ice recession rise in elevation towards the area of greatest uplift (e.g., Smith Reference Smith and Gordon1997, fig. 12.3), but research since 1993 has provided few radiometric dates that can be directly related to shorelines reached as ice retreated. The only reliable dates are those for the Wester Ross Readvance, with which the Wester Ross Shoreline of Sissons & Dawson (Reference Sissons and Dawson1981) is closely related. Ballantyne et al. (Reference Ballantyne, Schnabel and Xu2009) originally dated the Wester Ross Readvance to a mean age of 13.47±1.30 ka, later recalibrated to between 14.34±0.84 ka and 15.09±0.87 ka (Ballantyne & Stone Reference Ballantyne and Stone2012). Ballantyne & Small (in press, this volume) provide an uncertainty-weighted mean age of 15.3 ± 0.7 ka for the Wester Ross Readvance. Otherwise, available dates for RSL change during this period are from sedimentary sequences from which RSL is inferred (e.g., Peacock Reference Peacock1999; McCabe et al. Reference McCabe, Clark, Smith and Dunlop2007a), or from isolation basins. Isolation basins provide the most consistent and reliable record of RSL change during this period (e.g., Shennan et al. Reference Shennan, Lambeck, Horton, Innes, Lloyd, McArthur, Purcell and Rutherford2000a, Reference Shennan, Hamilton, Hillier and Woodroffe2005), and may contain evidence of Meltwater Pulse 1A (Shennan Reference Shennan1999; Shennan et al. Reference Shennan, Hamilton, Hillier and Woodroffe2005).
The Younger Dryas is associated with RSL marked by the Main Rock Platform on the W coast and the related Buried Gravel Layer on the E coast: the Main Lateglacial Shoreline. The extent of the Main Lateglacial Shoreline, as originally shown by Sissons (Reference Sissons1974a), Gray (Reference Gray1978), Dawson (Reference Dawson1980) and Firth et al. (Reference Firth, Smith and Cullingford1993), together with the dates obtained by Stone et al. (Reference Stone, Lambeck, Fifield, Evans and Creswell1996) and the observations that in the Arisaig area at least, RSL lay between mean tide level and MHWST for a “long period” during the Younger Dryas (Shennan et al. Reference Shennan, Lambeck, Horton, Innes, Lloyd, McArthur, Purcell and Rutherford2000a), are evidence for the significance of this feature. A Gaussian quadratic trend surface isobase model (Fretwell Reference Fretwell2001) for the Main Lateglacial Shoreline depicts a centre of glacio-isostatic uplift in the SW Grampian Highlands (Fig. 11).

Figure 11 Isobases in metres MHWST for the Main Lateglacial Shoreline, based upon a shoreline-based Gaussian quadratic trend surface, with a mean absolute residual of 0.97 m. From Fretwell (Reference Fretwell2001) with permission.
4.3.2. Holocene RSLs
Shennan et al. (Reference Shennan, Lambeck, Horton, Innes, Lloyd, McArthur, Purcell and Rutherford2000a) depict the episode of consistent RSL during the Younger Dryas being exceeded by a rise in Holocene RSL in the Arisaig area, the local equivalent of the global Early Holocene sea level rise (Smith et al. Reference Smith, Harrison, Firth and Jordan2011). In eastern Scotland, the rise is widely recognised from the deposition of estuarine sediments across the Buried Gravel Layer (e.g., Sissons Reference Sissons1974a). During the subsequent fall in RSL, as glacio-isostatic uplift initially exceeded global mean sea level rise, at least three terraces (the “Buried Beaches” described above) were formed. Possible equivalent horizons have been identified in the Dornoch Firth (Smith et al. Reference Smith, Firth, Turbayne and Brooks1992) and in the Cree valley (Smith et al. Reference Smith, Wells, Mighall, Cullingford, Holloway, Dawson and Brooks2003a). A marked change after the “Buried Beach” sequence from a falling to a rising RSL (as global mean sea level rise exceeded local uplift) took place over a relatively short period, between 9.7 ka BP and 9.2 ka BP, near the area of maximum uplift (Smith et al. Reference Smith, Hunt, Firth, Jordan, Fretwell, Harman, Murdy, Orford and Burnside2012). During the rise, up to three discharges from Lake Agassiz–Ojibway reached Scottish coasts (Smith et al. Reference Smith, Firth, Brooks, Robinson and Collins1999; Lawrence et al. Reference Lawrence, Long, Gehrels, Jackson and Smith2016) and following this, the Holocene Storegga Slide tsunami of 8.15 ka BP occurred (see section 6.2 below). Currently available dates from the culmination of the rise in RSL in Scotland range between 6.2 ka BP and 7.8 ka BP, the older dates being generally nearer the centre of glacio-isostatic uplift, where they are associated with the Main Postglacial Shoreline (e.g., Smith et al. Reference Smith, Hunt, Firth, Jordan, Fretwell, Harman, Murdy, Orford and Burnside2012), and younger dates towards the periphery of the uplifted area, as Wright's (Reference Wright1914) theory envisaged. At the periphery, the Main Postglacial Shoreline is overlapped by two later shorelines (Smith et al. Reference Smith, Hunt, Firth, Jordan, Fretwell, Harman, Murdy, Orford and Burnside2012). Dates from conformable contacts at all three shorelines cluster in groups (Fig. 12). Shoreline-based Gaussian quadratic trend surface models showing isobases for the Main Postglacial and Blairdrummond shorelines are shown in Figure 13. The separation in altitude of the shorelines decreases away from the area of greatest uplift, with the shorelines ultimately being reversed in altitude in peripheral areas. This is supported by the field evidence. Thus, the Main Postglacial Shoreline in the Forth valley lies c.4 m above the next lowest shoreline (the Blairdrummond) there (Smith et al. Reference Smith, Davies, Brooks, Mighall, Dawson, Rea, Jordan and Holloway2010), but is c.1 m below the Blairdrummond Shoreline in the Cree valley (Smith et al. Reference Smith, Wells, Mighall, Cullingford, Holloway, Dawson and Brooks2003a); whilst in the Wick River valley, the equivalent horizon lies below two later transgressive overlaps (Dawson & Smith Reference Dawson, Benn, Dawson, Dawson and Dawson1997). From these relationships, it follows that there will be a zone around the uplift centre where the shorelines merge, before overlapping further away. Shennan et al. (e.g., Reference Shennan, Hamilton, Hillier and Woodroffe2005) remark on a “flat peak” in the RSL graph for the Middle Holocene in the isolation basin sites in western and northwestern Scotland (which are not at the centre of uplift and therefore more likely to exhibit gradual change in the Middle Holocene), and interpret this “flat peak” as evidence in the global mean sea level record of a gradual, rather than sudden, end to Antarctic ice melting. The shoreline evidence is not inconsistent with this, given the close separation of shorelines away from the area of greatest uplift in the Forth valley.

Figure 12 Graph of radiometric dates for Holocene shorelines in Scotland (except for the Holocene Storegga Slide tsunami shoreline). The dates cluster in three groups, although dates for the Wigtown Shoreline are so few that the age of this feature can only be regarded as provisional. Reprinted from Smith et al., Quaternary Science Reviews Reference Smith, Hunt, Firth, Jordan, Fretwell, Harman, Murdy, Orford and Burnside2012, vol. 54: Patterns of Holocene relative sea level change in the North of Britain and Ireland. With permission from Elsevier. For full details, see references.

Figure 13 Isobases in metres MHWST for the Main Postglacial (A) and Blairdrummond (B) shorelines based on shoreline-based Gaussian quadratic trend surfaces with mean absolute residuals of respectively 0.39 m and 0.32 m. Reprinted from Smith et al., Quaternary Science Reviews Reference Smith, Hunt, Firth, Jordan, Fretwell, Harman, Murdy, Orford and Burnside2012, vol. 54: Patterns of Holocene relative sea level change in the North of Britain and Ireland. With permission from Elsevier. For full details, see references.
Figure 14A–C shows Gaussian quadratic trend surface isobase models for the three visible Holocene raised shorelines of Smith et al. (Reference Smith, Hunt, Firth, Jordan, Fretwell, Harman, Murdy, Orford and Burnside2012), centred on a common centre and axis, and Figure 14D shows areas where each of the three shorelines proposed is the highest displaced shoreline above MHWST along the Scottish coastline. The form of the shoreline-based Gaussian trend surface models for both Younger Dryas and Holocene shorelines is close to that of the GIA models of Bradley et al. (Reference Bradley, Milne, Shennan and Edwards2011; Figs 23, 24 below), and implies little change in the spatial pattern of glacio-isostatic uplift at least since the Younger Dryas.

Figure 14 Isobases in metres MHWST for the Main Postglacial (A), Blairdrummond (B) and Wigtown (C) shorelines, according to shoreline-based Gaussian quadratic trend surface models based on a common axis and centre, with mean absolute residuals of 0.50 m, 0.44 m and 0.33 m, respectively, based on Smith et al. (Reference Smith, Hunt, Firth, Jordan, Fretwell, Harman, Murdy, Orford and Burnside2012). (D) areas where the Main Postglacial, Blairdrummond and Wigtown shorelines are the highest visible shoreline, based on the models in (A–C). Shaded bands about the shoreline overlaps are derived from the range of 95 % of residual values of the surface altitudes computed.
4.3.3. Uplift rates from empirical evidence
Firth & Stewart (Reference Firth, Collins and Smith2000) compared relative sea level graphs with regional mean sea level changes, to determine estimates of the magnitude and rate of crustal movement (Table 1). The errors associated with each element of the calculation resulted in considerable ranges for a particular period, but they suggest that rates of uplift increased from 4.5–26 mm/yr during the early Lateglacial to 14.4–31.5 mm/yr later in this period. Following this, rates of uplift have been reducing, from 4.0–7.3 mm/yr in the Early Holocene to 0.4–4.8 mm/yr in the Middle Holocene. However, reassessment of the Holocene RSL data by Firth & Stewart (Reference Firth, Collins and Smith2000), to take account of the decay in glacio-isostatic uplift according to Firth et al. (Reference Firth, Smith and Cullingford1993, Reference Firth, Smith, Hansom and Pearson1995, Reference Firth, Collins and Smith1997), indicates that the current rates of uplift are between 0.2–1.0±0.1 mm/yr near the centre and 0.2–0.1 mm/yr near the margin.
Table 1 Estimates of rates of crustal uplift (mm/yr) for selected sites in Scotland, based on Firth & Stewart (Reference Firth, Collins and Smith2000). Rates of uplift for Arisaig are based on a RSL graphs derived from Shennan et al. (Reference Shennan, Innes, Long and Zong1995a, Reference Shennan, Innes, Long and Zongb, Reference Shennan, Hamilton, Hillier and Woodroffe2005, Reference Shennan, Bradley, Milne, Brooks, Bassett and Hamilton2006. Rates for other sites are based on estimates from Sissons (Reference Sissons1974), McCabe et al. (Reference McCabe, Clark, Smith and Dunlop2007) and Smith et al. (Reference Smith, Hunt, Firth, Jordan, Fretwell, Harman, Murdy, Orford and Burnside2012). Uncertainties relating to the ages of Late Devensian features and global mean sea level changes result in the large ranges in the estimates.

4.3.4. Younger Dryas crustal redepression
Shoreline studies have previously been used to imply that the growth of the Younger Dryas ice mass may have retarded glacio-isostatic uplift (Boulton et al. Reference Boulton, Peacock, Sutherland and Craig1991) or even redepressed the crust (Sutherland Reference Sutherland1981a, Reference Sutherland1984a; Firth, Reference Firth1986, 1989; Firth et al. Reference Firth, Smith and Cullingford1993) and shifted the centre of uplift (Gray Reference Gray, Smith and Dawson1983). Localised crustal redepression was proposed by Firth (Reference Firth1986, Reference Firth1989), based on the sequence of lacustrine shorelines at the southern end of Loch Ness which indicated a 3-m rise in loch level. More widespread redepression of the crust was implied from regional shoreline gradients (Sutherland Reference Sutherland1981a, Reference Sutherland1984a; Firth Reference Firth1989; Firth et al. Reference Firth, Smith and Cullingford1993), with certain Late Devensian shorelines having a lower regional gradient than the Younger Dryas Main Lateglacial Shoreline. However, Firth & Stewart (Reference Firth, Collins and Smith2000) noted that the gradient of the Main Lateglacial Shoreline in the inner Moray Firth was significantly steeper than the Younger Dryas raised lacustrine shorelines around Loch Ness. They concluded that the Main Lateglacial Shoreline may be a time-transgressive feature and that its gradient was not solely the product of glacio-isostatic tilting. The widespread redepression of the crust during the Younger Dryas thus remains unproven. Indeed, GIA models for both the Younger Dryas and Holocene suggest that the growth of ice would have had minimal impact on patterns and rates of uplift (e.g., Lambeck Reference Lambeck, Sabadini, Lambeck and Boschi1991a, Reference Lambeckb, Reference Lambeck1995; Bradley et al. Reference Bradley, Milne, Shennan and Edwards2011; Kuchar et al. Reference Kuchar, Milne, Hubbard, Patton, Bradley, Shennan and Edwards2012).
4.3.5. Fault movement and shoreline dislocation
The study of tilted shorelines has been used to suggest that localised crustal movements had taken place which involved block uplift and dislocation of marine and lacustrine shorelines (Sissons Reference Sissons1972; Gray Reference Gray1974, Reference Gray1978; Sissons & Cornish Reference Sissons and Cornish1982; Firth Reference Firth1986; Ringrose Reference Ringrose1989). The number of dislocations and block crustal movements was limited and they tended to be associated with the reactivation of pre-Quaternary fault lines.
A more systematic assessment of Quaternary neotectonic activity was undertaken by Davenport & Ringrose (Reference Davenport, Ringrose, Jones and Preston1987), Fenton (Reference Fenton1991), Ringrose et al. (Reference Ringrose, Hancock, Fenton, Davenport, Foster, Culshaw, Cripps, Little and Moon1991) and Fenton & Ringrose (Reference Fenton, Ringrose and Fenton1992). Morphological mapping of pre-Quaternary faults identified neotectonic features such as pop-up scarps, striations, fault gouges, offset surfaces (e.g. shorelines), deflected or offset drainage channels and landslides, which were interpreted as evidence of recent crustal movements. The deflected/offset drainage channels were used to suggest that significant Late Devensian/Holocene lateral fault movement (15–200 m displacement) had occurred at a large number of sites in the Western Highlands. The scale of the movement indicated that the lateral movements would have been achieved through the repeated reactivation of the faults, with each displacement associated with a major earthquake. The number of active faults implied that many of the shorelines and sea level change sites may have been affected by local crustal movements.
Firth & Stewart (Reference Firth, Collins and Smith2000) and Stewart et al. (Reference Stewart, Firth, Rust, Collins and Firth2001) reassessed the evidence associated with several of the proposed active faults in the Western Highlands. They concluded that the deflected/offset drainage channels could be explained either by fluvial systems exploiting the weaker rocks within the fault zone or by more limited vertical movements (1–2 m displacement) associated with discrete tectonic events. They concluded that a large number of pre-existing faults were reactivated by vertical movements during deglaciation, but that the scale of the displacement was limited (e.g. <3 m). The reactivation appears to have been most pronounced near the margins of the Younger Dryas ice cap (Firth & Stewart Reference Firth, Collins and Smith2000) and in fault-aligned valleys/firths, with the valley floor, where the ice was thickest, moving upward relative to the surrounding high land, where the ice was relatively thin. It is noteworthy that historical earthquake activity mainly occurs in the Western Highlands, the Central Lowlands and around Dumfries and Lockerbie (Musson Reference Musson2007). If a similar pattern of tectonic activity occurred in the past, then neotectonic features may only occur in these areas.
Firth & Stewart (Reference Firth, Collins and Smith2000) indicated that due to the fragmentary nature of many shorelines and the variations in altitude along particular fragments, it would only be possible to identify dislocations which exceeded 0.8 m on well-defined shorelines (e.g., Holocene features and the Main Lateglacial Shoreline) and which are more than 2.5 m on less-well-defined Late Devensian shoreline sequences. Their review of the nine sites where local irregularities in patterns of uplift had been reported suggested that only four provided firm evidence of dislocations (Glen Roy; Forth valley; Port Donain, North Mull) or variations in patterns of uplift (Forth valley; Loch Ness; North Mull) and one (Cree estuary) required further evaluation. The Blairdrummond Shoreline in the lower Cree valley and estuary is marked by an area of increased slope southward on both sides of the valley at c.9.5–8.5 m in the E and c.9–8 m in the W (Smith et al. Reference Smith, Wells, Mighall, Cullingford, Holloway, Dawson and Brooks2003a). The steeply sloping sections were initially thought to align with pre-existing faults, but recent mapping in the area indicates that this is not the case, and that local patterns of sedimentation probably explain these changes.
The three dislocated marine shorelines identified by Firth & Stewart (Reference Firth, Collins and Smith2000) are shown in Figure 15. The dislocations coincide with pre-Quaternary faults, implying that pre-existing zones of tectonic weakness were being reactivated during glacio-isostatic uplift. The scale of the dislocations (1–2.7 m) suggests that they resulted from one or two tectonic events (e.g., earthquakes) which occurred after the morphological feature concerned had formed. The majority of the features are associated with Younger Dryas shorelines. However, the features in the Forth valley are Early to Middle Holocene in age, which indicates that differential movements continued during the Holocene. Firth et al. (Reference Firth, Smith and Cullingford1993) initially proposed that given the close proximity of most of the shoreline dislocations to the Younger Dryas ice margin, they may be related to crustal stresses resulting from the growth of the ice cap, a view supported by the close association between rock slope failures and Stadial ice limits reported by Holmes (Reference Holmes1984). However, neotectonic features (Kinloch Hourn, Stewart et al. 2001; South Raasay, Smith et al. Reference Smith, Stewart, Harrison and Firth2009) and rock-slope failures (Ballantyne & Stone Reference Ballantyne and Stone2013) have subsequently been identified at sites away from the margins of the Stadial ice cap. Recent studies of rock slope failures may be of value in determining the magnitude and periodicity of uplift-driven seismic events in the Lateglacial and Holocene and, thus, corroborative evidence of shoreline dislocation. Ballantyne et al. (Reference Ballantyne, Wilson, Gheorghiu and Rodés2014) and Cave & Ballantyne (Reference Cave and Ballantyne2016) have argued that many of the failures were triggered by fault reactivation caused by crustal rebound. Whilst the magnitude of the seismic events has not been quantified, it seems likely that surface faulting would have occurred particularly in the seismically active Highlands of Scotland (Musson Reference Musson2007) and such events may have dislocated shorelines and displaced sea level index points.

Figure 15 Shoreline dislocations and the Younger Dryas ice cap in the Highlands. The glacial limits are derived from numerous sources. Shoreline gradients are derived by linear regression from data plotted along the directions indicated: (A) Forth Valley; (B) North Mull; (C) Port Donain, Mull. Based on Firth & Stewart (Reference Firth, Collins and Smith2000).
5. Relative sea level changes during the last 2000 years
[Natasha Barlow]
The focus of Scottish sea level research to constrain patterns of post-LGM GIA, and reconstruct the maximum extent and timing of deglaciation of the former BIIS, means that research into the evidence for sea level changes during the last 2000 years has received relatively little attention. Middle and, occasionally, Late Holocene sea level index points have been used to extrapolate rates of RSL change during the last 1000–4000 years (Shennan & Horton Reference Shennan, Peltier, Drummond and Horton2002; Shennan et al. Reference Shennan, Milne and Bradley2009; Gehrels Reference Gehrels2010), although there is relatively little directly dated evidence of sea level during this time. Ongoing late Holocene isostatic uplift around much of Scotland (see Fig. 23 below) restricts the available accommodation space for the accumulation of coastal sediment sequences that may record recent changes in sea level, further compounded in locations of hard bedrock and steep relief (e.g., NW Scotland) which do not provide much fine-grained sediment needed to accumulate at the head of lochs and sheltered bays. The few Late Holocene sea level index points from Wick (Dawson & Smith Reference Dawson, Benn, Dawson, Dawson and Dawson1997), Kentra Moss (Shennan et al. Reference Shennan, Innes, Long and Zong1995b), Islay (Dawson et al. Reference Dawson, Dawson and Edwards1998) and NW Sutherland (Barlow et al. Reference Barlow, Long, Saher, Gehrels, Garnett and Scaife2014; Long et al. Reference Long, Barlow, Dawson, Hill, Innes, Kelham, Milne and Dawson2016), along with the extrapolated rates from numerous other locations (e.g., Shennan & Horton Reference Shennan, Peltier, Drummond and Horton2002), show sea level during the last 2000 years around Scotland has generally been falling or has been near stable. This relative stability provided an opportunity for the development of coastal sand dune systems, in particular associated with the cooling and increased storminess of the Little Ice Age (Gilbertson et al. Reference Gilbertson, Schwenninger, Kemp and Rhodes1999; Dawson et al. Reference Dawson, Smith, Jordan and Dawson2004; Sommerville et al. Reference Sommerville, Hansom, Housley and Sanderson2007), and coastal spit and barrier formation, for example at the Dornoch Firth (Firth et al. Reference Firth, Smith, Hansom and Pearson1995).
Reconstructions of past sea level in Scotland have typically followed the framework of dating transgressive and regressive sediment overlaps which record changes in the proximity of marine conditions. For example, in the lower Wick River valley, Dawson & Smith (Reference Dawson, Benn, Dawson, Dawson and Dawson1997) provide evidence of a slight RSL rise from c.AD 780 to present as a brown-grey clay containing brackish water diatoms replacing a freshwater peat in the uppermost part of the sequence. More recently, there have been efforts to develop near-continuous records of past sea level from coastal salt marsh cores, rather than discontinuous records from dated sediment boundaries, to provide a detailed picture of the spatial and temporal pattern of Late Holocene sea level changes globally (e.g., as summarised in Kopp et al. Reference Kopp, Kemp, Bittermann, Horton, Donnelly, Gehrels, Hay, Mitrovica, Morrow and Rahmstorf2016). Two reconstructions from Loch Laxford and Kyle of Tongue, Sutherland (Fig. 7, sls 35, 36), are the only ∼2000-year duration continuous records of sea level from NW Europe (Barlow et al. Reference Barlow, Long, Saher, Gehrels, Garnett and Scaife2014). The records are developed using a transfer function which models the relationship between the distribution of modern flora and/or fauna assemblages (in this case, diatoms) and elevation with respect to the tidal frame (Barlow et al. Reference Barlow, Shennan, Long, Gehrels, Saher, Woodroffe and Hillier2013; Kemp & Telford Reference Kemp, Telford, Shennan, Long and Horton2015). The model is then used to transform the fossil diatom assemblages recorded at numerous depths in the continuous salt marsh core into estimates of palaeomarsh surface elevation at the time of deposition, with an associated error term. This is then converted to relative sea level and plotted along aside an age-depth model.
This method has advantages over approaches which date discrete stratigraphical contacts, in that it is able to provide an estimate of the former elevation of sediment deposited at any point in a core. However, there are series of statistical assumptions which can impact on the resulting reconstruction. Therefore, assessing that the results are accurate and robust is important. RSL reconstructions of this type typically have a 2-sigma uncertainty of ∼10–20 % of the local tidal range (Barlow et al. Reference Barlow, Shennan, Long, Gehrels, Saher, Woodroffe and Hillier2013). Using this approach, the results from Sutherland show that during the last 2000 years, sea level has been falling or has been near stable (Barlow et al. Reference Barlow, Long, Saher, Gehrels, Garnett and Scaife2014) (Fig. 16). A recent switch in the biostratigraphy at the top of the sequences means that the authors are unable to reject the hypothesis of a 20th-Century sea level rise outpacing the local rate of background RSL fall at this location. Teasdale et al. (Reference Teasdale, Collins, Firth and Cundy2011) suggest similar evidence for sea level rise outpacing the rate of background land uplift from near-surface salt marsh sediments on Mull. In both cases, the recorded signal is small and within the uncertainties of the methods.

Figure 16 2000-year continuous salt-marsh reconstruction from Kyle of Tongue and Loch Laxford, Sutherland, plotted with 2σ age and altitudinal errors (adapted from figure 9 in Barlow et al. Reference Barlow, Long, Saher, Gehrels, Garnett and Scaife2014).
Records of sea level change from the last century, with centimetre-scale uncertainties, may be obtained from instrumental tide gauge records, with 12 gauges currently operational in Scotland. In general, historic tide gauge records from Scotland are short in length and/or patchy in data coverage and, thus, not currently suitable for providing estimates of long-term trends (Woodworth et al. Reference Woodworth, Tsimplis, Flather and Shennan1999; Dawson et al. Reference Dawson, Powell, Duck and McGlashan2013b). A composite tide gauge record from Aberdeen is the longest in Scotland, covering much of the period AD 1862–present (Woodworth et al. Reference Woodworth, Tsimplis, Flather and Shennan1999), and records a rate of mean sea level rise from 1901–2006 of 0.87±0.10 mm yr–1 (Woodworth et al. Reference Woodworth, Teferle, Bingley, Shennan and Williams2009). Rising sea level along much of Scotland's coastline has also been inferred from the patterns of erosion associated with many depositional features (Firth et al. Reference Firth, Collins and Smith1997, Reference Firth and Stewart2000). Understanding the spatial pattern of the rates of modern day RSL around Scotland, largely driven by ongoing solid Earth deformation following LGM deglaciation, provides an important baseline for stakeholders engaged in coastal management (Shennan et al. Reference Shennan, Milne and Bradley2009; Gehrels Reference Gehrels2010; Rennie & Hansom Reference Rennie and Hansom2011). However, when planning for coastal change, it is important to consider rates of RSL change, which comprise the total glacial rebound process, including gravitational redistribution of ice and water loads and rotational redistribution of ocean mass, rather than simply vertical land-level change (Dawson et al. Reference Dawson, Powell, Duck and McGlashan2013b; Shennan Reference Shennan2013). Bradley et al. (Reference Bradley, Milne, Shennan and Edwards2011) model present-day rates of RSL change in Scotland ranging from −0.8 mm yr–1 (RSL fall) at locations closest to the former LGM ice load centre (e.g., Inverness to Dumfries), up to 1.4 mm yr–1 (RSL rise) in northern Shetland (see Fig. 24 below), with any future rates of RSL rise imprinting over these longer-term spatial patterns.
6. Extreme events
6.1. Storms
[Adrian Hall and David Smith]
6.1.1. Background
Quaternary RSL change and storm frequency and intensity (storminess) are closely linked, given that storminess may influence landforms and sediments that record RSL change, while changes in the rate of RSL change may influence the impact of storminess on shorelines. Storminess has always been a feature of the Scottish coastal environment, although the magnitude and frequency of storms has varied. Climate change, with associated changes in temperature, sea ice cover and changes in the North Atlantic Oscillation (NAO), has led to changes in storm track and wave height as studies of recent trends show (e.g., Woolf et al. Reference Woolf, Challenor and Cotton2002, Reference Woolf, Cotton and Challenor2003). Changes in wave climate, as modelled by Neill et al. (Reference Neill, Scourse, Bigg and Uehara2009), would have also been influenced by RSL change.
6.1.2. Studies since 1993 of storm impacts
Many local studies since 1993 have focussed on dunes (Gilbertson et al. Reference Gilbertson, Schwenninger, Kemp and Rhodes1999; De la Vega-Leinert et al. Reference De la Vega-Leinert, Keen, Jones, Wells and Smith2000; Dawson et al. Reference Dawson, Hickey, Holt, Elliott, Dawson, Foster, Wadhams, Jonsdottir, Wilkinson, McKenna, Davis and Smith2002, Reference Dawson, Smith, Jordan and Dawson2004; Wilson Reference Wilson2002; Sommerville Reference Sommerville, Hansom, Sanderson and Housley2003; Sommerville et al. Reference Sommerville, Hansom, Sanderson and Housley2003, Reference Sommerville, Hansom, Housley and Sanderson2007) or on documentary evidence for historic storms (e.g., Hickey Reference Hickey1997; Dawson et al. Reference Dawson, Dawson and Ritchie2007; Hansom et al. Reference Hansom, Barltrop and Hall2008). Dunes developed widely in the Middle Holocene (e.g., Tooley Reference Tooley1990), but interpretation with respect to episodes of storminess is, as yet, unclear. Evidence from beach ridges may yet provide information on storminess trends. Thus, in a study of beach ridges in western Jura, Dawson et al. (Reference Dawson, Smith, Dawson, Brooks, Foster and Tooley1999) found that the earlier part of the Windermere Interstadial was associated with larger ridges than later, possibly implying greater storminess at that time, while at Scapa Bay, Orkney, de la Vega-Leinert et al. (2007) remarked on changes in ridge height which may be related to storminess.
Information on storm impacts on hard rock coasts has come from the analysis of cliff-top storm deposits (CTSDs) (Hall et al. Reference Hall, Hansom, Williams and Jarvis2006, Reference Hall, Hansom and Williams2010; Hansom et al. Reference Hansom, Barltrop and Hall2008; Hansom & Hall Reference Hansom and Hall2009). CTSDs are potentially more reliable than dune stratigraphies but, so far, too few locations have been studied for regional storminess to be determined. On hard rock coasts, erosional forms dominate and sediments are mainly confined to bays. In a few locations around the most exposed coasts of Scotland and Ireland, where deep water reaches close inshore, the cliff tops hold remarkable arrays of CTSDs (Hall et al. Reference Hall, Hansom, Williams and Jarvis2006). In Scotland, CTSDs have been described from the Atlantic and North Sea coasts, but they reach their finest development on western Orkney and Shetland, where they reach elevations of c.50 m asl at Eshaness, Shetland. Shorelines with CTSDs commonly show four distinct zones: the cliff face; the storm wave scour zone; the boulder accumulation zone; and a landward zone characterised by wave-splash and air-throw debris (Fig. 17A). The cliff-top platform or ramp shows a storm wave scour zone of bare rock that lacks loose debris. Comparable features occur on stepped and ramped cliff faces on many parts of the Scottish coast, but without wave-transported boulders (Fig. 17B). Here, the upper limit of exposed rock marks the maximum elevation of storm wave scour and splash on the cliff face. The boulders in CTSDs may form spreads, imbricate stacks or ridges. Individual boulders may be of impressive size, with A-axis lengths that may exceed 3 m. The large size of the boulders has led to suggestions that CTSDs are tsunami deposits (Scheffers et al. Reference Scheffers, Scheffers, Kelletat and Browne2009), but there is abundant field and documentary evidence for boulder production and movement in historic and recent storms (Hall et al. Reference Hall, Hansom and Williams2010). Wave-tank experiments and mathematical modelling have shown that when high-amplitude storm waves impact the cliff face, they produce a bore of green water moving at velocities capable of extracting large rock blocks from sockets on the cliff top and of transporting these blocks to the rear of the cliff top (Hansom et al. Reference Hansom, Barltrop and Hall2008). The zone of air-thrown debris may extend for many tens of metres inland and clasts of cobble-size may be thrown or roll across turf surfaces. Vertical jets of wave water generated by high energy wave impacts at the cliff face in high winds carry spray inland (Harrison Reference Harrison1997) and transport marine aerosols over many tens of km from the coastline (Franzén Reference Franzén1990). The extent, however, to which sand-sized particles and marine microfossils may also be transported, is uncertain.

Figure 17 Schematic models of cliff-top storm deposits based on the Eshaness coast of Shetland: (A) cross-section showing the vertical zonation of erosion and deposition on cliffs. Dashed lines are rock fractures; (B) plan view showing patterns of erosion and deposition. Rectangles on the turf-covered cliff top are wave-transported blocks, with (black) and without (white) lichen cover. The arrow marks a cliff-top spillway for wave water. Modified from Hall et al. (Reference Hall, Hansom, Williams and Jarvis2006).
CTSD ridges can be seen as an end-member type of storm beach, unusual in terms of altitude and calibre, but nonetheless sharing characteristics of sorting and imbrication with boulder and gravel storm beach ridges at lower elevations (Austin & Masselink Reference Austin and Masselink2006). Steeply seaward-facing, asymmetric boulder beaches are a remarkable feature of exposed coasts in the Hebrides, Orkney and Shetland (Steers Reference Steers1973). Suggestions that some imbricate boulder ridges are tsunami deposits (Scheffers et al. Reference Scheffers, Scheffers, Kelletat and Browne2009) are unsubstantiated, as the burial of man-made debris, along with photographic evidence, indicates instead that large boulders are mobilised in major storms. Storm beaches, together with the ponds and bogs trapped landward of beach ridges (Shennan et al. Reference Shennan, Tooley, Green, Innes, Kennington, Lloyd and Rutherford1998) and the laminated sands and gravels in storm swash terraces found in bay heads (McKenna et al. Reference McKenna, Cooper and Jackson2012), represent a neglected archive of past storminess on high-energy coasts in Scotland.
The narrowing of shore platforms into firths and other sheltered waters around the Scottish coast confirms that storm waves are of fundamental importance in the erosion of shore platforms. Under normal tidal levels, waves break on the seaward edge of shore platforms. At astronomical high tides and under conditions of storm surge, waves may reform to cross the platform and reach the cliff or beaches at the rear (Hall Reference Hall2011). Such wave currents extract blocks of rock from sockets and mobilise large boulders on the platform and quarry rock from the cliff base (Dawson et al. Reference Dawson, Dawson and Ritchie2007; Hall Reference Hall2011). A less obvious process is the lowering of the platform surface by removal of small rock fragments and by abrasion (Kirk Reference Kirk1977). The large height range of storm wave impacts on shore platforms and backing beaches means that there is no simple relationship between these coastal features and RSL.
6.2. Tsunamis
[David Smith]
Long & Wilson (Reference Long and Wilson2007) and Long (Reference Long2015, Reference Long, Scourse, Chapman, Tappin and Wallis2017) produced a catalogue of tsunamis to have affected the United Kingdom. Of the tsunamis listed in the catalogue, only the Holocene Storegga Slide tsunami was recognised as a definite tsunami in Scotland. The Holocene Storegga Slide tsunami (Fig. 18) is undoubtedly one of the most remarkable events to have taken place along the Scottish coastline during the Quaternary. The evidence for this event was originally found in the Forth valley (Sissons & Smith Reference Sissons and Smith1965), but the interpretation of that evidence being from a tsunami generated by submarine mass wasting off the SW coast of Norway was first made by Dawson et al. (Reference Dawson, Long and Smith1988). Since 1993, new sites have been found at the Dornoch Firth (Smith et al. Reference Smith, Firth, Turbayne and Brooks1992; Firth et al. Reference Firth, Smith, Hansom and Pearson1995; Shi Reference Shi1995), Wick River valley (Dawson & Smith Reference Dawson, Benn, Dawson, Dawson and Dawson1997), Strath Halladale (Dawson & Smith Reference Dawson and Smith2000), Shetland (Bondevik et al. Reference Bondevik, Mangerud, Dawson, Dawson and Lohne2003), Cocklemill Burn, Fife (Tooley & Smith Reference Tooley and Smith2005) and Loch Eriboll, Sutherland (Long et al. Reference Long, Barlow, Dawson, Hill, Innes, Kelham, Milne and Dawson2016). In 2004, Smith et al. (Reference Smith, Shi, Cullingford, Dawson, Dawson, Firth, Foster, Fretwell, Haggart, Holloway and Long2004) reviewed the evidence from 32 sites in Scotland and NE England, showing that the tsunami had affected coastal areas in Shetland and in northern, northeastern and southeastern Scotland, with sediment run-up values of over 9 m at some locations on mainland Scottish coasts. Soulsby et al. (Reference Soulsby, Smith, Ruffman, Kraus and Rosati2007) used a mathematical model to describe the reduction in grain size and thinning of the tsunami deposit landwards at Montrose, whilst Smith et al. (Reference Smith, Foster, Long and Shi2007b) estimated water depths several metres above the sediment surface from particle size analyses. In more recent work, Dawson et al. (Reference Dawson, Bondevik and Teller2011) and Bondevik et al. (Reference Bondevik, Stormo and Skjerdal2012) dated the event at a site in Norway at 8,110±100 BP. Smith et al. (Reference Smith, Harrison and Jordan2013) remarked on the closeness between the age of the tsunami in Scotland and the published dates for the discharges of Lake Agassiz–Ojibway (e.g., Barber et al. Reference Barber, Dyke, Hillaire-Marcel, Jennings, Andrews, Kerwin, Billodeau, McNeely, Southons, Morehead and Gagnon1999; Teller et al. Reference Teller, Leverington and Mann2002). They maintained that the Holocene Storegga Slide may have been triggered by the rapid RSL rise in the area of the slide resulting from the lake discharges, thus causing the tsunami (Fig. 19). Detailed stratigraphical work at many sites discloses the elevation at which the sand layer, commonly associated with the tsunami, crosses the inland limit of underlying marine sediments. The altitude of this limit, taken to be the shoreline when the tsunami struck, has been used in generating a shoreline-based isobase model which, by avoiding any diachronous element, depicts glacio-isostatic uplift from the date that the tsunami took place (Fig. 20).
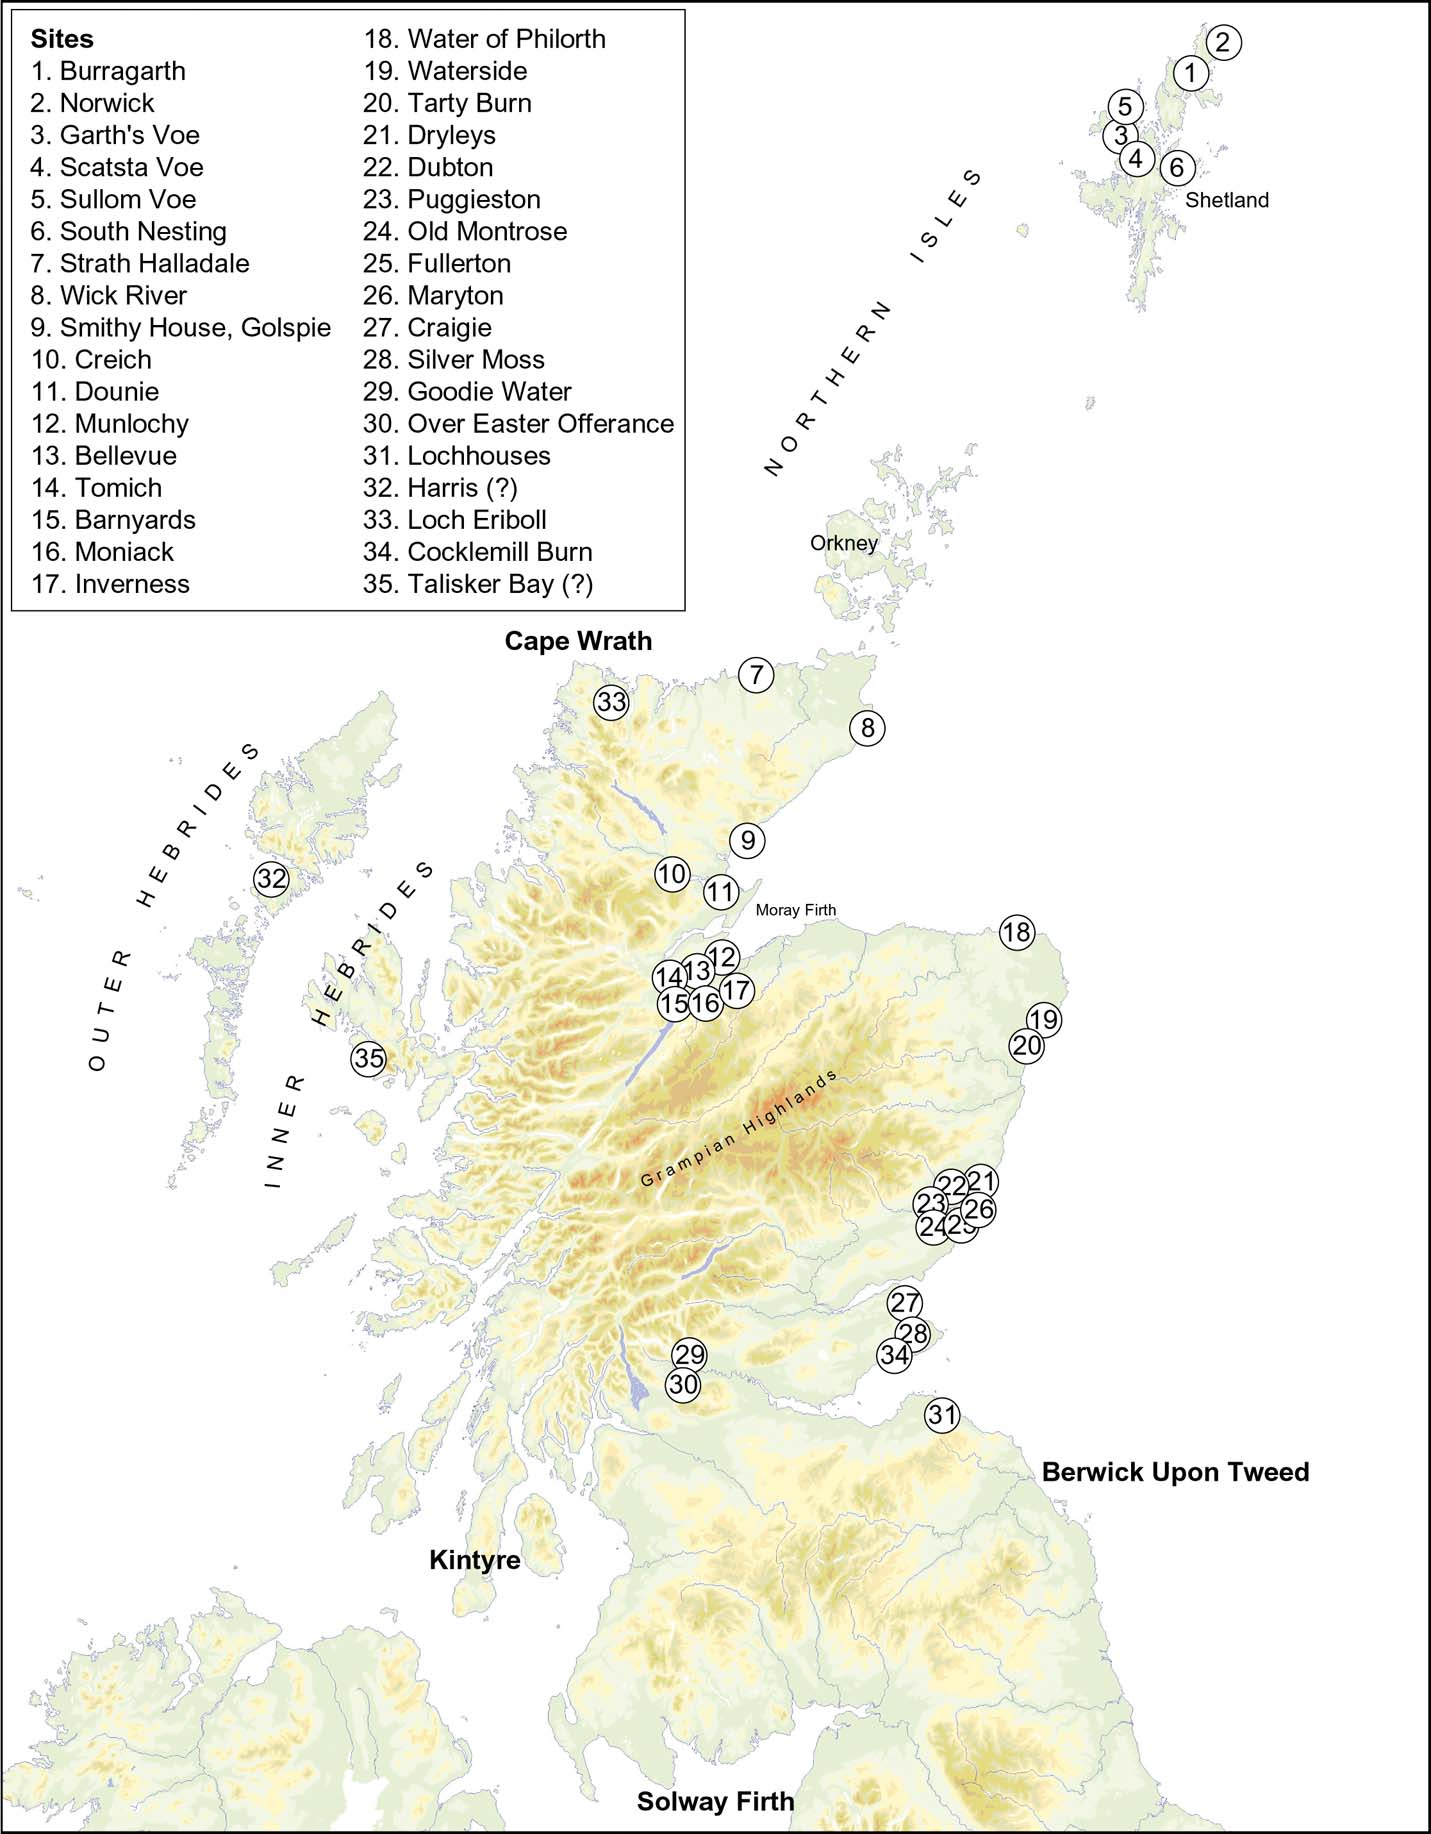
Figure 18 Sites where evidence for the Holocene Storegga Slide tsunami has been found. Based on Smith et al. (Reference Smith, Shi, Cullingford, Dawson, Dawson, Firth, Foster, Fretwell, Haggart, Holloway and Long2004), with additional information from Tooley & Smith (Reference Tooley and Smith2005), Jordan et al. (Reference Jordan, Smith, Dawson and Dawson2010), Selby & Smith (Reference Selby and Smith2015) and Long et al. (Reference Long, Barlow, Dawson, Hill, Innes, Kelham, Milne and Dawson2016). The sites on Harris and at Talisker Bay are unconfirmed at present.

Figure 19 RSL graph for the Ythan estuary, showing the change in RSL thought to mark the impact of the Lake Agassiz–Ojibway flood, with the age of the Holocene Storegga Slide tsunami from sediments in the estuary area. Reprinted from Smith et al., Quaternary Science Reviews Reference Smith, Harrison and Jordan2013, vol. 82: Sea level rise and submarine mass failures on open continental margins. With permission from Elsevier. For full details, see references.

Figure 20 (A) Shoreline-based Gaussian trend surface showing isobases in metres MHWST for the shoreline of the Holocene Storegga Slide tsunami, based on an axis and centre in common with later Holocene shorelines (see Fig. 14), with a mean absolute residual of 0.69 m (after Smith et al. Reference Smith, Hunt, Firth, Jordan, Fretwell, Harman, Murdy, Orford and Burnside2012). (B) Section from Fullerton, Montrose, showing the inferred shoreline at the time of the Holocene Storegga Slide tsunami.
The Holocene Storegga Slide tsunami may not have been the only such event to have affected Scottish coasts during the Quaternary. Bondevik et al. (Reference Bondevik, Mangerud, Dawson, Dawson and Lohne2005), who summarised evidence for tsunami deposits on Shetland, reported evidence for a tsunami from deposits in lakes on Shetland, which they dated at 5.5 ka BP; whilst at Basta Voe on Yell, Shetland, Dawson et al. (Reference Dawson, Dawson and Bondevik2006) described a distinctive sand layer in coastal peat, which they dated to between 1300 BP and 1570 BP and which they speculated may have been generated by a tsunami resulting from a submarine slide in the Storegga area. However, a tsunami origin for both the 1300/1570 BP and 5.5 ka BP events appears uncertain. Tappin et al. (Reference Tappin, Long and Carter2015) supported evidence for the 1300/1570 BP tsunami, but did not identify a source for that event; whilst Long (Reference Long2015) was uncertain that the event was a tsunami. Indeed, slides in the Storegga area dated as post-Storegga are considered as relatively small, insufficient to create a tsunami (Haflidason et al. Reference Haflidason, Lien, Sejrup, Forsberg and Bryn2005). Furthermore, although there are several large, potentially tsunamigenic, submarine landslides along the continental slope off NW Europe, Løvholt et al. (Reference Løvholt, Bondevik, Laberg, Kim and Boylan2017) have maintained that not all giant submarine landslides can generate large tsunamis. Evidence for tsunamis in Shetland, other than from the Holocene Storegga Slide, remains enigmatic, especially since evidence for the possible later events cited above has yet to be found outside Shetland. Origins for these events may include storms, sliding of the peat across minerogenic sediment (Tappin et al. Reference Tappin, Long and Carter2015) or possibly deposition when coastal peats were split and floated during episodes of high tidal levels, or possibly increases in RSL in the manner of the “klappklei” deposits described from the North Sea coast of Germany (e.g., Behre Reference Behre2004).
7. Glacial isostatic adjustment models
[Sarah Bradley]
Glacial isostatic adjustment (GIA) is the term used to describe the solid Earth deformation that results from the mass redistribution between land-based ice sheets and the ocean during glacial-interglacial cycles. By comparing predictions generated by GIA models, for example of RSL with surface observations, such as sea level index points (SLIPS), information about past ice sheet history (Shennan et al. Reference Shennan, Hamilton, Hillier, Hunter, Woodall, Bradley, Milne, Brooks and Bassett2006b; Brooks et al. Reference Brooks, Bradley, Edwards, Milne, Horton and Shennan2008), global ice-volume equivalent sea level change (Shennan et al. Reference Shennan, Hamilton, Hillier and Woodroffe2005) and the Earth's rheological properties (Lambeck Reference Lambeck1996) can be inferred.
Over the past two decades, there have been numerous GIA modelling studies for the British Isles: from the early work of Lambeck (Reference Lambeck1993a, Reference Lambeckb); through the studies of Johnston & Lambeck (Reference Johnstone and Lambeck2000), Peltier et al. (Reference Peltier, Shennan, Drummond and Horton2002) and Shennan et al. (Reference Shennan and Horton2002); to the studies of Bradley et al. (Reference Bradley, Milne, Shennan and Edwards2011) and Kuchar et al. (Reference Kuchar, Milne, Hubbard, Patton, Bradley, Shennan and Edwards2012) (referred to below as the Bradley and Kuchar models, respectively). These studies were motivated by the high-quality SLIPs database, with over 1100 data points at over 50 sites.
A GIA model has three key inputs: (1) a reconstruction of the Late Quaternary ice history commencing at ∼120 ka BP; (2) an Earth model to reproduce the solid Earth deformation resulting from surface mass redistribution between ice sheets and oceans; and (3) a model of sea-level change to calculate the redistribution of ocean mass (which includes the influence of GIA-induced changes in Earth rotation) (Farrell & Clark Reference Farrell and Clark1976; Mitrovica & Milne Reference Mitrovica and Milne2003; Kendall et al. Reference Kendall, Mitrovica and Milne2005; Mitrovica et al. Reference Mitrovica, Wahr, Matsuyama and Paulson2005). These inputs are primarily constrained using SLIPs; with longer records from the far-field tropical regions used to estimate the total volume of continental ice and timings and pattern of global ice-volume equivalent sea level change (Milne et al. Reference Milne, Mitrovica and Schrag2002; Liu et al. Reference Liu, Milne, Kopp, Clark and Shennan2016), and regional near-field databases (Shennan & Horton Reference Shennan and Horton2002) used to constrain the regional ice sheet history and Earth model. Additionally, landform evidence from previously glaciated regions, such as trimlines (Ballantyne Reference Ballantyne and Elias2007), raised shorelines (Smith et al. Reference Smith, Fretwell, Cullingford and Firth2006) and offshore sediment cores (Sejrup et al. Reference Sejrup, Nygård, Hall and Haflidason2009), has been used to delimit the lateral and vertical extent and temporal history of the ice sheets. Once an initial input ice sheet history and reference Earth model are chosen, the sea-level model is solved and the input Earth- and ice-models are then tuned to improve the agreement between observational data, such as SLIP, and GIA model predictions.
The two most recent BIIS reconstructions from GIA modelling are illustrated in Figure 21: the Bradley and Kuchar models. The construction of the BIIS in these two studies is significantly different, as described below, and illustrates the two main methods adopted in the generation of an input ice sheet model for GIA modelling. In both reconstructions, the regional BIIS model (which will be referred to as the local signal) was combined with the same global GIA ice model (Bradley et al. Reference Bradley, Hindmarsh, Whitehouse, Bentley and King2015), which was developed independently using far-field sea level data. This ‘non-local model' dictates the pattern of global ice-volume equivalent sea level change and is driven by the melting of the larger global ice sheet, such as the Scandinavian Ice sheet (SIS) or Laurentide Ice sheet (LIS).

Figure 21 Ice thickness maps of the reconstructed BIIS at various times presented in Bradley et al. (Reference Bradley, Milne, Shennan and Edwards2011) (a–d, i–l) and the “minimal reconstruction” of Kuchar et al. (Reference Kuchar, Milne, Hubbard, Patton, Bradley, Shennan and Edwards2012) (e–h, m–p).
The Bradley model combined two regional ice sheet reconstructions; one for the British Ice sheet (Shennan et al. Reference Shennan, Bradley, Milne, Brooks, Bassett and Hamilton2006a) and one for the Irish Ice sheet (Brooks et al. Reference Brooks, Bradley, Edwards, Milne, Horton and Shennan2008). In these reconstructions, the maximum vertical height of the ice sheet was delimited by trimline data (Ballantyne Reference Ballantyne and Elias2007) which, until quite recently, was thought to mark the upper erosive limit of a warm-based erosive ice sheet. The reconstruction was characterised by a two-stage glaciation of the North Sea Basin, with an initial coalescence of the BIIS and the SIS between 32 ka and 27 ka BP (Fig. 21a), followed by a short-lived retreat (26–25 ka BP, Fig. 21b). Following this, the BIIS re-advanced out across the North Sea basin, thickened and extended out onto the continental shelf, reaching a maximum ice thickness of ∼1110 m. There are two short-lived ice streams, one to the Isles of Scilly (Fig. 21c) and one along the east coast of England (Fig. 21d). Deglaciation begins at 21 ka BP, with rapid thinning and retreat of the Irish Ice sheet and complete retreat by 16 ka BP (Fig. 21). The timings of this advance and retreat pattern were constrained primarily with sediment cores data taken from Sejrup et al. (219). However, since the creation this BIIS reconstruction, newer evidence (Clark et al. Reference Clark, Hughes, Greenwood, Jordan and Sejrup2012; Sejrup et al. Reference Sejrup, Nygård, Hall and Haflidason2016) suggests a later coalescence between the BIIS and SIS.
A second new finding has been the reinterpretation of the Scottish trimline data, as representing an englacial boundary (Ballantyne Reference Ballantyne2010) between a lower zone of warm-based eroding ice and an upper zone of cold-based, non-eroding ice. The trimlines therefore mark the upper limit of warm-based ice and the minimum vertical height that the BIIS reached during the glacial maximum. This revised interpretation enables the generation of a much thicker ice sheet and supports the vertical extent inferred from glaciological modelling (Boulton & Hagdorn Reference Boulton and Hagdorn2006; Hubbard et al. Reference Hubbard, Bradwell, Golledge, Hall, Patton, Sugden, Cooper and Stoker2009). The use of glaciological modelling and support for this revised trimlime interpretation is illustrated in the second BIIS GIA modelling example – the Kuchar model (Fig. 21). Note that the results shown here adopted the “minimal reconstruction” of Kuchar et al. (Reference Kuchar, Milne, Hubbard, Patton, Bradley, Shennan and Edwards2012). In this reconstruction, the spatial and temporal history of the BIIS was generated by a glaciological ice sheet model (Hubbard et al. Reference Hubbard, Bradwell, Golledge, Hall, Patton, Sugden, Cooper and Stoker2009). Unlike the more traditional approach of developing an input ice reconstruction using geomorphological constraints (as in the Bradley model), the key observational constraint is ice flow locations and directions. As can be seen by comparing the extent at the Last Glacial Maximum (∼21 ka BP) in the two reconstructions (Fig. 21d compared to Fig. 21h), this leads to a much thicker ice sheet (1965 m, as compared to 1100 m in the Bradley model), which supports the revised interpretation of the Scottish trimline data. Compared to the Bradley model, in the Kuchar reconstruction, the BIIS is more restricted spatially and vertically between 32 ka and 26 ka BP, during which time the ice begins to expand outwards from the high terrain of Scotland (Fig. 21f compared to Fig. 21e). There is also a short-lived retreat–readvance as in the Bradley model, but between 28 ka and 27 ka BP. By 21 ka BP (Fig. 21h), the ice has expanded within the Irish Sea basin, and out along the NW and NE margins, but the Irish ice sheet extent is more restricted. Deglaciation begins ∼21–20 ka BP (Fig 21), with slower retreat from the offshore regions than in the Bradley model (compare Fig 21i–j to Fig. 21m–n). Note that not shown for either reconstruction is a short-lived readvance across Scotland at 13 ka and 12 ka BP in the Bradley and Kuchar models, respectively, associated with the Younger Dryas.
Typically, in regions that were once ice covered, such as Scotland, GIA model predictions are primarily driven by the isostatic response of the solid Earth, due to the changes in the regional ice loading and, to a lesser extent, to the global ice-volume equivalent sea level signal. Therefore, the predictions are highly dependent on the regional reconstructed ice-sheet history and Earth model. However, the GIA predictions across Scotland are more complicated, as the RSL signal is equally sensitive to the regional isostatic response (due to the deglaciation of the BIIS) and to changes in the global ice-volume equivalent sea level signal (driven by the deglaciation of the larger global ice sheets, such as the LIS or SIS). We will term these two signals the ‘local signal' and ‘non-local' signal, respectively.
To illustrate the interplay between these two signals, RSL predictions were generated at seven selected sites across Scotland using the Bradley and Kuchar models (Fig. 22; Table 2). The total RSL signal from the Bradley model was separated into the contribution from the BIIS only, the “local signal” (Fig 22a) and the “non-local signal” separated into the contribution from the SIS only (Fig. 22a) and from all other far-field ice sheets (Fig. 22b).

Figure 22 Predicted RSL for the seven sites (see Table 2) due to: (a) the BIIS only (solid line) and the SIS only (dashed line); (b) and far-field ice sheets only. Coloured lines: green = Coigach (6); blue = NE Scotland (13); light blue = Arisaig (11); yellow = SE Scotland (22); orange = Forth Valley (17); dark green = Islay (18); purple = Hebrides (7). In the remaining seven panels is the predicted RSL at the seven sites from the Bradley (red line) and Kuchar (black line) models, compared to the observed primary sea level index points. blue circles = basal index points; black circles = intercalated points; limiting data marked in red. Note the varied scale for the time axis.
Table 2 Summary table of the observed SLIPs illustrated in Figure 22.

These seven sites are located relatively near to the centre of ice loading and, as such, the local signal (Fig. 22a) drives a steady fall in RSL from between ∼130 m and 80 m above present. This is the typical RSL signal seen at near-field sites and is driven by uplift of the solid Earth following the retreat of the BIIS. This local signal is overprinted by the non-local signal, where there is a near equal, but opposite, rise in RSL towards present, from around −135 m to −110 m, followed by a gradual slowdown through the Middle to Late Holocene (Fig. 22b). This steady rise is punctuated by two periods of rapid RSL rise: at ∼14 ka BP, known as Meltwater Pulse 1A; and at ∼11 ka BP, due to an increase in global ice melting associated with the Younger Dryas. It is this non-local signal which drives the sharp inflections in the predicted RSL at all seven sites (Fig. 22). It should be noted, that although the SIS is relatively close to the BIIS, the total contribution to the RSL signal across Scotland is quite small (see dashed lines on Fig. 22a), with a predicted rise in RSL of ∼−14 m.
The Forth valley (Fig. 22, site 17), situated closest to the centre of ice loading (Fig. 23), will experience the maximum uplift and, as such, has the maximum RSL fall. In the Kuchar model, from the Late Devensian to 14 ka BP (Fig. 22), RSL falls by over 150 m (20 m in Bradley), reaching +32 m (14 m in Bradley) by 14 ka BP, with a maximum Holocene highstand of 7.4 m (9.4 m in Bradley). With an increased distance, away from the centre of loading, for example at Arisaig (Fig. 22, site 11), the local signal is reduced (Fig. 22a) and, as such, by 11 ka BP the RSL has fallen either close to +1.8 m (Kuchar) or to just below −1.5 m (Bradley) at the present day. At Arisaig (Fig. 22, site 11), the thicker ice sheet in the Kuchar model (Fig. 21d–h) improves the fit to the older, pre-15 ka BP SLIP and elevates the predicted RSL at 11 ka BP. However, as seen at the Forth valley (Fig. 22, site 17), the Holocene highstand is lower, 3.9 m compared to 7.4 m in the Bradley model. The lower highstand produced by the Kuchar model, despite a thicker BIIS, is in part due to the different choice of input Earth model (Kuchar et al. Reference Kuchar, Milne, Hubbard, Patton, Bradley, Shennan and Edwards2012) and due to the earlier and more rapid retreat of the ice sheet across Scotland (compare Fig. 21l with Fig. 21p)

Figure 23 Predicted RSL for the Bradley (a–d) and the Kuchar (e–h) models at a range of time steps. The locations of the seven RSL sites shown on Figure 22 are labelled.
The influence of the varied BIIS loading history between the Kuchar and Bradley models is highlighted by comparing the difference in the predictions at the two sites from eastern Scotland: NE Scotland (Fig. 22, site 13) and SE Scotland (Fig. 22, site 22). At 14 ka BP, with the Kuchar model, the predicted RSL is elevated by 24 m and 30 m (relative to the Bradley model) at each site, respectively, and at SE Scotland the increase in the local signal is such that the predictions remain elevated above present day at all times. It is the more expansive and thicker ice sheet across the E of Scotland within the Kuchar model (compare Fig. 21i & j with Fig. 21m & n) which not only increases the relative local uplift, but also widens the region of relative RSL fall, displacing the centre of uplift from the NW (Bradley) to the NE (Kuchar) (compare Fig. 23a–d with Fig. 23e–h). However, at these two sites, by the Middle Holocene, the non-local signal is more dominant in controlling the predicted RSL, as can be seen in the similarity in the height of the predicted highstand at each site, unlike the differences as described at Arisaig and the Forth valley. As the SLIP records at these two sites stand, it is again not possible to discriminate between these two BIIS reconstruction predictions. A Holocene highstand is only generated at the observed sites when the local RSL fall is sufficiently large to outpace the non-local driven RSL rise. For example, at Coigach, Ullapool (Fig. 22, site 6), a highstand is produced with both models, capturing the observed SLIP data. This site is located closer to the centre of uplift (Fig. 23) and, as such, the local RSL fall outpaces the non-local rise.
In the Hebrides (Fig. 22, site 7), there is no highstand, with predicted RSL remaining below present from 14 ka BP to present. The results from both models are quite similar and neither captures the higher RSL seen in the observed SLIP. This similarity is due to the dominant influence of the non-local signal in driving the RSL over this period, which is the same in both models. With its more distal location from the centre of ice sheet, the local signal (Fig. 22a) is near equal to the non-local signal (Fig. 22b). We note that this is not the case for the Late Devensian to early Holocene (not shown on Fig. 22; see Kuchar et al. Reference Kuchar, Milne, Hubbard, Patton, Bradley, Shennan and Edwards2012), where in the Hebrides, the Kuchar model again results in a much higher RSL, by over 50 m.
We have outlined the interplay between the local and non-local signal in driving the RSL up to the timing of the Middle Holocene highstand, but these two signals are equally important in driving the ongoing present-day rate of sea level change.
As discussed in section 5, above, and as the selection of seven sites illustrates, there are relatively few SLIPs available (less than 50) across Scotland for the last 4 ka in the current database, to either constrain GIA models over this period or to estimate the on-going present-day rate of sea level change. Two studies which have estimated a maximum present-day rate of sea level change from the Scottish data obtain a rate of around −1.7 mm/yr across NW Scotland (Shennan & Horton Reference Shennan, Peltier, Drummond and Horton2002; Gehrels Reference Gehrels2010). As Figure 24a illustrates, the predicted present-day rate of sea level change only reaches a maximum of −1.1 mm/yr (see red circle), corresponding to the region of thickest ice sheet, lower than that inferred from the observed data. This total signal is composed of a large local signal (Fig. 24c) which forms a concentric pattern, reaching a maximum of −1.67 mm/yr, reduced by a non-local, long-wavelength signal (Fig. 24b), of around +0.8 mm/yr.

Figure 24 Predicted present-day rate of sea level change (a–c) and vertical land motion (d–f) using the Bradley model, due to: all ice sheets (a) and (d); all other ice sheets apart from the BIIS (b) and (e); and the BIIS only (c) and (f). Panel (g) is the predicted present-day rate of change in the sea surface, where over several decades this approximates the ocean geoid. Contour interval = 0.4 m (a–f); 0.02 m (g). The locations of the seven RSL sites in Figure 22 are labelled. The red circle on (a) and (d) highlights the location of maximum uplift/maximum RSL fall.
The main driving mechanism for this ongoing fall in sea level is the vertical land motion, due to the rebound of the solid Earth. By comparing the corresponding predicted present-day rate of vertical land motion (Fig. 24f), the distinct similarity is evident; where the main region of maximum uplift (+0.83 mm/yr) coincides with the region of maximum RSL fall. The offset between the ‘0 mm/yr' or line of zero sea level change/zero land uplift is due to the displacement of the sea (Fig. 24g) of ∼0.3 mm/yr. This signal is combined with the present-day rate of vertical land motion to derive the total predicted signal.
8. Key research questions and future work
[All authors]
8.1 The continental shelf record
Whilst progress has been made in determining the morphology and sediments of the continental shelf surrounding Scotland, there is room for a better understanding of the offshore Devensian and pre-Devensian record of RSL change. The record will be improved with the release of data from the BRITICE-CHRONO project (BRITICE-CHRONO 2017). Information on submarine mass failures to help determine the likely frequency and magnitude of tsunamis on Scottish coasts is a focus of the work of the Landslide-Tsunami Consortium (Talling Reference Talling2013).
8.2 Inherited rock shorelines
The most important research question in studies of inherited rock shorelines in the Quaternary concerns their age and what information they can provide about RSL change. Understanding the distribution, morphology and age of these features will require a combination of field study, dating and modelling (Trenhaile Reference Trenhaile2014). Although in parts of the W coast and on NW Lewis, it is possible to recognise former shorelines from multiple rock platform remnants at similar elevations, at many locations platform fragments have not been surveyed in detail. Mapping should identify such fragments by the main locality at which they are found, as with stratigraphic units, thereby allowing later correlation and identification of former shorelines on the basis of altitude, overlying sediments and age. Such mapping should also differentiate between shore platforms and structural platforms developed on flat-lying rock units (Wright Reference Wright1911). The advent of detailed bathymetric data for the inner shelves around Scotland (Bradwell & Stoker Reference Bradwell and Stoker2015a) and the improved understanding of offshore Pleistocene sediment sequences (Bradwell & Stoker Reference Bradwell and Stoker2015b) provides great opportunities to establish the distribution of submarine rock platforms and to constrain the age of formation from overlying, dated sediments. Dating of buried shore platforms onshore is difficult, but significant progress has been made in modelling cosmogenic isotope inventories on shore platforms (Hurst et al. Reference Hurst, Rood and Ellis2017) and in dating exposed and buried rock surfaces (Stone et al. Reference Stone, Lambeck, Fifield, Evans and Creswell1996; Granger & Muzikar Reference Granger and Muzikar2001; Choi et al. Reference Choi, Seong, Jung and Lee2012). The presence of till-filled caves and geos protected from glacial erosion on lee slopes indicates that more of these features await discovery. Such marine cave fills are potentially rich archives of environmental (Larsen et al. Reference Larsen, Gulliksen, Lauritzen, Lie, Lovlie and Mangerud1987) and even archaeological (Bailey & Flemming Reference Bailey and Flemming2008) information from the period before the last ice sheet.
8.3 Late Devensian and Holocene RSL change
Determination of the altitude and age of Late Devensian RSLs will help determine ice extent during deglaciation, including the extent of a separate Shetland Ice Cap. For the Holocene, more information is needed from areas peripheral to the area of greatest uplift, including the Northern Isles and Outer Hebrides. Furthermore, since studies of isolation basins and coastal estuarine depocentres are confined to different areas, there is room for an assessment of the comparability of the record. The extent and magnitude of local crustal movements which may affect RSLs are unclear. Finally, little is known about palaeotides at Scottish coastal sites over much of the Late Devensian and Holocene, which may affect comparability of the record. Thus, whilst Shennan et al. (Reference Shennan, Lambeck, Flather, Horton, McArthur, Innes, Lloyd, Rutherford, Wingfield, Shennan and Andrews2000b, Reference Shennan, Coulthard, Flather, Horton, Macklin, Rees and Wright2003) estimated that there would have been little change in tidal levels on North Sea coasts during the last 6–7 ka, and Uehara et al. (Reference Uehara, Scourse, Horsburgh, Lambeck and Purcell2006) estimated little change overall for the last 8 ka, the effects of changes in coastal configuration in previous periods are largely unknown. Ward et al. (Reference Ward, Neill, Scourse, Bradley and Uehara2016) modelled noticeable changes in tidal dynamics on the W coast before 8 ka BP.
8.4. RSL change in the last 2000 years
Understanding RSL changes taking place during the documentary and instrumental record is vital in determining spatial and temporal changes in the foreseeable future. Determination of recent and current RSL trends using lithostratigraphy, biostratigraphy and dating methods is essential to build up a detailed picture at both the regional and local scale. A far greater number of high-precision records than presently available are required to be able to do this. These results will help guide understanding of future changes, which is important for climate mitigation and adaptation strategies.
8.5. Extreme events
Recent research has questioned the relative significance of episodes of storminess versus tsunamis in the Mediterranean (Marriner et al. Reference Marriner, Kaniewski, Mohrange, Flaux, Glaime, Vacchi and Goff2017), highlighting the need to examine the evidence in Scotland. Stratigraphical evidence for Holocene storminess has recently been improved through the study of aerosols in coastal peat mosses (e.g., Orme et al. Reference Orme, Reinhardt, Jones, Charman, Barkwith and Ellis2016) and, combined with studies of sand dune movement and cliff-top storm deposits, may provide valuable chronologies. In the case of tsunamis, the record is uncertain, with only the Holocene Storegga Slide tsunami confirmed at present. Determining the record of both storminess and tsunamis will depend upon the stratigraphic record. Further research is needed to discriminate between storm and tsunami deposits, such as that undertaken in Ireland (Dewey & Ryan Reference Dewey and Ryan2017), Portugal (Kortekaas Reference Kortekaas2002; Kortekaas & Dawson Reference Kortekaas and Dawson2007) and New Zealand (e.g., Goff et al. Reference Goff, McFadgen and Chagué-Goff2004; Donnelly et al. Reference Donnelly, Goff and Chagué-Goff2017).
8.6. GIA modelling of patterns of crustal and RSL change
GIA models have been greatly improved as the effect of global mean sea level change is refined, with new global bathymetrical and topographical data such as was developed in the ETOPO series, and as more is known about the dynamics and history of Quaternary ice sheets and of Earth geophysics. GIA models offer the best method of determining patterns of uplift, and the development of new observational data on RSL change will enable detailed validation and refinement of these models.
9. Conclusion
Since the publication of the Quaternary of Scotland GCR volume in 1993, there have been continuing developments in understanding RSL change in Scotland. Whilst much remains to be understood about the record of RSL offshore on the continental shelf, some inferences can be made about RSL change from the morphology and features there. Onshore, some progress has been made in understanding the development and timing of inherited rock shorelines, but the picture remains complex. For Late Devensian and Holocene RSL change, the application of the isolation basin approach has provided much needed information for the coastline of W Scotland where, previously, relatively little information was available; whilst from the estuaries of E and SW Scotland, the presence of variations in Holocene RSL changes has been supported. Evidence for two global meltwater pulses is probably present at sites in Scotland. Progress in understanding RSL change in the last 2 ka has received less attention, and will depend upon a wider coverage of sites and comparison with GIA models. The importance of extreme coastal flooding events is recognised, with new approaches to identifying patterns of storminess and to reconstructing the impact of the Holocene Storegga Slide tsunami. The development of GIA models is providing increasingly detailed information on rates and patterns of crustal movement, and the similarity in outline with shoreline-based numerical models of Holocene crustal movement provides support for the methodology. However, much remains to be discovered. Little is known at present about RSL changes before the Late Devensian; whilst for the Late Devensian itself, the sequence of RSL changes during deglaciation is only known in general terms. For the Holocene, gaps in knowledge include the poor record from the Outer Hebrides and Northern Isles, the effect of local crustal movements and the timing and impact of extreme coastal floods. Resolution of such problems will enable an improved perspective on RSL change during the Quaternary in Scotland.
10. Acknowledgements
The authors acknowledge the detailed and helpful comments of the referees, which have enabled improvements to be made in the manuscript originally submitted.