Introduction
The death of a loved one is a painful and often devastating life event. Psychopathological responses to loss manifest as a cluster of grief-related symptoms affecting up to 10% of bereaved people (Prigerson et al., Reference Prigerson, Horowitz, Jacobs, Parkes, Aslan, Goodkin, Raphael, Marwit, Wortman, Neimeyer, Bonanno, Block, Kissane, Boelen, Maercker, Litz, Johnson, First and Maciejewski2009; Lundorff et al., Reference Lundorff, Holmgren, Zachariae, Farver-Vestergaard and O'Connor2017). Persistent grief reactions can compromise functioning for years (Bonanno et al., Reference Bonanno, Wortman, Lehman, Tweed, Haring, Sonnega, Carr and Neese2002) and are associated with poor physical and mental health outcomes (Stroebe et al., Reference Stroebe, Schut and Stroebe2007; Shear et al., Reference Shear, Simon, Wall, Zisook, Neimeyer, Duan, Reynolds, Lebowitz, Sung, Ghesquiere, Gorscak, Clayton, Ito, Nakajima, Konishi, Melhem, Meert, Schiff, O'Connor, First, Sareen, Bolton, Skritskaya, Mancini and Keshaviah2011). The need for an improved empirical understanding of grief-specific psychopathology was attested by the inclusion of persistent complex bereavement disorder (PCBD) as a diagnosis under ‘Conditions for Further Study’ in the Diagnostic and Statistical Manual of Mental Disorders, Fifth Edition (DSM-5) (APA, 2013). The addition was met with controversy (Boelen and Prigerson, Reference Boelen and Prigerson2012; Bryant, Reference Bryant2014), and no consensus has yet been reached regarding which symptom criteria best capture clinically significant grief reactions (Maercker et al., Reference Maercker, Brewin, Bryant, Cloitre, Reed, van Ommeren, Humayun, Jones, Kagee, Llosa, Rousseau, Somasundaram, Souza, Suzuki, Weissbecker, Wessely, First and Saxena2013; Maciejewski et al., Reference Maciejewski, Maercker, Boelen and Prigerson2016). The PCBD diagnostic algorithm results in 37 650Footnote 1 possible symptom combinations, making the construct broad and potentially error prone (Galatzer-Levy and Bryant, Reference Galatzer-Levy and Bryant2013). Consistent with this outcome, Cozza et al. (Reference Cozza, Fisher, Mauro, Zhou, Ortiz, Skritskaya, Wall, Fullerton, Ursano and Shear2016) showed that PCBD had poor sensitivity, identifying only 53% of a highly impaired bereaved sample (see also Prigerson and Maciejewski, Reference Prigerson and Maciejewski2017; Reynolds et al., Reference Reynolds, Cozza and Shear2017).
Network analysis offers a novel flexible, data-driven methodology to increase our understanding of PCBD (Borsboom and Cramer, Reference Borsboom and Cramer2013; Robinaugh et al., Reference Robinaugh, LeBlanc, Vuletich and McNally2014). From the network perspective, psychopathological states develop and are maintained because of mutually reinforcing interactions among symptoms. Using network analysis, it is possible to map relations between individual symptoms and identify the most important or central elements, at both acute and chronic phases (Bryant et al., Reference Bryant, Creamer, O'Donnell, Forbes, McFarlane, Silove and Hadzi-Pavlovic2017). These central symptoms maintain the psychopathological equilibrium (Hofmann et al., Reference Hofmann, Curtiss and McNally2016) and predict future impairment (Boschloo et al., Reference Boschloo, van Borkulo, Borsboom and Schoevers2016; Haag et al., Reference Haag, Robinaugh, Ehlers and Kleim2017). In addition to mapping relationships within disorders, network analysis offers visual clarification of psychiatric comorbidities, showing which symptoms bridge across different disorders (Cramer et al., Reference Cramer, Waldorp, van der Maas and Borsboom2010; Schmittmann et al., Reference Schmittmann, Cramer, Waldorp, Epskamp, Kievit and Borsboom2013). For example, Robinaugh et al. (Reference Robinaugh, LeBlanc, Vuletich and McNally2014) used network analysis to investigate bereavement responses and found that emotional pain emerged as the most central node in the network, having links to many other symptoms. Further, symptoms of grief and depression clustered separately, with loneliness appearing to act as a ‘bridging node’ linking the grief and depression clusters. Similarly, Fried et al. (Reference Fried, Bockting, Arjadi, Borsboom, Amshoff, Cramer, Epskamp, Tuerlinckx, Carr and Stroebe2015) examined depression in widowed and married individuals and identified loneliness as an important node for symptoms activation.
These studies highlight the potential insights that can be gained from network analysis. However, both Robinaugh et al. (Reference Robinaugh, LeBlanc, Vuletich and McNally2014) and Fried et al. (Reference Fried, Bockting, Arjadi, Borsboom, Amshoff, Cramer, Epskamp, Tuerlinckx, Carr and Stroebe2015) constructed networks using archival data garnered from the Changing Lives of Older Couples (CLOC) study. This study predated the development of diagnostic categorization for grief-related pathology; symptoms comprising PCBD either had to be deduced from other survey items or were absent from the analysis (Robinaugh et al., Reference Robinaugh, LeBlanc, Vuletich and McNally2014). The mean age of the participants was also over 70, potentially limiting the generalizability of the findings. Subsequently, Maccallum et al. (Reference Maccallum, Malgaroli and Bonanno2017) applied network analysis to two new grief data sets, one comprised of individuals who had lost a spouse and one on individuals who had lost a parent. Interestingly, no significant differences emerged between the networks. In both networks, yearning and emotional pain were strongly linked, meaninglessness was relatively central, and avoidance was relatively peripheral. Again, however, this study did not include all items of PCBD.
A number of important questions remain. Networks have yet to include all PCBD symptoms, or to examine their relations within the first 6 months of bereavement. Although PCBD requires 12 months before diagnosis, understanding how symptoms emerge and interact in the early stages of bereavement may provide important opportunities for early intervention and prevention of PCBD. Additionally, there is an absence of information on relationships between PCBD symptoms of co-morbidity beyond depression. Depression is only one of the common comorbid conditions observed with PCBD (Simon et al., Reference Simon, Shear, Thompson, Zalta, Perlman, Reynolds, Frank, Melhem and Silowash2007). To address these gaps in the literature, we applied a network analysis to PCBD symptoms using a newly collected data set. Our sample consisted of adults who recently lost a spouse and were assessed 3 months post-loss, a year later, and again 2 years later. Additionally, as an alternative to self-report, we obtained symptoms measures using structured clinical interviews. To the best of our knowledge, this is the first research to use data from grief-specific clinical interviews to test PCBD symptom structure.
A first goal of our study was to identify network structures of PCBD and to compare these networks with previous findings. We were particularly interested in identifying the most central symptoms during acute and distal periods of bereavement. Identifying these symptoms may offer viable heuristics to plan clinical intervention (Fried et al., Reference Fried, Eidhof, Palic, Costantini, Huisman-van Dijk, Bockting, Engelhard, Armour, Nielsen and Karstoft2018) and forestall the development of psychopathology (McNally, Reference McNally2016). Moreover, recent applications of Bayesian approaches allow for the examination of key pathways of activation among symptoms (McNally, Reference McNally2016). Thus, as a second goal, we applied Bayesian network modeling to explore potential causal interactions among acute symptoms, examining the dominant pathways of activation leading to psychopathological configurations. Finally, the third goal was to assess PCBD's broader comorbidity. Although preliminary research has examined the relation between grief and depression, no study has examined the relationship between grief and trauma symptoms. Therefore, we analyzed the interactions and connections between PCBD and post-traumatic stress disorder (PTSD), as well as PCBD and major depression.
Methods
Participants and procedures
Participants were bereaved individuals younger than 65 years of age who had recently lost a spouse. Recruitment was accomplished by invitation letters based on public death listings, obituaries, and support group referrals, and by fliers and internet, and newspaper advertisements. Bereavement was verified by death certificates. Participants were administered structured clinical interviews at 3 months post-loss (T1: M = 2.67; s.d. = 1.01), 14 months post-loss (T2: M = 14.25; s.d. = .98), and 25 months post-loss (T3: M = 24.92; s.d. = .64).
The final sample consisted of 305 individuals. The mean age was 55.25 (s.d. = 7.23) at the T1 interview. Participants were two-thirds female (66.4%) and predominantly white (88.2%). The majority of the sample had a college degree or above (70%) and worked full time (61.5%). The sample sizes at T1, T2, and T3 were 260, 263, and 271, respectively; 207 participants completed all three sessions.
Measures
Participants were administered structured clinical interviews to assess the symptoms corresponding to the DSM-5 criteria (APA, 2013) to PCBD, major depressive disorder (MDD), and PTSD. Participants responded to the PTSD items with the death as the trauma index (criterion A). Interviews were conducted by psychologists and advanced doctoral candidates in clinical psychology and videotaped. A randomly selected set of five interviews was recoded for reliability. Interclass correlation (ICC = 0.94) for absolute agreement indicated high rater reliability. Symptoms items were scored on a 1–3 scale, with higher scores indicating greater intensity and frequency and a score of 3 fully meeting diagnostic criteria.
Statistical analyses
A series of networks models were estimated using R (R Core Team, 2016). Networks are graphical models consisting of nodes and edges. Nodes represent the individual symptoms included in the analysis. Edges represent the relationships between two nodes, after conditioning on all other nodes in the analysis. In the graphical models, thicker edges represent stronger associations between symptoms.
Undirected networks
For each time point, Gaussian graphical models (GGM; Epskamp et al., Reference Epskamp, Kruis and Marsman2017, Reference Epskamp, Cramer, Waldorp, Schmittmann and Borsboom2018b) of PCBD symptoms were calculated using the R package qgraph (Epskamp et al., Reference Epskamp, Cramer, Waldorp, Schmittmann and Borsboom2012). GGM are undirected networks where edges represent partial correlation coefficients. GGM estimation combines applying graphical LASSO penalties (Friedman et al., Reference Friedman, Hastie and Tibshirani2008) and model selection based on the extended Bayesian information criterion (EBIC; Foygel and Drton, Reference Foygel and Drton2010). This method causes small edges to shrink and removes spurious connections between nodes based on indirect relationships with a third node, resulting in more parsimonious networks (Epskamp and Fried, Reference Epskamp and Fried2018; Epskamp et al., Reference Epskamp, Borsboom and Fried2018a). For all network estimations, the EBIC γ hyperparameter was set to 0.10, to enhance discovery and allow the estimation of more edges (Epskamp and Fried, Reference Epskamp and Fried2018).
Symptoms data were not multivariate normally distributed, given the number of scoring categories and skewness of psychopathological data. To relax GGM assumptions of normality, a non-paranormal transformation (i.e. Gaussianization; Liu et al., Reference Liu, Lafferty and Wasserman2009) was applied to the data prior to modeling using the R package Huge (Zhao et al., Reference Zhao, Liu, Roeder, Lafferty and Wasserman2012).
Symptom importance was assessed using the strength index of node centrality. This corresponded to the sum of the weights of the edges attached to each node. Other measures of centrality include closeness (inverse of the sum of the distances of a node from all other) and betweenness (number of times in which a node lies on the shortest path between two other nodes). To ensure interpretability of the three estimated PCBD networks, network stability was analyzed using the R package Bootnet (Epskamp et al., Reference Epskamp, Borsboom and Fried2018a). Non-parametric bootstrapping was performed to compute 95% confidence intervals (CI) of edge-weight accuracy. Additionally, bootstrapped tests were performed to determine significant differences between network edges and node strengths. To determine the stability of centrality indices, case-dropping bootstrap was performed to compute correlation stability (CS). CS scores should not be below 0.25, while above 0.50 they suggest strong stability and interpretability (Epskamp et al., Reference Epskamp, Borsboom and Fried2018a).
Differences in network connectivity across the three time points were assessed using the R package NetworkComparisonTest (NCT; van Borkulo et al., Reference van Borkulo, Waldorp, Boschloo, Kossakowski, Tio, Schoevers and Borsboom2017). The NCT is a permutation-based hypothesis test that analyzes differences in the weighted sum of the absolute connections in networks for repeated samples of bootstrapped individuals (van Borkulo et al., Reference van Borkulo, Waldorp, Boschloo, Kossakowski, Tio, Schoevers and Borsboom2017). The sampling procedure was repeated 5000 times for each comparison. The NCT indicates when differences in global strength between two networks or between individual edges are meaningful (p ⩽ 0.5).
Directed network
A directed acyclic graph (DAG; Scutari and Denis, Reference Scutari and Denis2014) of PCBD symptoms was calculated using the R package bnlearn (Scutari, Reference Scutari2010). PCBD data from 3 months post-loss was used for the DAG, given the importance of early symptoms activation pathways. DAG are Bayesian networks in which nodes are connected by directed edges (i.e. arrows), allowing causal interpretation of the relationships among nodes (Pearl, Reference Pearl2009). Variables are placed in a putative causal cascade, where upstream variables constitute the causes of downstream variables (Moffa et al., Reference Moffa, Catone, Kuipers, Kuipers, Freeman, Marwaha, Lennox, Broome and Bebbington2017). The direction of the arrows in the DAG indicates the direction of the prediction (how the activation of one symptom predicts the activation of another). DAG do not assume feedback loops; that is, the arrows represent the dominant pathway of activation between items included in the model, not the exclusive pathway. It is likely that there are bidirectional symptom relationships and loops associated with the syndrome. Clues to bidirectionality in a DAG can only be suggested in the presence of thin edges (McNally et al., Reference McNally, Heeren and Robinaugh2017a). Combined analysis of undirected networks (with mutual interactions among nodes) and of directed networks (with no feedback loops) allows for a more confident interpretation of the symptoms’ network structure (Bernstein et al., Reference Bernstein, Heeren and McNally2017; McNally et al., Reference McNally, Mair, Mugno and Riemann2017).
The DAG was computed using a Hill–Climbing algorithm (Daly and Shen, Reference Daly and Shen2007). The estimation involved three steps to ensure stability of the model (Scutari and Nagarajan, Reference Scutari and Nagarajan2013). First, a DAG was generated from the entire sample, using 50 random re-starts and 100 perturbations for each re-start. This iterative procedure determined the presence/absence of the connections between each node, using BIC as model fit criteria. Next, the significance, direction, and strength of the edges were estimated based on their frequency in a set of 1000 networks generated through bootstrapping (McNally et al., Reference McNally, Mair, Mugno and Riemann2017). To determine which edges were statistically significant, an empirical threshold was estimated based on averaging the bootstrapped models (Scutari and Nagarajan, Reference Scutari and Nagarajan2013). An edge was retained in the final model if it exceeded the cutoff threshold of the bootstrapped models. Direction of the significant edges was based on their mode direction (i.e. where the arrow was pointing in the majority of the bootstrapped networks). Strength of the edges was based on their averaged BIC values.
Comorbidity networks
We explored PCBD comorbidity structure by estimating undirected networks of PCBD and MDD symptoms, and PCBD and PTSD symptoms, respectively. This analysis was conducted on symptoms at 14 months post-loss, given diagnostic salience of this time point. The GGM estimations for the comorbidity networks and their respective stability analyses used the same parameters as the PCBD networks. To further assess the comorbidity structure, we examined symptom communities in each network using the R package igraph (Csardi and Nepusz, Reference Csardi and Nepusz2006). A community is a subset, or cluster, of nodes within a network that has many connections within that cluster but few connections outside of it. Possible subsets of symptoms were identified using the spinglass algorithm (Reichardt and Bornholdt, Reference Reichardt and Bornholdt2006). The algorithm was run 1000 times, each time changing the seed, in order to determine the most stable number of clusters.
Results
Mean symptom frequencies for each time point are reported in Table 1. Most prevalent PCBD symptoms across all time points were yearning, preoccupation with death, and emotional pain.
Table 1. DSM-5 symptoms of PCBD at 3 months (N = 260), 14 months (N = 263), and 25 months (N = 271) after the loss. Comorbid MDD and PTSD symptoms at 14 months

M, mean; s.d., standard deviation.
Percentage of sample meeting criteria at 14 months post-loss: MDD (12.9%), PCBD (9.5%), PTSD (4.9%).
Grief networks
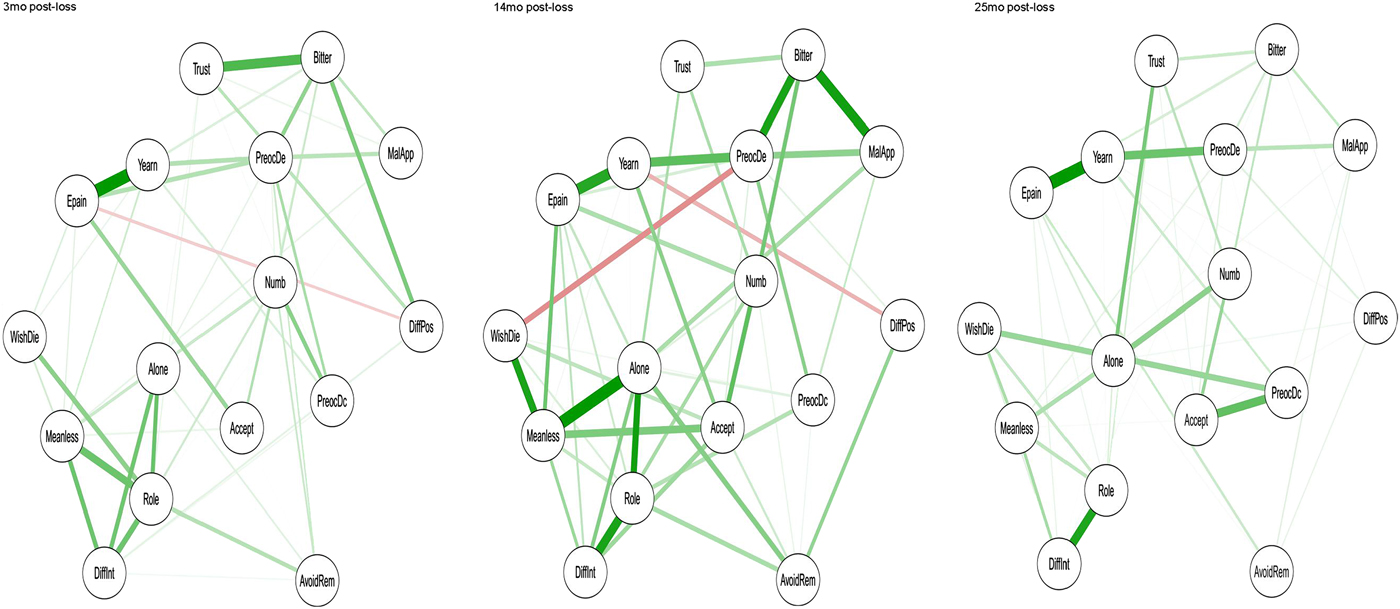
The GGM networks representing the constellations of grief symptoms at T1, T2, and T3 are presented in Fig. 1. Strength centrality indices for each network are depicted in Fig. 2. The CS for strength was 0.52 for all three networks. Consistent with previous research (Maccallum et al., Reference Maccallum, Malgaroli and Bonanno2017; Epskamp et al., Reference Epskamp, Borsboom and Fried2018a), the relative order of closeness and betweenness were found to be less stable than strength in our analyses and below 0.50. Stability analysis also indicated a degree of overlapping among the edges’ 95% CI, suggesting caution in drawing conclusions about the differential strength of relationships for all but the strongest edges. Therefore, results focus on node strength and on the pairwise differences between edge-weights that were non-zero. Full results from the network stability analyses are presented in the online Supplementary materials.

Fig. 1. GGM networks with identical positioning (layout) of PCBD symptoms (16 nodes) at 3, 14, and 25 months post-loss. Note: Yearn, persistent yearning; Epain, emotional pain; PreocDc, preoccupation deceased; PreocDe, preoccupation circumstances death; Accept, difficulty accepting loss; Numb, numbness; DiffPos, difficulties positive reminiscing; Bitter, bitterness/anger related to loss; MalApp, maladaptive appraisal; AvoidRem, avoidance reminders loss; WishDie, wish to die to join deceased; Trust, difficulties trusting others; Alone, loneliness; Meanless, meaninglessness; Role, role confusion; DiffInt, difficulties pursuing interests.

Fig. 2. Comparison of strength network centrality for symptoms of PCBD at 3, 14, and 25 months post-loss.
At 3 months post-loss, role confusion, bitterness, meaninglessness, and preoccupation with death were the most central symptoms in the network (Fig. 2). Strong and significant edges emerged between yearning and emotional pain, and between bitterness and difficulties trusting others. Also, stable connections emerged between role confusion and, respectively, loneliness, difficulty pursuing interest, and meaninglessness.
At 14 months post-loss, role confusion and meaninglessness remained central elements of the network. Interestingly, loneliness, while less prominent in the first assessment, emerged as highly central at T2. Significant edges also connected loneliness with role confusion and meaninglessness, which were, respectively, associated with difficulty pursuing interest and join deceased. Yearning and emotional pain remained significantly interconnected. Bitterness, while less central compared with T1, showed stable connections with maladaptive appraisal and preoccupation with death.
At 25 months post-loss, loneliness remained the symptom with greatest strength centrality, displaying associations with multiple other symptoms, particularly with difficulties trusting others and numbness. Role confusion also stayed highly central in the network, and was linked with difficulties pursuing interests. Yearning and emotional pain continued to be significantly associated, while their prominence increased relative to the previous observations. Yearning was also reliably associated with preoccupation with death. Lastly, meaninglessness was once more among the most central symptoms in the network.
The PCBD networks were tested for significant discrepancies in the network structure at each time point. The omnibus test results indicated no significant differences between networks in terms of global strength and network structure. No edges differed significantly across the networks. Full results are reported in the online Supplementary material. Overall, there were no significant discrepancies in the connections among PCBD symptoms across the three assessments.
Directed network
The DAG estimated from PCBD symptoms at 3 months post-loss is presented in Fig. 3. Arrows indicate significant predictive relationships, while their thickness represents greater importance to the network structure. Symptoms at the top of the network are estimated to have predictive priority compared with the others.

Fig. 3. Directed acyclic graph (DAG), depicting PCBD symptoms (16 nodes) at 3 months post-loss. Arrows’ thickness represents the importance of the estimated significant relationships. Note: Yearn, persistent yearning; Epain, emotional pain; PreocDc, preoccupation deceased; PreocDe, preoccupation circumstances death; Accept, difficulty accepting loss; Numb, numbness; DiffPos, difficulties positive reminiscing; Bitter, bitterness/anger related to loss; MalApp, maladaptive appraisal; AvoidRem, avoidance reminders loss; WishDie, wish to die to join deceased; Trust, difficulties trusting others; Alone, loneliness; Meanless, meaninglessness; Role, role confusion; DiffInt, difficulties pursuing interests.
The DAG suggested that yearning was most salient, as indicated by its highest position in the model. Yearning predicted the activation of emotional pain, meaninglessness, and preoccupation with death, which in turn activated a cascade of several other symptoms. Specifically, meaninglessness predicted difficulties pursuing interests and role confusion, which in turn predicted loneliness, wish to die, avoidance reminders, and numbness. Preoccupation with death also activated numbness, along with preoccupation with deceased, bitterness, maladaptive appraisals, loneliness, and avoidance remainders. The activation of bitterness was associated with difficulties trusting, difficulties positive reminiscing, maladaptive appraisals, and difficulties accepting loss. While the DAG estimated two main branches of activation, some nodes (e.g. role confusion, preoccupation with death) appeared to act as ‘bridges’ between these pathways.
Comorbidity networks
MDD comorbidity
The GGM including symptoms of PCDB and MDD is presented in Fig. 4a. The network's CS coefficient was 0.51 for strength. Centrality and full stability analyses as well as clusters’ spread are reported in online Supplementary materials. The spinglass algorithm clustered grief symptoms separately from most depressive symptoms. Specifically, five clusters of symptoms were suggested: ‘depression’ (depressed mood, anhedonia, weight loss/gain, disturbed sleep, psychomotor agitation/retardation, fatigue, difficulties concentrating, and difficulties pursuing interest), ‘suicidality’ (suicidality, join deceased, and meaninglessness), ‘emotional distress’ (yearning, emotional pain, difficulties accepting loss and numbness), ‘distorted appraisal’ (worthlessness, maladaptive appraisal, preoccupation with death, difficulties positive reminiscing, bitterness, and difficulties trusting others), ‘avoidance’ (loneliness, avoidance reminders, preoccupation with deceased, and role confusion).

Fig. 4. GMM comorbidity networks of PCBD with MDD symptoms (25 nodes), and PCBD with PTSD symptoms (30 nodes) at 14 months post-loss.
PTSD comorbidity
The GMM network of PCBD and PTSD is presented in Fig. 4b. Centrality indices for all symptoms, their stability, as well communities spread are reported in online Supplementary materials. CS score for strength was 0.44. Grief and PTSD symptoms formed mixed clusters within the network. Six communities of symptoms were detected: ‘distressful remembrance’ (yearning, emotional pain, dissociative reactions, difficulties accepting loss, numbness, intrusive memories, and distressing dreams), ‘re-engagement difficulties’ (avoidance reminders, loneliness, difficulties pursuing interests, role confusion, meaninglessness, wish to join deceased, inability positive emotions, and physiological reaction to reminders), ‘negative alterations’ (negative emotional state, distorted blame, maladaptive appraisal, difficulties positive reminiscing, bitterness, preoccupation with the death, distress at exposure, and reckless behavior), ‘negativity’ (negative beliefs, difficulties trusting, and aggressive behavior), ‘dissociation’ (inability remembering and preoccupation with deceased), and ‘reactivity’ (hypervigilance and startle response).
Discussion
Networks analysis offers powerful empirical tools to visualize interactions among symptoms of mental disorders. Using structured interview data, we applied network analysis to map the relationships between grief symptoms over time, and the relationships between symptoms of PCBD and common comorbid conditions. Our first goal was to identify the network structure of PCBD and the most central nodes. Across three time points, role confusion, meaninglessness and loneliness were the most central symptoms of the network. That is, these symptoms had strong connections signifying that when they were present so were many other nodes. This importance of these nodes within the network is consistent with the findings of Robinaugh et al. (Reference Robinaugh, LeBlanc, Vuletich and McNally2014) and Maccallum et al. (Reference Maccallum, Malgaroli and Bonanno2017). Findings are also concordant with theoretical models of bereavement that identify meaning-making and role transaction as key elements in the adaptation process (Stroebe and Schut, Reference Stroebe and Schut2001; Maccallum and Bryant, Reference Maccallum and Bryant2013; Parkes and Prigerson, Reference Parkes and Prigerson2013) and treatment programs that target meaning and identity disruptions (Bryant et al., Reference Bryant, Kenny, Joscelyne, Rawson, Maccallum, Cahill, Hopwood, Aderka and Nickerson2014; Neimeyer, Reference Neimeyer2016; Shear et al., Reference Shear, Reynolds, Simon, Zisook, Wang, Mauro, Duan, Lebowitz and Skritskaya2016). Crucially, our findings indicate that these symptoms are important early in bereavement. Loneliness, a central node in Fried et al. (Reference Fried, Bockting, Arjadi, Borsboom, Amshoff, Cramer, Epskamp, Tuerlinckx, Carr and Stroebe2015) but not Robinaugh et al. (Reference Robinaugh, LeBlanc, Vuletich and McNally2014; not included in the Maccallum study), showed high centrality in our study at 13 and 25 months of bereavement, further highlighting the importance of loneliness for bereavement outcome (Yan and Bonanno, Reference Yan and Bonanno2015). Overall, these findings suggest that role confusion, meaninglessness, and loneliness carry a greater role in grief pathology than currently expressed by the PCBD criteria. In fact, a PCBD diagnosis is currently possible without endorsing any of symptoms related to social/identity disruptions.
Our second goal was to assess which early bereavement symptoms carry a higher risk of spreading into psychopathological networks. Using data from 3 months post-loss, we applied a Bayesian network to examine the early relationships between PCBD symptoms. This model suggested that yearning activated the other PCBD symptoms via two main pathways. One branch lead to distorted view about the self (meaninglessness, role confusion), which in turn predicted behavioral and interpersonal problems (loneliness, avoidance remainders, join deceased, difficulties pursuing interests, difficulties trusting). The other branch activated emotional pain leading to preoccupations (about the death, about the deceased, difficulties accepting the loss) and further emotional dysfunctions (bitterness, numbness, maladaptive appraisal), aggravating interpersonal problems (avoidance remainders, difficulties trusting).
These results suggest that yearning may serve as the gateway to the manifestation of other symptoms, and echo neuroscience research highlighting the crucial role of the brains’ reward centers in grief processing (O'Connor et al., Reference O'Connor, Wellisch, Stanton, Eisenberger, Irwin and Lieberman2008; Schneck et al., Reference Schneck, Tu, Michel, Bonanno, Sajda and Mann2017). While social/identity disruptions (i.e. meaninglessness, role confusion, and loneliness) are the most central elements of the symptom networks (as seen in the GMMs), these findings suggest that increased yearning activates these symptoms and leads the system into a psychopathological state (Hofmann et al., Reference Hofmann, Curtiss and McNally2016). Once in a state of grief distress, meaning-making and role transaction difficulties are the elements that appear to sustain maladaptive coping and associated problems in functioning. Further, loneliness, which was not a central feature of the T1 network, appeared toward the end of the DAG pathway, suggesting that loneliness may emerge from the failure to regulate the other grief symptoms. Caution is required in drawing conclusions from such cross-sectional exploratory analyses. Nonetheless, in mapping the dominant pathways among nodes, the DAG suggests the compelling possibility that reducing the intensity of yearning, emotional pain, or other nodes toward the beginning of the network could potentially forestall or at least minimize the network spread of psychopathological symptoms (McNally et al., Reference McNally, Robinaugh, Wu, Wang, Deserno and Borsboom2015).
Our third goal was to examine how depression and trauma symptoms interact with PCBD. Previous network analyses of grief-related psychopathology have focused exclusively on examining comorbidity with depression. In our MDD comorbidity network, the majority of depression symptoms clustered independently of PCBD, the only exceptions being suicidality (clustering with meaninglessness and join deceased) and worthlessness/guilt (clustering with distorted appraisals). This finding is consistent with previous network analyses (Robinaugh et al., Reference Robinaugh, LeBlanc, Vuletich and McNally2014; Maccallum et al., Reference Maccallum, Malgaroli and Bonanno2017) and previous literature distinguishing pathological grief from depression (Boelen and van den Bout, Reference Boelen and van den Bout2005; Bonanno et al., Reference Bonanno, Neria, Mancini, Coifman, Litz and Insel2007). In the PTSD comorbidity network, symptoms formed communities with less clear boundaries between the two diagnoses. The ‘distressful remembrance’ cluster included some of the more characteristic symptoms of both diagnoses (e.g. yearning, emotional pain, dissociative reactions, intrusive memories). Whereas, other clusters such as ‘re-engagement difficulties’ included predominantly grief symptoms associated with identity/self-disruptions, while the PTSD symptoms of hyperarousal and hypervigilance clustered independently, and had no connections with the reset of the network. Ultimately, both conditions may show a certain degree of overlap as they were conceptualized as stress-related syndromes (Horowitz, Reference Horowitz1986), in which chronic symptoms are thought to result from poor adjustment to potentially traumatic events (Bonanno, Reference Bonanno2004). While the nosological basis distinguishing PCBD and MDD could be less clear for PCBD and PTSD, it is important to understand the differences. Of salience are that social/identity are primarily connected to PCBD criteria, while marked alterations in arousal and safety concerns were not connected to grief.
This study has a number of strengths. This is the first published study that explored PCBD networks using symptom data obtained from multiple structured clinical interviews. We included data at 3 months post-loss, providing potentially important insights into the development of grief-related psychopathology. Moreover, the Bayesian network approach offered suggestions on the causal structure of PCBD. These analyses provided insights regarding the possible core symptoms of PCBD, and the role of persistent yearnings as a source of their manifestation. Despite its advantages however, there are limitations to the conclusions that might be drawn from the study. For example, our bereaved sample consisted of predominantly white females who suffered a spousal loss. Although previous research had suggested surprisingly few differences in the longitudinal course of bereavement following different types of loss (Maccallum et al., Reference Maccallum, Galatzer-Levy and Bonanno2015), future network research should extend to other loss types with greater ethnic and racial variation. Also, our subjects were recruited from the community and participation in the study was voluntary. While the proportions of clinically distressed individuals in our sample was consistent with population rates (Lundorff et al., Reference Lundorff, Holmgren, Zachariae, Farver-Vestergaard and O'Connor2017), the proportions were relatively low. Consequently, the extent to which the findings generalize to clinical samples awaits further investigation.
It is important to note that network modeling is dependent on the nodes that are included in the analysis. In the current study, we aimed to examine the symptom structure of diagnostic categories and so included all symptoms from DSM-5 diagnoses. It is possible that some of the nodes in the network represent the same semantic cluster (e.g. suicidality and join deceased), rather than the interaction of otherwise independent constructs. Also, the power to reliability estimate networks is impacted both by the number of nodes and sample size. In the absence of clear guidelines, a proposed rule of thumb suggests three participants per estimated parameter (Fried and Cramer, Reference Fried and Cramer2017), based on which our sample would be relatively small for the PCBD network and even more so for the comorbidity networks, particularly for PTSD. While the stability analysis indicated fair robustness of the PCBD networks, caution is warranted when interpreting anything but the strongest edges. Previous studies that analyzed network stability showed similarly large CI (Armour et al., Reference Armour, Fried, Deserno, Tsai and Pietrzak2017; Epskamp et al., Reference Epskamp, Kruis and Marsman2017, Reference Epskamp, Waldorp, Mottus and Borsboom2018b; Santos et al., Reference Santos, Fried, Asafu-Adjei and Ruiz2017). Simulation studies indicated that networks estimated with suboptimal sample sizes had more sparse edges than the true network (Epskamp et al., Reference Epskamp, Kruis and Marsman2017, Reference Epskamp, Waldorp, Mottus and Borsboom2018b). Such sparseness may have affected some of the edges in our network. Furthermore, given non-linearity of our symptoms data, we chose to apply a non-paranormal transformation. Alternative analytic approaches could have been used, such as polychoric correlations or Ising models. Larger sample sizes will be required to replicate more confidently the findings of the comorbidity networks (particularly with multiple disorders concurrently), or to apply DAG analysis with comorbid disorders. In addition, diagnostic categories do not include all nodes thought to be relevant to the development and maintenance of psychopathology. A next step would be to extend this work by including nodes representing theoretically relevant mechanisms. For example, including behavioral measures or biological factors already associated with psychopathology, such as immune markers (Kiecolt-Glaser et al., Reference Kiecolt-Glaser, Derry and Fagundes2015) or neuroendocrine markers like cortisol (Goodyer et al., Reference Goodyer, Park, Netherton and Herbert2001), would help shed light on their relationship to symptomatology. Finally, we note that out networks were based on three ‘snapshots’ (3, 14, and 25 months post-loss) and the temporal dynamics between symptoms are unknown. Future longitudinal studies indexing symptoms on multiple observations taken close in time, or experimental studies manipulating of node strength, could also be used to examine the dynamic structure of psychopathology. Each of these directions comes with its own methodological and statistical challenges. Ultimately, it is by assessing the symptoms and possible mechanisms across a range of timeframes using a range of methodologies that we will better understand the complexity of relationships between PCBD symptoms and improve outcomes for those suffering from chronic and persistent distress.
Supplementary material
The supplementary material for this article can be found at https://doi.org/10.1017/S0033291718001769.
Acknowledgements
This research was funded by NIH grant R01MH 091034 awarded to George A Bonanno. Fiona Maccallum was supported by a National Health and Medical Research Council Early Career Research Fellowship (GNT1053997).
Conflict of interest
None.
Ethical standards
All procedures contributing to this work comply with the ethical standards of the relevant national and institutional committees on human experimentation and with the Helsinki Declaration of 1975, as revised in 2008.