Introduction
Ethiopia is one of the major centre of diversity for many plant species (Vavilov, Reference Vavilov1951) with its more than 60,000 accessions of different crops maintained in its genebank (IBC, 2008). Durum wheat (Triticum turgidum var durum Desf) is among the most diversified crop species in Ethiopia accounting for about 12% (~7000 accessions) of the national genebank holdings. Farmer varieties (FVs), which are often referred as ‘landraces’ in the literatures, are characterized a significant phenotypic variability (Mengistu et al., Reference Mengistu, Kidane, Catellani, Frascaroli, Fadda, Pè and Dell'Acqua2016). Many FVs are maintained for their yield stability even under poor soil conditions (Hammer and Diederichsen, Reference Hammer, Diederichsen, Veteläinen, Negri and Maxted2009) or exposure to harsh climatic conditions. It has been reported that Ethiopian durum wheat have valuable genetic basis for abiotic and biotic stresses adaptations such as resistance to Erysiphe graminis f. Sp. Tritici, Puccinia spp. and Septori anodorum (Negassa, Reference Negassa1986), stem rust (Ug99 or TTKS race) (Klindworth et al., Reference Klindworth, Miller, Jin and Xu2007) and drought tolerance (Tesfaye, Reference Tesfaye2009; Mengistu et al., Reference Mengistu, Afeworki, Fadda, Pè, Girmay, Amanuel, Habtam, Dereje, Tsehaye, Ayele, Tesfaye and Goitom2015). Crops possessing adaptation potential are very much required for northern Ethiopia in general and Tigray in particular, where water and heat stress are the major constraints (Meze-Hausken, Reference Mez-Hausken2004; Araya and Stroosnijder, Reference Araya and Stroosnijder2010).
The majority of durum wheat grown in marginal areas are FVs; however, a few of IMVs are also are under production. The large number of durum wheat FVs conserved ex situ, once properly characterized, might represent very valuable genetic material to be made easily accessible to farmers’ marginal environments. Additionally, they may immediately benefit if superior varieties are available to them. This requires proper evaluation of ex situ conserved germplasm for agronomical, phenological and adaptive traits variation and their comparison with IMVs for the considered traits. To date, IMVs under cultivation in Ethiopia are characterized by a narrow genetic basis (Jemanesh et al., Reference Jemanesh, Hammer, Ayele, Nachit and Röder2013; Mengistu et al., Reference Mengistu, Kidane, Catellani, Frascaroli, Fadda, Pè and Dell'Acqua2016) because they are of exotic introductions. Mengistu et al. (Reference Mengistu, Afeworki, Fadda, Pè, Girmay, Amanuel, Habtam, Dereje, Tsehaye, Ayele, Tesfaye and Goitom2015) and Mengistu and Pè (Reference Mengistu and Pè2016) studies showed that IMVs manifested inferior performance compared with FVs (both grown in marginal environments). Such knowledge on variability in performance of both IMVs and FVs is crucial to select parents in crosses aimed to maximize possible genetic gain (Tar′an et al., Reference Tar′an, Zhang, Warkentin, Tullu and Vandenberg2005; Mondini et al., Reference Mondini, Farina, Porceddu and Pagnotta2009; Van Inghelandt et al., Reference Van Inghelandt, Melchinger, Lebreton and Stich2010). For low input agriculture, characteristic of the small farming system in northern Ethiopia, the valorization of the large genetic variation present in FVs in breeding programs for traits such as yield per se and tolerance to biotic and abiotic stresses is likely the most economical and effective to respond to small farmers need (Lopes et al., Reference Lopes, El-Basyoni, Baenziger, Singh, Royo, Ozbek, Aktas, Ozer, Ozdemir, Manickavelu, Ban and Vikram2015; Mohammadi et al., Reference Mohammadi, Sadeghzadeh, Ahmadi, Bahrami and Amri2015). In the current field we conducted field phenotyping to investigate the phenotypic diversity in a large sample of 289 Ethiopian durum wheat genotypes, using quantitative morphological markers. The aim was to provide information to breeders and genebank managers on the extent of the existing phenotypic and genetic diversity for relevant phenological and agronomic traits in the subset of the large collection of Ethiopian durum wheat accessions available in the Ethiopia genebank.
Materials and methods
Genotypes and experimental layout
A set of 289 durum wheat genotypes, 265 FVs plus 24 IMVs (online Supplementary Table S1), was evaluated at two designated wheat testing locations of northern Ethiopia in the Tigray region (Hagreselam) and the Amhara region (Geregera) (online Supplementary Fig. S1) for 2 consecutive years (2012 and 2013). The two locations are considered to be representatives of the major wheat growing areas in the two aforementioned regions. The Hagreselam location is situated at 13°39ʹ04ʺN, 39°07ʹ28ʺE at an elevation of 2583 meter above sea level (masl). Its mean annual rainfall is about 680 mm with an annual mean temperature of 18.5°C (Tagel and van der Veen, Reference Tagel and van der Veen2013). The soil in Hagreselam is clay loam. Whereas Geregera is located at 11°40ʹ56ʺN and 38°41ʹ00ʺE at 2875 masl and it is characterized by relatively higher rainfall (1100 mm) and cooler temperature (16.7°C) than Hagreselam. Its soil type is similar to that of Hagreselam.
To maintain uniformity of experimental applications, at both locations and during the 2 years, each genotype was sown in six rows of 2.5 m long and 1.2 m wide plot with 0.2 m inter-row spacing in a replicated lattice design. Standard cultural crop management practices were deployed. More specifically, fertilizer was applied at a rate of 100 kg Urea ha−1 split applied at planting (half dose) and at early tillering (the remaining half dose) and 100 kg DAP ha−1, whole applied at planting; and weeds were kept at bay. The genotypes were evaluated for the following phenological and agronomic traits: days to 50% booting (DB), days to 50% flowering (DF), maturity days (DM), number of effect tillers (NET), plant height (PH), spike length (SPL), seeds per spike (SPS), biomass yield (BY), grain yield (GY) and 1000 grain weight (TGW). The procedures of data collection for the specified traits were adapted from Mengistu and Pè (Reference Mengistu and Pè2016).
Phenotypic diversity analysis
The data were statistically analyzed using a combination of statistical software. A linear mixed model (REML) which included genotype, location, year, genotype × location interaction, genotype × year interaction, location × year, genotype × location × year interaction, replication and block effects was performed using GenStat version 14 (Payne et al., Reference Payne, Harding, Murray, Soutar, Baird, Glaser, Channing, Welham, Glimour, Thompson and Webster2009) for generating the adjusted mean as best linear unbiased predictor (BLUPs) for all traits. Consequently, the variance components were estimated according to the following statistical model:
 $$yijhkl = {\mu} + gi + ej + yh + rjk + geij + gyih + eyjh + geyijh + bkjl + {\rm \varepsilon} ijkl$$
where yijkl is the observation for genotype ‘i’ at location ‘j’ in replication ‘k’ in block ‘l’. In the model ‘μ’ is the overall mean ‘gi’ the effect of the genotype ‘i’, ‘ej’ is the effect of environment ‘j’, ‘geij’ the interaction between genotype ‘i’ within environment ‘j’, ‘gyih’ the interaction effect between genotype ‘i’ and year ‘h’, ‘eyjh’ the interaction between location ‘j’ and year ‘h’, ‘gehijh’ the three way interaction between genotype ‘i’ location ‘j’ and year ‘h’, ‘rjk’ the effect of replication ‘k’ within environment ‘j’, ‘bkl’; the effect of incomplete block ‘l’ within replication ‘k’ and ‘εijkl’ the residual value.
The overall mean ‘μ’, genotype effect ‘g’ and location effect ‘e’ in ‘eq.1’ were considered as fixed effects while year ‘h’, replication ‘k’ and incomplete block ‘l’ effects were assumed as random effects to estimate variance components. To carry out analysis of variance, the adjusted BLUPs means were used in PROC MIXED in SAS (SAS Institute, Cary, NC).
To display the relationships among the genotypes, principal component and cluster analysis were conducted. The ordination of the first two principal components (PC1 and PC2) was performed in Past version 2.17b software (Hammer et al., Reference Hammer, Harper and Ryan2001) to check the pattern of grouping of the FVs and IMVs. Cluster analysis was performed using the Minitab version 16 (Minitab Inc., 2010). The number of clusters that truly group the genotypes was determined by observing a change in the similarity and distance levels between clusters and the cut-off was decided when their values changed abruptly (online Supplementary Fig. S2). For the sake of simplicity, the clusters were presented in tabular form rather than graphically (Table 3).
Heritability and genetic advance estimation
Heritability (h 2) was estimated as:
 $$h^2 = \displaystyle{{\delta _{\rm G}^2} \over {\delta _{\rm G}^2 + (\delta _{{\rm GL}}^2 /nl) + (\delta _{{\rm GY}}^2 /ny) + (\delta _{{\rm GLY}}^2 /nly) + (\delta _{\rm e}^2 /(nlyr))}}$$
where
 $\delta _{\rm G}^2 {\rm,} \delta _{{\rm GL}}^2 {\rm,} \delta _{{\rm GY}}^2 {\rm,} \delta _{{\rm GLY}}^2 {\rm,} \delta _{\rm e}^2 $
are the genotypic variance, G × L, G × Y and G × L × Y interactions and error variance, respectively and the nl, ny and nr refer to the number of locations, years and replications, separately (Vargas et al., Reference Vargas, Combs, Alvarado, Atlin, Mathews and Crossa2013). Assuming a 5% of natural selection intensity (K = 2.06), the genetic advance, as suggested by Allard (Reference Allard1960) and Singh and Chaudhary (Reference Singh and Chaudhary1985), was calculated as:
$\delta _{\rm G}^2 {\rm,} \delta _{{\rm GL}}^2 {\rm,} \delta _{{\rm GY}}^2 {\rm,} \delta _{{\rm GLY}}^2 {\rm,} \delta _{\rm e}^2 $
are the genotypic variance, G × L, G × Y and G × L × Y interactions and error variance, respectively and the nl, ny and nr refer to the number of locations, years and replications, separately (Vargas et al., Reference Vargas, Combs, Alvarado, Atlin, Mathews and Crossa2013). Assuming a 5% of natural selection intensity (K = 2.06), the genetic advance, as suggested by Allard (Reference Allard1960) and Singh and Chaudhary (Reference Singh and Chaudhary1985), was calculated as:
 $$GA = K.\sqrt {\delta _{{\rm ph}}^2} \;. h^2 $$
where GA is genetic advance, ‘K’ is constant with value of 2.06 at 5% selection intensity,
 $\sqrt {\delta _{{\rm ph}}^2} $
is the square roots of phenotypic variance and h
2 is broad – sense heritability.
$\sqrt {\delta _{{\rm ph}}^2} $
is the square roots of phenotypic variance and h
2 is broad – sense heritability.
Results
Phenotyping revealed a large genetic variation for major traits
The analysis of variance has revealed very significant effects on majority of the studied traits from genotypes, locations and years with R 2 value ranging from 57% for SPS to 86% for DM (Table 1). The genotypes showed a highly significant variation (P < 0.001) for DB, DF, DM, PH, SPL, SPS, TGW, BY and GY but insignificant for NET. The test locations have had also a pronounced effects ranging from highly significant (P < 0.001) on seven of the ten traits to insignificant on DF and SPS (Table 1). The seasonal variations (within the test years) also significantly affected (P < 0.001) the majority of the traits. Differently, the genotype × location and genotype × year interactions did not induce significant variation on all the ten traits, except DB for genotype × location interaction. This implies that the different genotypes performed differently based on environmental conditions, either imposed by location or years. In other words, genotypes are not co-varying with the environment and their interaction is not significant. The two way interaction between the two environments, however, had a significant effect on all traits except DM. The three way interaction between genotype, location and year (G × L × Y) did not demonstrate a pronounced effect; only reaching P < 0.05 significance level on GY and BY. The response of grain and biomass yields to the complex interaction indicated that they are under the influence of complex factors, compounded by the complexity of the traits themselves.
Table 1. Mean squares for phenological and morpho-agronomic traits of durum wheat as affected by genotype diversity, spatial and temporal variations

SV, source of variations; B(R), blocks nested in replication; df, degree of freedom; DB, days to 50% booting; DF, days to 50% flowering; DM, days to physiological maturity; NET, number of effective tillers; PH, plant height; SPL, spike length; SPS, number of seeds per spike; BY, biomass yield; GY, grain yield and TGW, 1000 grains weight.
*Significant at P < 0.001, **Significant at P < 0.01, ***Significant at P < 0.05 and nsNon-significant difference.
FVs display a wider genetic variation than IMVs
The two groups of genotypes showed different level of diversity for the studied traits. The statistical values summarized in online Supplementary Table S2 indicate that the FVs are more diverse than IMVs for all traits, showing larger variation for these traits. Worth noticing are plant height, with range values of 29.13 cm and days to maturity with an interval of 21 days. With respect to grain and biomass yields, the FVs variation ranged 1.5 and 4.1 t ha−1, respectively. Table 2 shows the top 5% performing genotypes for DM, BY and GY with special emphasis given to GY. Only two IMVs were identified in the top 5% most performing genotypes. The superior FVs contained interesting traits. For instance, FVs such as 280 (214357), 220 (8208) and 337 (222682) are early maturing as well as gave high grain yield (Table 2), two most important traits for dryland environments. On the other hand, genotypes like 104 (226834A), 210 (222426), 220 (8208), 280 (214357) and 284 (222332) are characterized by high grain and biomass yields. The use of these FVs in wheat breeding programs could help improve both traits simultaneously in just a single cross.
Table 2. Top 5% performing genotypes (Gen) for overall mean, location and season mean for grain yield showing the associated days to maturity and biomass yield

DM, days to physiological maturity; BY, biomass yield; GY, grain yield.
The grand mean (μ) for each trait shown at the bottom of the table.
a Improved varieties.
Adaptation of genotypes to spatial and temporal variations
The effects of location on each of the considered traits were noted to range from insignificant for DF and SPS to highly significant (P < 0.001) for the remaining traits except for NET (P < 0.05). This implies that the mean performance of the genotypes at the two locations is very different. The minimum, maximum and mean values of each trait at each location (online Supplementary Table S2) is an evidence for differential performance of the genotypes across the designated locations. The majority of the top 5% genotypes presented in online Supplementary Tables S2 and S5, have displayed specific adaptation while three FVs such as104 (238567), 280 (214357) and 283 (208279) have shown superior performance at both locations. It might imply that these genotypes may have wider adaptation for grain yield and related traits. The temporal variation was also observed in the same way as the spatial one where the 2013 cropping season tend to limit genotypes during the reproductive cycle (online Supplementary Table S5).
The mean performance of year 2013, computed on the averages of genotypes and locations, for SPL, SPS, BY, GY and TGW was inferior to 2012 performance (online Supplementary Table S2). On average, genotypes took longer to mature in 2013 than in 2012. The yields during 2013 cropping season were lower than the former year (online Supplementary Table S2) perhaps due to the fact that the extended growth time might exposed the genotypes to climate related stresses such as heat stress. Considering all traits, the genotypes showed a wider temporal variation at Geregera than at Hagreselam. About 17% of the genotypes in the top 5% such as genotype 68 (226834A), 220 (8208), 238 (208279) and 280 (214357) have shown stable performance at both locations and during the stated years (online Supplementary Tables S2 and S5).
The wider adaptation of these FVs coupled with their high yielding potential could make them a perfect candidate for either direct selection for production or using them as gene donor for breeding programs. Differently, none of the IMVs was stable in the two locations and years. Furthermore none of IMVs were observed in the top 5% at Hagreselam.
Wider divergence established between FVs and IMVs
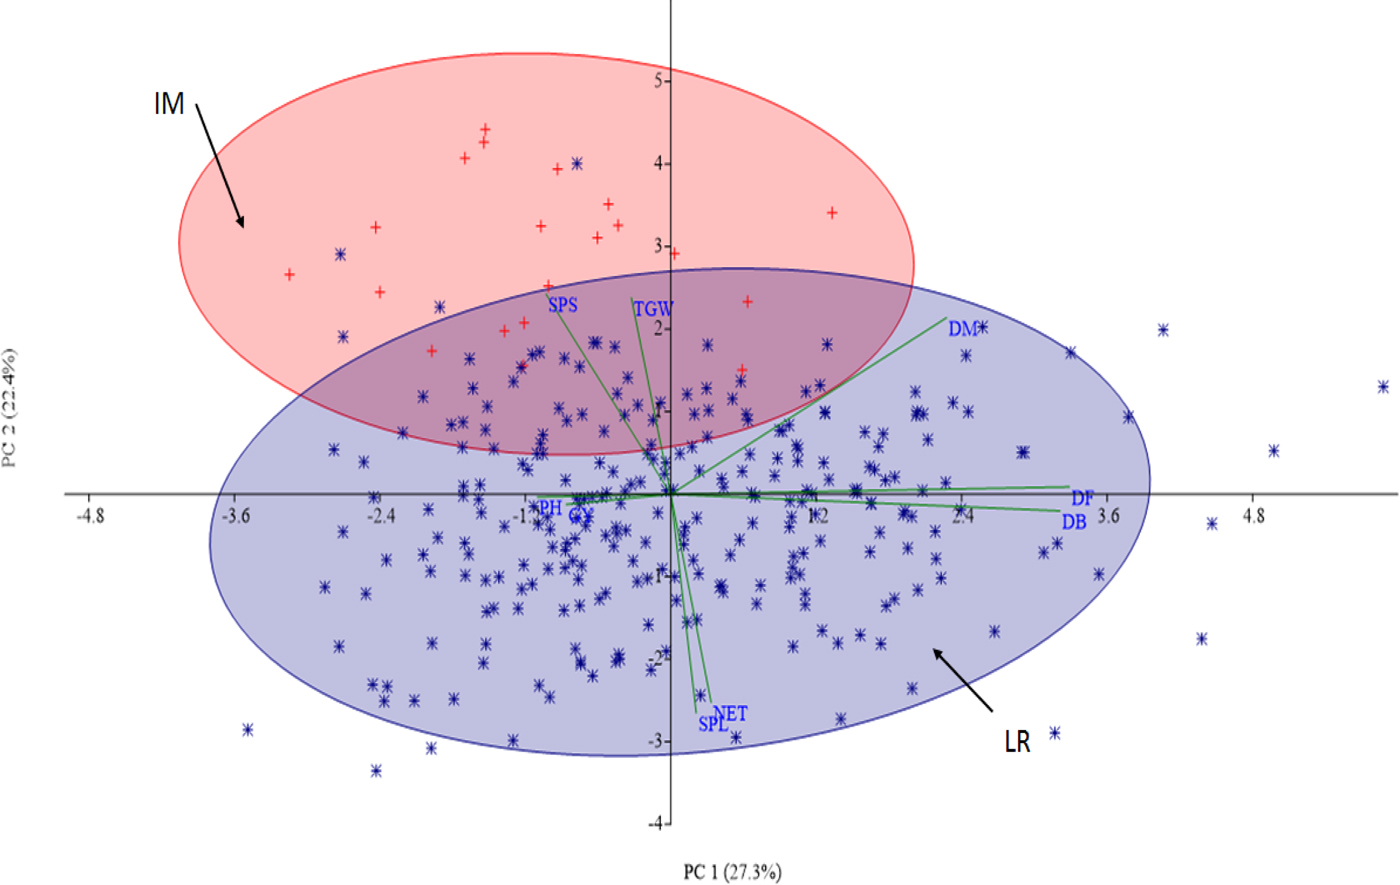
The first two PCs of the PCA clearly separated most of the IMVs from the FVs (Fig. 1). The fact that PC1 and PC2 explained 48.7% of the total variance suggests that the tested wheat panel is composed of diversified groups. The presence of some FVs outside the blue eclipse might indicate the presence of outliers for some of the traits as the PCA was done by averaging values of all traits. This analysis, however, highlights that only a little effort have been made to exploit the diverse FVs in national breeding programs to develop improved durum wheat varieties.

Fig. 1. Ordination of improved durum wheat varieties (red) versus farmers varieties (blue) based on BLUP values, averaged over environments (locations and years).
Cluster analysis allowed to classify all genotypes into eleven major groups (Table 3; online Supplementary Fig. S2). In several cases FVs and IMVs grouped together whereas some clusters only contained FVs. The number of genotypes constituted in each cluster is shown in Table 3 and ranged from 8 to 40. The FVs are distributed in all the 11 clusters, while the 27 IMVs are present in only four clusters. Each cluster could be further subdivided into sub-clusters, as hinted by the larger values of within cluster sum of squares (online Supplementary Table S3). The inter-cluster diversity for the various traits is apparent in online Supplementary Table S3.
Table 3. Clusters, number of individuals in each cluster and their major features

a Numbers under list of individuals represent the number of accessions in online Supplementary Table S1. The number of genotypes is not in an even order simply to refer to an original code in the seed store.
b The feature was depicted from field characterization and online Supplementary Table S2.
The major features of each cluster are presented in Table 3. The discrimination power of each trait is quite different as illustrated in online Supplementary Fig. S3. Apart from grain and biomass yields, all traits contribute in separating the genotypes into the various clusters. The separation of the phenological traits from the others in a biplot ordination (Fig. 2) could imply that these traits discriminate the genotypes in different ways. The correlation between phenological and agronomic traits was ascertained by pairwise Pearson correlation analysis (online Supplementary Table S4). Phenological traits are positively correlated (acute angle) among each other but negatively (obtuse angle) correlated with the seven agronomic traits. Genotypes located opposite to the traits position in Fig. 2 could have opposite trait profile to those located around the traits. For instance, genotypes in the third quadrant (Q3) and forth quadrant (Q4) perform badly for the traits aligned in Q1 and Q2, respectively. For instance, genotypes in Q3 are poor performers for all the 10 traits while those in Q4 are grouped because of their higher number SPS.
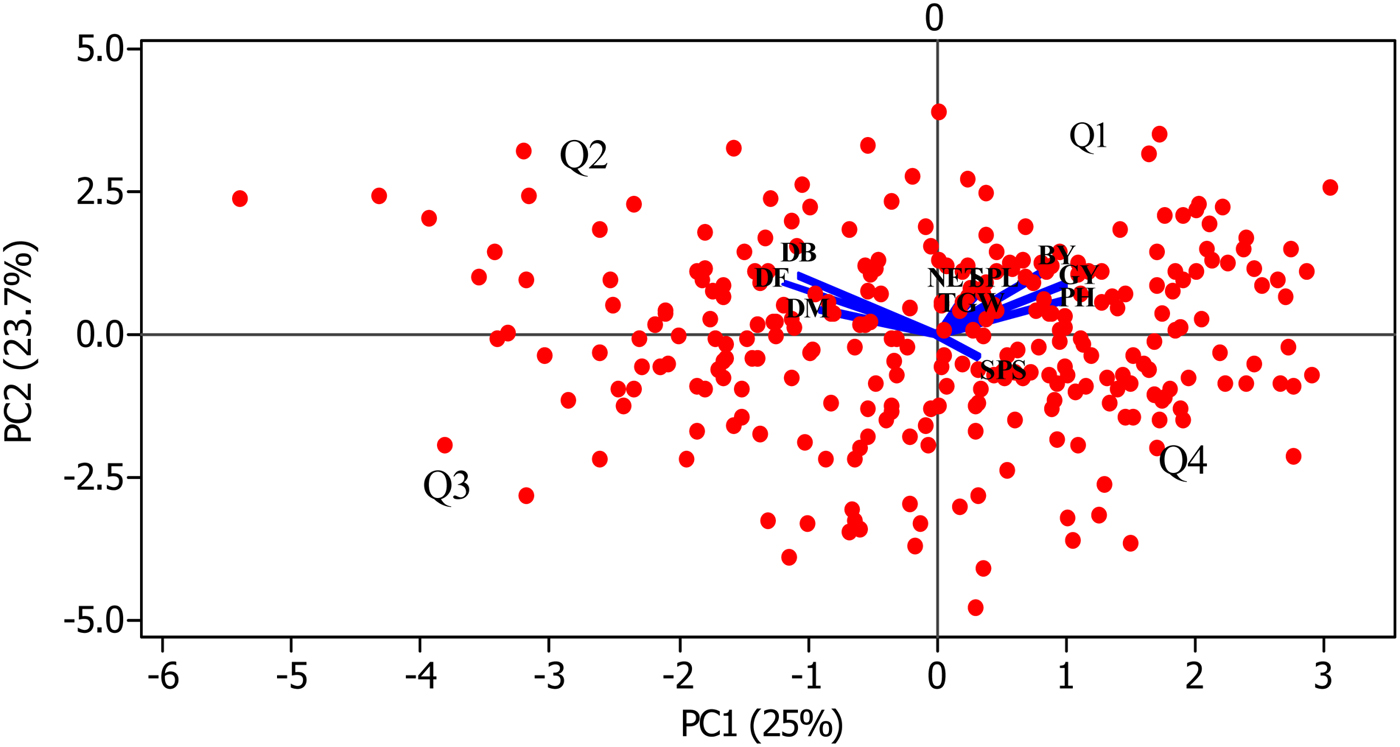
Fig. 2. Biplot of PC1 and PC2 showing the overlay of the genotypes and the ten studied traits. Red dots represent the genotypes (n = 289) and the blue lines represent the traits ordination. Q stands for quadrant.
Correlation and heritability
The estimated heritability of the genotypic traits together with the GA values are presented in Table 4. Heritability ranges from 0.09 for SPL to 0.99 for DM, indicating a wide range of variation with lower h 2 for yield related traits. As expected, low h 2 corresponds a low GA. When considering genotypic effect only, the estimated GA increases.
Table 4. Estimates of heritability (h 2) and genetic advance for the durum wheat phenological and morpho-agronomic traits among durum wheat genotypes. h 2 G×E) and GA(G×E) were estimated from the three-way variance of genotypes and the environments (location and years) while h 2 (G) and GA(G) were estimated from genotypic effect only

DF, degree of freedom; DB, days to 50% booting; DF, days to 50% flowering; DM, days to physiological maturity; NET, number of effective tillers; PH, plant height; SPL, spike length; SPS, number of seeds per spike; BY, biomass yield; GY, grain yield and TGW, 1000 grains weight.
Discussions
Genetic variability in FVs and its utilization
The projected need to increase global food production by 70% by 2050, due to alarming population growth, climate change, rising income in emerging countries and increasing urbanization (FAO, 2009), will not be realized unless new crop varieties that adapt the future climate change are developed. According to FAO's report (FAO, 2009), the availability of diversified genetic resources, in crops, is a fundamental requirement to achieve future productivity through plant breeding. Field phenotyping assisted with molecular markers, in the context of plant breeding, guides the selection of variants for traits of interest under the targeted condition. Nonetheless, very severe selection intensity occurring among few modern varieties in many wheat breeding programs are likely to alter the original genetic structure and genetic diversity patterns (McClean et al., Reference McClean, Myers and Hammond1993; Ren et al., Reference Ren, Sun, Chen, You, Wang, Peng, Nevo, Sun, Luo and Peng2013). The modern approach of genetic improvement in durum wheat involves the replacement of FVs by pure line varieties and the introduction of dwarfing genes (Thuillet et al., Reference Thuillet, Bataillon, Poirier, Santoni and David2005). This in fact resulted in development of varieties that are not suitable for complex agro-ecological conditions such as that of northern Ethiopia.
The limited use of the most diversified FVs in breeding programs could partly be associated with the lack of knowledge of the richness of the genetic variability and the corresponding economically important traits. Different experts agreed that thoroughly understanding of the level of genetic variability in existing genetic resources for major traits would help to revisit the breeding programs. In Ethiopian context, as elsewhere in tropical countries, given the very diverse agro-ecologies and cultural farming systems, decentralized and participatory genotypes evaluation and selection for target traits could be foreseen as the most successful breeding approach (Ceccarelli, Reference Ceccarelli2012). The goal being to maximize the yield at each potential location by identifying superior varieties, is suitable for the different environmental conditions. In this line, the study, in mind, has examined the amount of phenotypic diversity among 265 Ethiopian durum wheat FVs, together with 24 IMVs, under northern Ethiopia growing conditions. The result of the current study revealed that the tested genotypes, in the designated locations and stipulated years, are quite divergent (Table 1). The two way interactions between genotypes and locations and genotypes and years are all not significant indicating the possibility of selection for wider adaptation from the tested genotypes (Toledo et al., Reference Toledo, Carvalho, Arias, Almeida, Brogin, Oliveira, Moreira, Ribeiro and Hiromoto2006). Location × year interaction effects were significant at various level of significance of all traits except DM (Table 1). This shows that the genotypes responded more to the combined effect of location and year rather than their specific main effect. Planning and executing breeding towards selection for broader adaptation could benefit the two test locations instead of planning for two separate laborious and expensive breeding programs.
All the analyses showed that FVs are quite diverse for all traits measures and, contrary to the expectation, some FVs have shown superior performance for earliness and yield potential than the IMVs at both locations (online Supplementary Fig. S3; online Supplementary Table S2). Phenology is a key feature for adaptation of genotypes to climatic condition in which they grow (Annicchiarico and Pecetti, Reference Annicchiarico and Pecetti2003). The prevailing climatic conditions characterized by erratic rainfall and high temperature during the reproductive stage of crops in northern Ethiopia makes early maturing varieties preferable to avoid the recurrent terminal drought. The observed diversity in the FVs for days of flowering and maturity (online Supplementary Tables S2, S2 and Fig. S3) calls for exploitation of these genotypes in national and international breeding programs to develop early maturing varieties that would be viable under adverse climatic change.
In Ethiopia, cereal-livestock farming systems are the main practice. The crop production sector is required to satisfy both human and livestock demand particularly in arid and semiarid parts of the country where crop residues are the main source of animals feed. The wheat straw represents an important commodity as it is used for feeding animals during the dry season and as a supplement during the summer. Nearly 100% of wheat above ground biomass is harvested with great care to avoid any lose to satisfy the demand. For this reason, biomass yield is as important as grain yield for farmers. Our result revealed that the tested durum wheat FVs contain very large genetic diversity (4.1 t ha−1) for this important trait. About 20% yield advantage of BY was obtained from the best FVs over the best IMV (online Supplementary Table S2). Annicchiarico and Pecetti (Reference Annicchiarico and Pecetti2003) also reported a significant higher biomass yield from FVs than from IMVs. Such genetic diversity contained in the FVs for biomass yield should be given due attention to national durum wheat breeding programs as short-statured varieties are rarely accepted by cereal-livestock mixed farming systems because of their low straw yield (Ben Amar, Reference Ben Amar1997).
The genotypes have manifested larger genetic variation in grain yield as well (online Supplementary Table S3 and S2) with the metric values ranging from 1.7 to 3.2 t ha−1 and 1.8 to 2.8 t ha−1 for FVs and IMVs, respectively. The wider yield range associated with the FVs than the IMVs indicated that the FVs contain great genetic potential for future development of better durum wheat varieties through various breeding techniques. The low diversity in IMVs for most of the traits may encourage breeders to include the identified superior FVs in their durum wheat breeding programs. This may broaden the genetic base and maximize genetic gain as favourable alleles may be accumulated (Tar′an et al., Reference Tar′an, Zhang, Warkentin, Tullu and Vandenberg2005) from the selection in mind. To date, there has been limited use of the FVs as source of genetic variation in durum wheat improvement programs; despite the presence of a diversified germplasm base of this crop. The use of FVs and wild relatives in crops improvement was proved as a means of generating genetic variability on which the selection is based (Sorrells and Wilsons, Reference Sorrells and Wilsons1997; Haussman and Parzies, Reference Haussman, Parzies, Ceccarelli, Guimarães and Weltzein2009). Additionally, direct use by farmers of such superior varieties could provide a quick strategy to adapt to changing climatic conditions, as they can be made immediately available to farmers without waiting for breeding process to take place.
Phenotyping repeated SNP-based reported population structure
The morphological-marker-based clustering and PCA have demonstrated that IMVs are separated from FVs although some overlapping was observed (Table 3; Fig. 1). The presence of intermix between the FVs and IMVs is expected as some of the latter could be the descendants of the former. SNP-based PCA structuration, performed on the same genotypes, has produced similar pattern of relationship between the two groups (Mengistu et al., Reference Mengistu, Kidane, Catellani, Frascaroli, Fadda, Pè and Dell'Acqua2016). The concurrence of PCA structure from the phenotypic and genotypic data might explain the absence of significant G × L × Y interaction effect on the measured traits (Table 1). Such positive congruence between molecular and morphological markers in clustering wheat genotypes was reported previously for wheat (Fufa et al., Reference Fufa, Baenziger, Beecher, Weikat, Graybosch and Eskridge2005; Vieira et al., Reference Vieira, de Carvalho, Bertan, Kopp, Zimmer, Benin, da Silva, Hartwig, Malone and de Oliveira2007; Bertan et al., Reference Bertan, Irajá, Carvalho, Oliveira, Benin, Vieira and Valério2009; Al-Doss et al., Reference Al-Doss, Elshafei, Moustafa, Saleh and Barakat2011) and sorghum (Agrama and Tuinstra, Reference Agrama and Tuinstra2003). The out grouping of IMVs, with some exceptions, is expected since most of these varieties were introduced to local farming systems from international breeding nurseries since 1967 (CIMMYT, 2014). Our recent work using high density molecular marker showed that IMVs under cultivation in Ethiopia resemble more Mediterranean durum wheat group than that of Ethiopian durum wheat FVs (Mengistu et al., Reference Mengistu, Kidane, Catellani, Frascaroli, Fadda, Pè and Dell'Acqua2016). The overlap of some FVs with the IMVs in the two ellipses (red and blue) (Fig. 1) could be the result of gene flow between the two groups from local breeding efforts or could be an admixture due to adulteration created at the genebank level.
Heritability as indirect indicator of strong genetic influence
Traits under strong genotypic influence could bear high heritability estimate followed by high value of genetic advance (Abinasa et al., Reference Abinasa, Ayana and Bultosa2011). As expected, the phenological and morphological traits were to have the highest values of heritability, as these traits are known to be highly influenced by genetic factors rather than environmental factors (Table 4). Traits heritability reported here for phenological and agronomic traits was comparable with that reported on Ethiopian durum wheat by other scholars (Abinasa et al., Reference Abinasa, Ayana and Bultosa2011; Tsegaye et al., Reference Tsegaye, Dessalegn, Dessalegn and Share2012). Traits characterized by high heritability followed by high genetic advance (Yousaf et al., Reference Yousaf, Atta, Akhter, Monneveux and Lateef2008; Abinasa et al., Reference Abinasa, Ayana and Bultosa2011) and that influenced by additive gene action (Bradshaw et al., Reference Bradshaw, Hackett, Pande, Waugh and Bryan2008) could be easily improved in breeding programs. The dominance of genotypic effect (Table 1) and higher heritability detected for studied traits in the tested genotypes could enhance the chance obtaining superior varieties through breeding if identified FVs used as recurrent donors in the breeding program (Bellucci et al., Reference Bellucci, Torp, Bruun, Magid, Andersen and Rasmussen2015).
Conclusion and perspective
The various employed statistical analyses confirm that the tested genotypes possess huge genetic diversity for the measured traits. A number of durum wheat FVs have shown superior performance over the IMVs for different traits, which clearly showed that the potential for further improvement for yield per se, early maturity and other notable traits. Although most of the genotypes were responding differently to different environments, some FVs have shown stable performance in the 2 years and the two locations; and the outcomes can be considered as the best candidates for wider adaptation breeding. Superior varieties at each location were made available to farmers for direct use while others are in the process of being formally released. There was clear structural differentiation between the IMVs and the FVs, though some admixtures have also been observed, as confirmed by PCAs. However, none of the IMVs hold separate cluster as verified in cluster analysis due to the fact that many genotypes are forced into a single cluster based on standardized values of major traits.
Two very visible correlation patterns were observed among the traits where phenological traits assumed positive and significant correlation among themselves; but negatively associated with the other agronomic traits. A positive and significant correlation between grain yield and its components was revealed, which is a plus for breeders. Our result ascertains the fact that FVs are potential gene pool for traits of interest to develop varieties both through conventional breeding approaches or marker assisted selection for different purposes. Hence, the exploitation of Ethiopian FVs, especially those that have been characterized here, in national as well as international breeding programs to develop varieties for grain and straw yield and earliness that suit areas suffering from different forms of calamities especially terminal drought is recommended. Besides, strengthened conservation of these resources is vital to reduce genetic erosion due to dependence on few IMVs and ensure their accessibility to next generation.
Supplementary Material
The supplementary material for this article can be found at https://doi.org/10.1017/S1479262116000393
Acknowledgements
This work is funded by the Doctoral School in Agrobiodiversity at Scuola Superiore Sant'Anna, Pisa for which we are very grateful. The authors would also like to thank Ethiopian Biodiversity Institute (EBI) for providing us the durum wheat FVs used in the study. Beside these, Mekelle University and Sirinka agricultural research center (SARC) of ARARI are specially thanked for providing the experimental fields. Special thanks goes also to Ato Gebremariam Gebregziabher, the farmer who cooperated in selecting and sharing with us farmer variety GG2. We would also like to include our appreciation to Mr Alex Berhanu (MU/UK) for going through the editorial work.