


Survey researchers face a fundamental cost-bias tradeoff in respondent recruitment. Fielding opinion polls on high-quality probability samples entail substantial costs that limit the scale and breadth of research activity. Recognizing the limits of using university-based convenience samples, many researchers have examined whether web-based crowd-sourcing tools like Amazon’s Mechanical Turk and Google Consumer Surveys can be cost-effective methods to survey diverse target populations (Berinsky, Huber and Lenz Reference Berinsky, Huber and Lenz2012; Huff and Tingley Reference Huff and Tingley2015; Santoso, Stein and Stevenson Reference Santoso, Stein and Stevenson2016). The empirical properties of these Internet-based samples remain a subject of active study.
In this article, we evaluate Facebook’s potential as a platform for survey recruitment. We propose a quota sampling method using Facebook advertisements to generate public opinion estimates that approximate national averages efficiently. Using a proof-of-concept study on US climate opinions, we demonstrate that researchers can cost-effectively recruit respondents through quota sampling using Facebook advertisements, at a fraction of the cost of hiring an online survey firm (we sampled over 2000 respondents at about $4 per response). Using Facebook for quota sampling also offers a comparative advantage because it gives researchers control over how they recruit subjects and allows researchers to target specific subpopulations.
Our method contributes to an emerging literature that uses Facebook to recruit respondents into research studies. For example, psychologists enrolled over 4 million Facebook users as subjects by creating a Facebook application that allowed users to take psychometric tests (Kosinski et al. Reference Kosinski, Matz, Gosling, Popov and Stillwell2015). The researchers subsequently linked these tests to users’ Facebook profiles to predict personal attributes and personality traits from users’ social media behavior (Kosinski, Stillwell and Graepel Reference Kosinski, Stillwell and Graepel2013; Youyou, Kosinski and Stillwell Reference Youyou, Kosinski and Stillwell2015). Medical researchers have similarly used Facebook to recruit subjects from specific subpopulations, such as young adults who smoke cigarettes (Ramo and Prochaska Reference Ramo and Prochaska2012; Ramo et al. Reference Ramo, Rodriguez, Chavez, Sommer and Prochaska2014) or middle-aged American women (Kapp, Peters and Oliver Reference Kapp, Peters and Oliver2013).
Political science researchers have used Facebook to recruit respondents in Brazil for survey experiments (Samuels and Zucco Reference Samuels and Zucco2013, Reference Samuels and Zucco2014), survey likely voters in state primaries (Hirano et al. Reference Hirano, Lenz, Pinkovskiy and Snyder2015), deliver political advertisement treatments to diverse respondent pools (Broockman and Green Reference Broockman and Green2014; Ryan Reference Ryan2012), and survey political activists in Germany and Thailand (Jäger Reference Jäger2017). In Samuels and Zucco (Reference Samuels and Zucco2013, Reference Samuels and Zucco2014), researchers raffled off an iPad to one randomly selected survey-taker. For a cost of $1.86 per valid survey completion, the researchers obtained 3286 responses. Although the Facebook sample was less representative than a national sample from a survey firm, the results of the Facebook-sampled survey experiment were similar, especially after weighting the responses through post-stratification. Likewise, Jäger (Reference Jäger2017) used Facebook samples of local party activists in Germany to accurately predict the outcome of a party leadership race and approximate results from a representative local leader survey.
We contribute to this literature by developing a platform-specific quota sampling technique. Our method uses the Facebook Marketing API to semi-automate a quota sampling process. This method enabled us to recruit 2432 respondents at the cost of $4.05 per completed response. This approach allows quota sampling on conditional strata themselves rather than simply ensuring the sample marginals approximate the population marginals. Results from the Facebook-sampled survey approximate results from a survey conducted by a reputable survey research firm, GfK,Footnote 1 as well as results from the American Community Survey (ACS). To accompany this research note, we are releasing an R package, fbsample, that automates the quota sampling process using the Facebook Marketing API.Footnote 2
Methodology
To obtain the most representative sample given a constrained advertisement budget, we employ quota sampling to target a series of strata, or demographic subgroups. Convenience sampling methods that do not set demographic quotas might potentially produce very non-representative samples. Facebook states that “if you optimize for link clicks, your ads are targeted to people in your audience who are most likely to click the ads’ links.”Footnote 3 When a user first launches an advertisement optimized for link clicks, Facebook will send the advertisement to different types of people to learn who is most likely to click on the link. After this “learning phase” (after about 50 link clicks), Facebook targets the advertisements to those predicted to click on the link.Footnote 4 For public opinion researchers, Facebook’s advertisement delivery optimization might prove problematic because it could lead to the recruited subjects being homogeneous. For instance, if many young white males clicked on the advertised link during the “learning phase,” Facebook may target mostly young white males. To avoid this “homogenization” of their sample, public opinion researchers must target a diversity of demographic strata.
The Facebook Marketing API makes it relatively easy to target specific demographic subgroups. Before 2015, advertisers had to set up advertisements that targeted specific groups manually. However, after Facebook made its Marketing API publicly available in 2015, advertisers gained the ability to write programs to target many pre-specified groups at once. Our current method uses this capability to quota sample many demographically diverse strata simultaneously.
However, efforts to estimate national public opinion from Facebook quota samples depend on a series of assumptions, some of which may not hold in reality. Define R i as an indicator variable for whether member i of the population took the survey (Ri = 1 means i took the survey and Ri = 0 otherwise); Di as respondent i’s characteristics that researchers used to construct strata for quota sampling; Xi as respondent i’s characteristics not used to construct strata but are measured in the survey; and Yi as person i’s response to a survey question.
Assumption 1 :  $Y_{i} \,\hbox{\vskip2.5pt╨} \,R_{i} \,\mid\,{\bf D}_{i} {\equals}{\bf d}_{i}, {\bf X}_{i} {\equals}{\bf x}_{i} $,
  $\forall \;{\bf d}_{i} \in{\rm Supp}({\bf D}_{i} )$ and
  $\forall \;{\bf x}_{i} \in{\rm Supp}({\bf X}_{i} )$
Assumption 2 :  ${\it P}r(R_{i} {\equals}1\,\mid\,{\bf D}_{i} {\equals}{\bf d}_{i}, {\bf X}_{i} {\equals}{\bf x}_{i} )\,\gt\,0$,
  $\forall \;{\bf d}_{i} \in{\rm Supp}({\bf D}_{i} )$ and
  $\forall \;{\bf x}_{i} \in{\rm Supp}({\bf X}_{i} )$
Assumption 1 implies that conditional on strata and observed respondent characteristics, responses of those who took the survey would be the same as those who did not take the survey. While this assumption might not hold in reality, the degree to which violations of Assumption 1 will bias efforts to use Facebook advertisements to estimate national public opinion is an empirical question that this research note is designed to address.
Assumption 2 asserts that conditional on strata and observable characteristics, each person in the population has a non-zero probability of taking the survey. Of course, not everyone in a given population has a Facebook account or uses Facebook regularly. According to a 2018 Pew Research Center study, 68 percent of American adults reported using Facebook (Smith and Anderson, Reference Smith and Anderson2018). Even so, Facebook allows one to reach a far greater proportion of the US adult population than other ways researchers recruit convenience samples. For instance, researchers recruiting respondents using Mechanical Turk could reach only about 7300 workers in any quarter year (Stewart et al. Reference Stewart, Ungemach, Harris, Bartels, Newell, Paolacci and Chandler2015).
Study design
To demonstrate the validity of the quota sampling method described above, we conducted a study to compare the results of a quota-sampled Facebook survey with a high-quality probability-sampled GfK online panel survey. The two surveys, which shared 25 identical questions, were conducted a few months apart in 2016. Apart from the questions asking about respondent demographics, both surveys focused on climate change attitudes and policy preferences. Also, to validate the Facebook sample against the ACS, we asked three questions from the ACS about veteran status, home ownership, and country of birth. (These results are reported in the Online Supplementary Information).
The Facebook Marketing API allows researchers to write code that target several thousand highly specific demographic groups at once. For our quota sampling, we generated 544 strata according to demographic characteristics (e.g., gender, age group, race, level of education, and nine US Census regions). We chose these demographic characteristics because crosstabs containing frequencies conditional on these demographics are readily available through the US Census.Footnote 5
Next, we assigned an advertising budget to each stratum according to proportional allocation for most strata; we allocated greater budget to strata that contain very small sub-populations nationally for two reasons. First, Facebook requires advertisers to set a daily budget of $5.00 per advertisement, although it is not required to spend the entire daily budget. Second, since it is more difficult to recruit from small sub-populations, we had to allocate a larger budget to generate the minimum number of respondents.
Our advertisements informed respondents that by taking the survey they could see how their views on climate change compared to other Americans; no rewards were promised. To maximize viewership, we promoted the advertisements on all Facebook platforms (e.g., news feed, right column advertisement space, etc.), except on Instagram.Footnote 6 Over a period of two weeks in July 2016, we recruited 2432 respondents who completed the survey from the 7642 Facebook users who clicked on our advertisement. At the end of the recruitment period, we filled or overfilled 218 strata, partially filled 61 strata, and failed to recruit anyone for 157 strata. On average, the Facebook survey cost $4.05 per complete.Footnote 7
Our probability-sampled online panel study was conducted in March 2016. This survey sampled 2459 respondents with 1346 completions for a completion rate of 54.7 percent.Footnote 8 This study used GfK’s Knowledge Panel, with a household recruitment rate for our survey of 12.3 percent (American Association for Public Opinion Research Response Rate 3). Overall, our online panel responses cost nearly six times as much as our Facebook user responses.
Results
Results from the Facebook survey are similar to results from the online panel survey and the ACS even without weighting. For questions where the Facebook and online panel survey results differed, the Facebook respondents produced answers indicating greater concern about climate change.
Table 1 displays the summary statistics for the demographic groups in the GfK, Facebook, and ACS surveys. Contrasted with the GfK and ACS samples, the Facebook sample is younger and less white. To make both surveys more nationally representative, we used inverse probability weighting to weight each sample to the March 2016 Current Population Survey (CPS).Footnote 9
Table 1 Summary Statistics of Survey Respondents
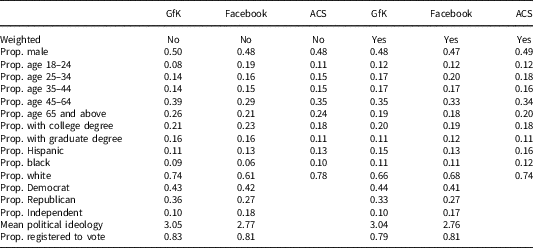
The GfK survey included 1317 respondents; the Facebook survey included 2432 respondents; the 2016 American Community Survey (ACS) Public Use Microdata Sample include 2,503,750 respondents. In the GfK and Facebook surveys, respondents who indicated they “lean Democrat” were counted as Democrats; likewise, those who indicated they “lean Republicans” were counted as Republicans. Political ideology was measured using a 5-point scale such that 1 is very liberal and 5 is very conservative.
We combined each sample and the CPS, then we used logistic regression to estimate the probability of being included in the sample. Covariates used in our propensity score model include gender, age group, level of education, race, geographic region, whether the respondents lived in a metropolitan area, and the interaction between region and the metropolitan indicator variable. The final weights are the inverse of the estimated probabilities normalized such that the sum of each sample’s weights equals the sample’s size.Footnote 10
As Table 1 demonstrates, the weighted demographic summary statistics of the two surveys are very similar to each other and to the ACS estimates. Comparing the political variables, the Facebook sample contains a greater proportion of Independents and a smaller proportion of Republicans than the GfK sample.
The results for the eight questions about climate change are presented in Figure 1. For the unweighted results, the mean difference is 5.1 percentage points with a standard deviation of 4.2 percentage points. Regarding these unweighted results, the Facebook-sampled respondents expressed slightly less skepticism about climate change, greater concern about climate change, and greater support for policies that mitigate climate change. After weighting both the Facebook survey and the online panel survey to the CPS, the mean difference in responses is 4.3 percentage points with a standard deviation of 3.4 percentage points.

Figure 1 Comparing Facebook survey with GfK survey: climate change public opinion. The plots above report the point estimate and the 95 percent confidence interval for each outcome measure. The confidence intervals are calculated from heteroscedasticity-consistent standard errors.
One reason that the Facebook-sampled respondents may be more concerned about climate change is that our advertisement explicitly contained language about climate change and included a photo of the Earth. Respondents who are pro-climate action might have been more motivated to click on the advertisement than those who are unconcerned about climate change. A breakdown of the survey results by partisanship reveals that Democrats, Republicans, and Independents within the Facebook survey provided similar responses to Democrats, Republicans, and Independents in the GfK survey, respectively. However, respondents in the Facebook survey who said they are uninterested in politics were significantly more pro-climate action than their counterparts in the GfK survey. This difference between the two samples suggests that within each stratum, Facebook users may have not as-if randomly sorted into the recruitment sample. One possible strategy to avoid self-sorting that affects survey results is to create advertisements that do not discuss the content of the survey being advertised, although this strategy will require careful attention to advertisement wording and design.Footnote 11
As a further robustness check, we also compared three results from the Facebook survey with the 2016 ACS One-Year Estimates. The Facebook sample is also able to somewhat approximate the ACS benchmarks, as detailed in our Online Supplementary Information.
Conclusion
This study produced valuable lessons for best practices in quota sampling using Facebook advertisements; this method can generate results that approximate high-quality probability-based national opinion surveys. Further improvements to our proposed method would result from systematic attention to the factors that drive Facebook users to click on advertisements. We highlight some considerations for future researchers. First, researchers might inadvertently recruit particular types of respondents by advertising the content of the survey. This form of self-selection bias may not be eliminated by strata targeting or by conditioning on observable demographic characteristics. To avoid this problem, researchers can advertise their survey using vague language without revealing its core content. Additional design effort may be required, however, to persuade users to click on such advertisements.
Future researchers could also further reduce bias in their estimates by measuring other characteristics of the respondents and using those characteristics to weight their Facebook-sampled survey. In particular, we suggest that researchers obtain respondent characteristics that are not available through Facebook or are inaccurately predicted by Facebook to improve re-weighting efforts.
More broadly, our findings suggest that using Facebook to recruit respondents is a viable option for survey researchers seeking to approximate public opinion estimates for some populations at significantly lower cost. While our method costs a fraction of recruiting respondents through survey panels that use probability sampling, it is not dramatically cheaper than using other “opt-in” online survey panels. Nevertheless, our method provides greater flexibility to researchers in deciding who to recruit. Furthermore, quota sampling using Facebook advertisements may also be particularly useful for generating targeted samples of geographic or demographic subpopulations, for which national panels may prove to be inadequate or prohibitively expensive. For instance, Sances (Reference Sances2017) has used Facebook advertisements without quota sampling to recruit voters from US municipalities. For future research, we plan to investigate ways to further reduce the cost of this quota sampling method.
Supplementary Material
To view supplementary material for this article, please visit https://doi.org/10.1017/psrm.2018.49
Acknowledgments
We would like to thank Erin Hartman, Devin Caughey, Peter Aronow, Solomon Messing, and M. Kent Jennings for their feedback on earlier drafts of this research. We also appreciate feedback from participants of the following workshops: the New Faces in Political Methodology IX Workshop (Pennsylvania State University), the Oxford Internet Institute Summer Doctoral Programme, and the Southern California Methods Workshop. We also thank the Skoll Global Threats Fund and the MacArthur Foundation for their support of the project. BZ’s work on this project was supported by the National Science Foundation Graduate Research Fellowship.


