


The Reasoning Test Battery (“Bateria de Provas de Raciocionio”, BPR) was developed out of the “Tests de Raisonnement Différentiel” built by Meuris (Reference Meuris1969) in Belgium. The purpose of the battery is to assess reasoning competence among children and adolescents based on tasks containing different contents. The BPR assesses general aspects of intelligence together with components associated with skills usually assessed in specific multifactorial intelligence batteries. The substantive basis of the Reasoning Test Battery is the theory of the hierarchical organization of cognitive abilities (Cattell, Reference Cattell1963, Reference Cattell1971; Vernon, Reference Vernon1961) and therefore combines a general cognitive factor and specific factors (Horn & Noll, Reference Horn, Noll, Flanagan, Genshaft and Harrison1997). Drawing on the three-factor model or CHC theory (Cattell-Horn-Carroll), general reasoning is associated with the g factor (fluid intelligence), and particular contents with specific factors related to cognitive functions or types of information to be processed (oral, figurative, numerical) (Carroll, Reference Carroll and Nyborg2003).
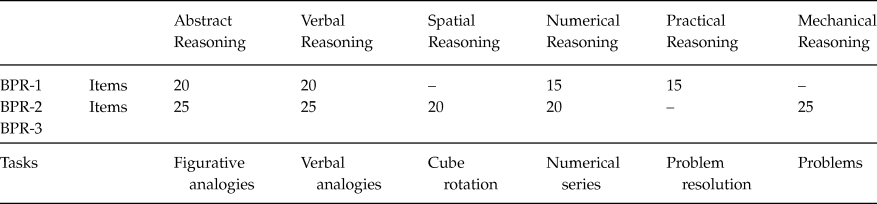
In terms of reasoning, the battery contains analogies, series completion and troubleshooting tasks. The item content consists of meaningless geometric figures (figurative-abstract), word meanings (verbal), number sequences (numerical), movement of cubes (spatial) and practical situations (concrete-mechanical). The current version is a battery of tests with three different forms which were designed to assess a wide range of ages: BPR Form 1 consists of four scales for 4th, 5th and 6th grade students (9–12 years old); BPR Form 2 comprises 5 scales and covers the first three years of secondary education, (12–15 years old); and BPR Form 3, with 5 scales, is designed for students in the fourth year of secondary education and the two pre-university years, called Bachiller (15–20 years old).
Versions of the BPR have been adapted to Portugal (Almeida & Lemos, Reference Almeida and Lemos2006) and Brazil (Primi & Almeida, Reference Primi and Almeida2000). The reliability coefficients reported for the scales are greater than .70, and in most cases the values are above .80. Studies on the dimensionality of the BPR have concluded the presence of a general factor which explains between 40% and 60% of the scale variance.
With the aim of extending the use of a reasoning test constructed in Europe, the purpose of this research was to adapt the three BPR test forms to Spanish and to analyze their internal structure through different approaches: exploratory item factor analysis, confirmatory factor analysis and factorial invariance across gender.
Including a gender related factorial invariance study of the BPR is crucial, since together with the hierarchical organization of cognitive abilities, analyzing the possible differences in reasoning as a function of gender is a recurring theme in psychology research (Deary, Penke, & Johnson, Reference Deary, Penke and Johnson2010; Johnson, Carothers, & Deary, Reference Johnson, Carothers and Deary2008; Lohman & Lakin, Reference Lohman and Lakin2009). Although no significant differences have been concluded in terms of g factor (Deary, Irwing, Der, & Bates, Reference Deary, Irwing, Der and Bates2007; Jensen, Reference Jensen1998), differences in specific cognitive abilities such as verbal, visuospatial and quantitative have been found (for a review, see Halpern et al., Reference Halpern, Benbow, Geary, Gur, Hyde and Gernsbacher2007). Gender difference studies are usually based on the comparison of observed or latent scores. But from a methodological point of view, prior to analyzing any score differences, it is important to assess the factorial invariance of the compared model, because lack of factorial invariance can increase Type I errors in observed score comparison (Finch & French, Reference Finch and French2012). In this regard, Lemos, Abad, Almeida, & Colom (Reference Lemos, Abad, Almeida and Colom2013) carried out an invariance study on the BPR Form 2 and Form 3, and concluded differences in the general structure affecting numerical reasoning and mechanical reasoning scales.
Method
Adaptation
The process of adapting the BPR to Spanish followed the recommendations of the International Test Commission (Elosua, Mujika, Almeida, & Hermosilla, Reference Elosua, Mujika, Almeida and Hermosilla2014; Muñiz, Elosua, & Hambleton, Reference Muñiz, Elosua and Hambleton2013). Applying an independent forward translation design and an iterative review process, the battery was adapted to Spanish. Two independent translators translated the Portuguese version to Spanish and a multidisciplinary team composed of two psychometricians, two professional translators and two primary and secondary education teachers reviewed the product. A final version was ultimately adopted by consensus. Some items in the verbal section were modified to maintain semantic equivalence in terms of familiarity and difficulty: five items from Form 1, three items from Form 2 and three items from Form 3.
Participants
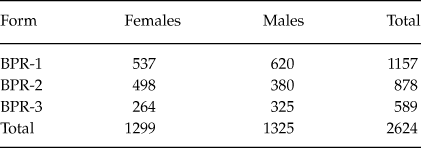
The sample comprised 2624 students, 1299 females and 1325 males. The age of the students ranged from 9 to 22 years. The mean age of the participants completing Form 1 was 10.36 years (SD = 1.03), Form 2, 13.44 years (SD = 1.08) and Form 3, 16.69 years (SD = 1.34). The distribution of the sample is shown in table 1.
Table 1. Sample Composition
Instrument
The Reasoning Test Battery consists of three different forms, each organized into different scales and items. Table 2 shows the scales, the tasks involved and the number of items in each scale.
Table 2. Structure of the Reasoning Test Battery
Procedure
The psychometric analyses focused on score reliability and internal structure.
Consistency of the partial scales of each BPR form was assessed estimating ordinal alpha (Elosua & Zumbo, Reference Elosua and Zumbo2008). The internal structure of the battery was evaluated using two different approaches; first, an exploratory item factor analysis on the item thetracoric matrix for each scale was carried out using ULS estimator to assess the presence of a dominant factor; secondly, a confirmatory factor analysis was performed on each of the three BPR forms to test the hierarchical model underlying the battery. Finally, a factorial invariance study across gender was performed on each of the BPR forms. The measurement invariance examined the equality of the factor pattern matrices (configural invariance), the equality of the loading matrices (measurement invariance), and the equality of the intercepts (scalar invariance). The analyses were performed with the ‘lavaan’ package (Rosseel, Reference Rosseel2012). Model fit was assessed using the chi-square statistic, the root mean square error of approximation (RMSEA), the standardized root mean square residual (SRMR) and the comparative fit index (CFI). Although Hu and Bentler (Reference Hu and Bentler1999) suggested that RMSEA should be less than or equal to .06 for a good model fit, recent studies conclude that in models with small degrees of freedom, RMSEA too often indicates a poor fitting model (Kenny, Kaniskan, & McCoach, Reference Kenny, Kaniskan and McCoach2014). The cut-off point for CFI is usually fixed at .90 and for SRMR, at .08 (Hu & Bentler, Reference Hu and Bentler1999). The invariance is rejected if the value of the difference between the two nested models is higher than 0.01 in favor of the least strict model (Cheung & Rensvold, Reference Cheung and Rensvold2002).
Results
Internal Consistency
Ordinal alpha values ranged from .86 to .94 (see table 3). The highest values were found in the numerical scales in the three forms (αForm1 = .93; αForm2 = .94; αForm3 = .93), and the lowest values were associated with the mechanical reasoning scales (αForm2 = .80; αForm3 = .86).
Table 3. Reasoning Tests Battery Scales. Internal Consistency, Explained Variance and Regression Weights
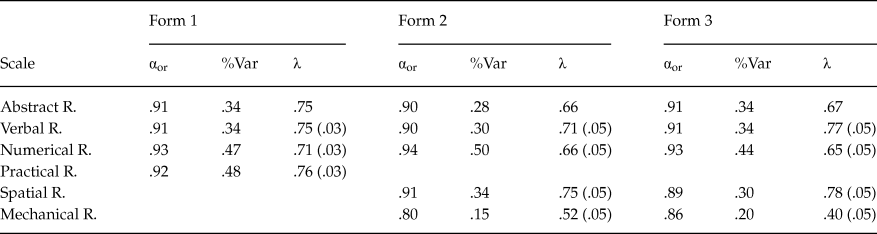
Notes: αor. Ordinal alpha. %Var Explained variance percentage. λ. Factor loading. Measurement errors in parentheses.
Unidimensionality of Partial Scales
Results of the exploratory factor analyses on the thetracoric correlation matrix performed on each of the scales are summarized in table 3. For abstract, verbal, numerical and practical reasoning scales the percentages of variance associated with the one-dimensional factor were greater than .30 in the three BPR forms; the only exception was for the abstract reasoning scale in Form 2, which yielded a variance percentage of 28%. However, the mechanical reasoning scales showed lower values; 15% of the variance was explained by the mechanical dominant factor in Form 2 and the explained variance was 20% in Form 3.
General Factor Structure
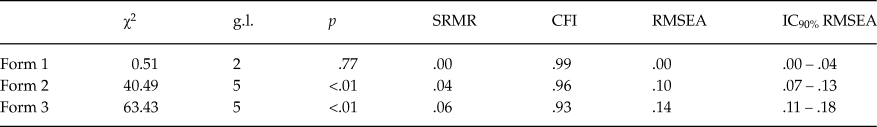
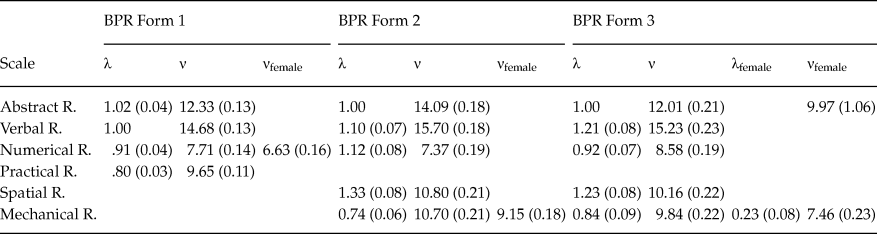
The presence of a general underlying factor was assessed by analyzing scale correlation matrices using maximum likelihood estimation. Table 3 shows the regression weights (λ) and standard errors for each partial scale. The loading values were above .65 for the abstract, verbal, practical and spatial reasoning scales. The mechanical reasoning scale weights were .52 in Form 2, and .40 in Form 3. All the loadings were statistically significant. The SRMR and CFI indexes (table 4) of the confirmatory models met the criteria for a good fit, although RMSEA indexes were little higher than the cut-off points (RMSEAForm2 = .10; RMSEAForm3 = .14). The extracted general factor explained 54% of the variance in Form 1, 43% in Form 2, and 44% in Form 3.
Table 4. Fit Indexes of the Confirmatory Unidimensional Model
Factorial Invariance
Results of the factorial invariance are shown in table 5. The CFI indexes obtained in evaluating baseline models yielded values over .97 except for the female sample in Form 3; (CFI = .91; RMSEA = .16). Configural invariance examined the same measurement structure in both samples. This basic invariance showed a reasonable fit to the data in the three forms, with CFI values above .96. Metric equivalence added a restriction to the previous models, which was the equality between the regression coefficients in all six samples. The unidimensional model and the loading matrices were held invariant across samples. Metric invariance was held for Form 1 and Form 2 (ΔCFI Form1 = –0; ΔCFI Form2 = –.01) but for the oldest students the difference between CFI values was higher than the cut-off point (CFIconfigural - CFImetric = .96–.92 = .04).The partial metric invariance was assessed by estimating the parameters for the mechanical reasoning scale independently in males and females (λfemales = .23; λmales = .84); the result was a reduction in the CFI difference and in the RMSEA value (CFIconfigural - CFImetric = .96–.95 = .01; RMSEA = .10).
Table 5. Factorial Invariance Models
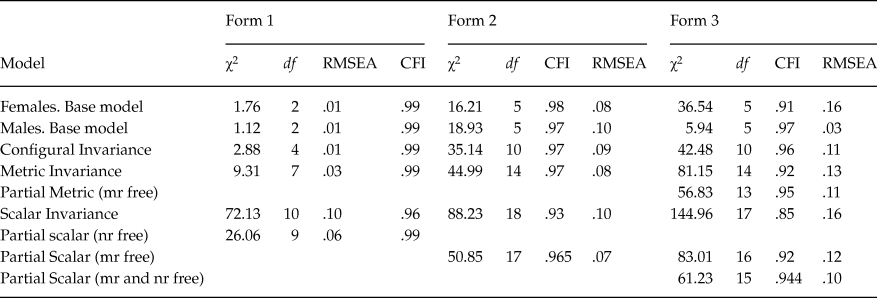
In order to evaluate scalar invariance, the intercepts (ν) were added to the model. The fit indexes obtained were slightly poorer than those for the rest of the models assessed. In the three forms analyzed the differences in the CFI values were greater than .01 (ΔCFI Form 1 = –.04; ΔCFI Form 2 = –.04, ΔCFI Form 3 = –.05), and in all three cases the RMSEA values were equal to or exceeded .10 (RMSEA Form 1 = .10; RMSEA Form 2 = .10; RMSEA Form 3 = .16). The statistical analysis of the modification indexes suggested the freeing of the intercepts associated with numerical reasoning in Form 1, and mechanical reasoning in Forms 2 and Form 3. After the new models were estimated, the fit indexes for Form 1 and Form 2 met the established criteria (χ2 Form 1 = 26.06; df = 9; ΔCFI Form 1 = –.01, RMSEA Form 1 = .06, χ2 Form 2 = 50.85; df = 17; ΔCFI Form 2 = –.005, RMSEA Form 2 = .07). However, the results of the partial invariance model adjustment were not acceptable in Form 3. Only after freeing the parameters for the abstract reasoning scale, were adequate adjustment indexes found (χ2 Form 3 = 61.23; df = 15; ΔCFI Form 3 = –.006; RMSEA Form 3 = .10).
Although the latent mean and covariance structure analysis (MACS) did not estimate the absolute means, latent mean differences across groups can be estimated by fixing the latent means values to zero for one of the groups. The female group was defined as the base group in the three forms; therefore, the means in the general factor were fixed to zero for this group and were freely estimated in the male groups. Comparisons among groups were based on the statistical significance of the difference evaluated by t values (estimated mean divided by the standard error). In none of the three forms were statistically significant differences found in general reasoning (MForm 1 = .336; Se = .181; p = .06; MForm 2 = –.024; Se = .223; p = .914; MForm 3 = .492; Se = .265; p = .064). Table 6 shows the estimated parameters of the final models.
Table 6. Final models parameter estimations
Note: Standard errors in parenthesis.
Discussion
According to the latest version of the standards for Educational and Psychological Testing (AERA, APA, & NCMEA, 2014), “validity refers to the degree to which evidence and theory support the interpretation of test scores for proposed uses of tests” (p. 11). The BPR, in its different forms, was constructed to assess general cognitive ability. Therefore, the score validation process should provide arguments for the conceptual framework that supports the BPR, the hierarchical structure for reasoning.
The aim of this work was to empirically assess this conceptual framework by gathering evidence based on the internal structure of the tests. The three forms of the BPR consist of different scales or tasks (4 or 5) which jointly configure a general reasoning factor. For each partial reasoning scale item homogeneity was assessed through the ordinal reliability coefficient and exploratory item factor analyses on thetracoric correlation matrices. The estimated coefficients ranged from .80, obtained for Mechanical Reasoning Form 2, to the highest reliability coefficients for the numerical reasoning scales in the three BPR test forms (αForm1 = .93; αForm2 = .94; αForm3 = .93). These results agree with the reliability studies carried out with the BPR (Almeida & Lemos, Reference Almeida and Lemos2006; Baumgarti & Primi, Reference Baumgarti and Primi2006). It is important to note that the high values obtained in the numerical reasoning scales may be explained by the fact that the scales are the only ones that require a constructed response rather than a multiple-choice response (Primi, Rocha da Silva, Rodriguez, Muniz, & Almeida, Reference Primi, Rocha da Silva, Rodrigues, Muniz and Almeida2013).
The hypothesis of the presence of a dominant factor for each partial scale was assessed by using exploratory item factor analysis on the tetrachoric correlation matrices. The percentage of variance explained by the unidimensional factors ranged from .15 in the mechanical reasoning scale Form 2 to .48 in the practical reasoning test Form 1. The lowest values were related systematically to the mechanical reasoning scales, with percentages of 15% for Form 2 and 20% for Form 3. The values shown in the mechanical reasoning test are somewhat lower than the 20% usually adopted to define scale unidimensionality. Recent studies on BPR have suggested that the heterogeneity of situations presented by the items may allow students to respond through practical intuition or tacit knowledge, and through a process of visualization (Amaral, Almeida, & Morais, Reference Amaral, Almeida and Morais2014) which could generate the presence of a specific factor associated with visual capacity (Lemos et al., Reference Lemos, Abad, Almeida and Colom2013; Primi et al., Reference Primi, Rocha da Silva, Rodrigues, Muniz and Almeida2013).
The partial factors defined by each of the reasoning scales (abstract, mechanical, spatial, numerical, verbal, practical) could be considered elements that contribute to the formation of a general reasoning factor. According to the theoretical model on which BPR was built, a common general factor was expected to be found that would reflect the importance of reasoning in the resolution of any of the test tasks. The confirmatory factor analyses for each of the BPR forms confirmed this hypothesis. The general factor explained a percentage of variance of 54%, 43% and 44% for Form 1, Form 2 and Form 3 respectively. As noted by Almeida, Guisande, Primi, & Lemos (Reference Almeida, Guisande, Primi and Lemos2008), the percentage of explained variance decreased slightly with each grade level, and the mechanical reasoning scales were included in the model, which lower coefficients in the general factor.
Finally, the factorial invariance across gender was assessed. The fit of the baseline models was good for all of the forms in the male and female samples, although in Form 3 the goodness-of-fit was worse for the female behavior. The factorial invariance analysis continued with an examination of the equivalence between the unidimensional configurations of the factorial model in both samples. The configural invariance showed a good fit to the data in all of the BPR forms. The next step was to analyze the metric equivalence. This level of invariance added a restriction to the previous model: the equality between the regression coefficients. The fit indexes remained acceptable except for Form 3. After freeing the loadings associated with the mechanical reasoning scale in Form 3, the final indexes showed good fit between the model and the data. The weight of the mechanical scales on general reasoning in the male sample (λfemales = .84) was higher than the weight estimated in the female sample (λfemales = .23).
The study then went on to assess scalar invariance, a necessary step for comparing groups with regard to the general reasoning factor. The analyses showed that none of the BPR forms demonstrated scalar non-invariance across gender. The intercept values for men and women were different in the numerical reasoning scales (Form 1), mechanical reasoning scales (Form 2 and Form 3) and abstract reasoning scales (Form 3). In all three cases the estimated parameters were greater in the male group than in the female group. A substantive interpretation of the findings is directly connected to gender differences in cognitive skills, where scores are systematically higher for males in numerical and visuospatial abilities (Hyde, Reference Hyde2005; Spelke, Reference Spelke2005; Voyer, Voyer, & Bryden, Reference Voyer, Voyer and Bryden1995) and no gender differences are associated with the g factor (Deary et al., Reference Deary, Irwing, Der and Bates2007). However, in this study it is worth pointing out that the only differences in the numerical reasoning test were found in the youngest group of students (9–12 years old).
Focusing on BPR Forms 2 and 3 (age range 13–22), it is interesting to note that the results concur in part with earlier research conducted in a Portuguese sample (Lemos et al., Reference Lemos, Abad, Almeida and Colom2013). While the authors of the 2013 study found partial invariance for the mechanical and numerical scales, the data reported in this study show that the gender differences are associated with the mechanical and abstract reasoning tests. Differences between Spanish and Portuguese samples affecting these results – numerical scale partial invariance and mechanical scale partial invariance – should be further analyzed. Although the main aim of BPR was to construct items with the least possible curricular baggage, the results reported open the door to a possible source of differentiation that would have to be approached through intercultural research.
From a practical and methodological point of view, these results warn against the incorrect practice of directly comparing g scores across gender without evaluating the previous condition of factorial invariance. If the weights and/or intercept values for the factorial model are not invariant, these inequalities might mask any differences in g scores. Any g score comparison must take this different configuration into account.
This research was supported by the Spanish Ministerio de Economía y Competitividad (PSI2011-30256, PSI2014-54020-P) and by the University of the País Vasco (GIU12/32, GIU15/24)


