Ceramic artefacts, found in large quantities at archaeological sites starting from the Neolithic, are related to the social and economic environment specific to their time of manufacture and use. They provide important information about the knowledge and use of raw materials and the exchange of goods and ideas in ancient societies. Any discovery of ceramic artefacts raises questions such as: what kinds of materials are they made of? How were these objects manufactured? Where are they from?
Roman ceramic findings are frequent in Romania. However, artefacts from only a few sites, such as Apulum, Alburnus Major, Sarmizegetusa Regia and Histria, have been the subject of an archaeometric investigation (Ionescu et al., Reference Ionescu, Ghergari and Ţentea2006; Benea & Gorea, Reference Benea and Gorea2007; Benea et al., Reference Benea, Ienciu and Rusu-Bolindeţ2013). The present paper is the first integrated study of Roman ceramics from Napoca, with previous studies being limited (e.g. Ionescu & Ghergari, Reference Ionescu, Ghergari and Rusu-Bolindeţ2007). Household pottery sherds have been found within the remnants of a Roman villa urbana in the centre of today's Cluj-Napoca in Romania (Fig. 1a). The findings are important due to the scarcity of archaeological data in an area presently covered entirely by mediaeval and modern constructions. The extent and type of this second-century CE villa urbana cannot be estimated, but the presence of the household pottery supports the assumption of a residential building. The wares are of good quality, showing even and thin walls and a smoothed or even burnished surface. So far, not much is known about the production of the pottery, if it was made locally or imported, how it was made and from what kinds of materials. However, a few remnants of second-century CE Roman pottery kilns have been found in both the intra and extra muros of Napoca (Fig. 1b) (Ardevan, Reference Ardevan2001; Rusu-Bolindeț, Reference Rusu-Bolindeț2007).
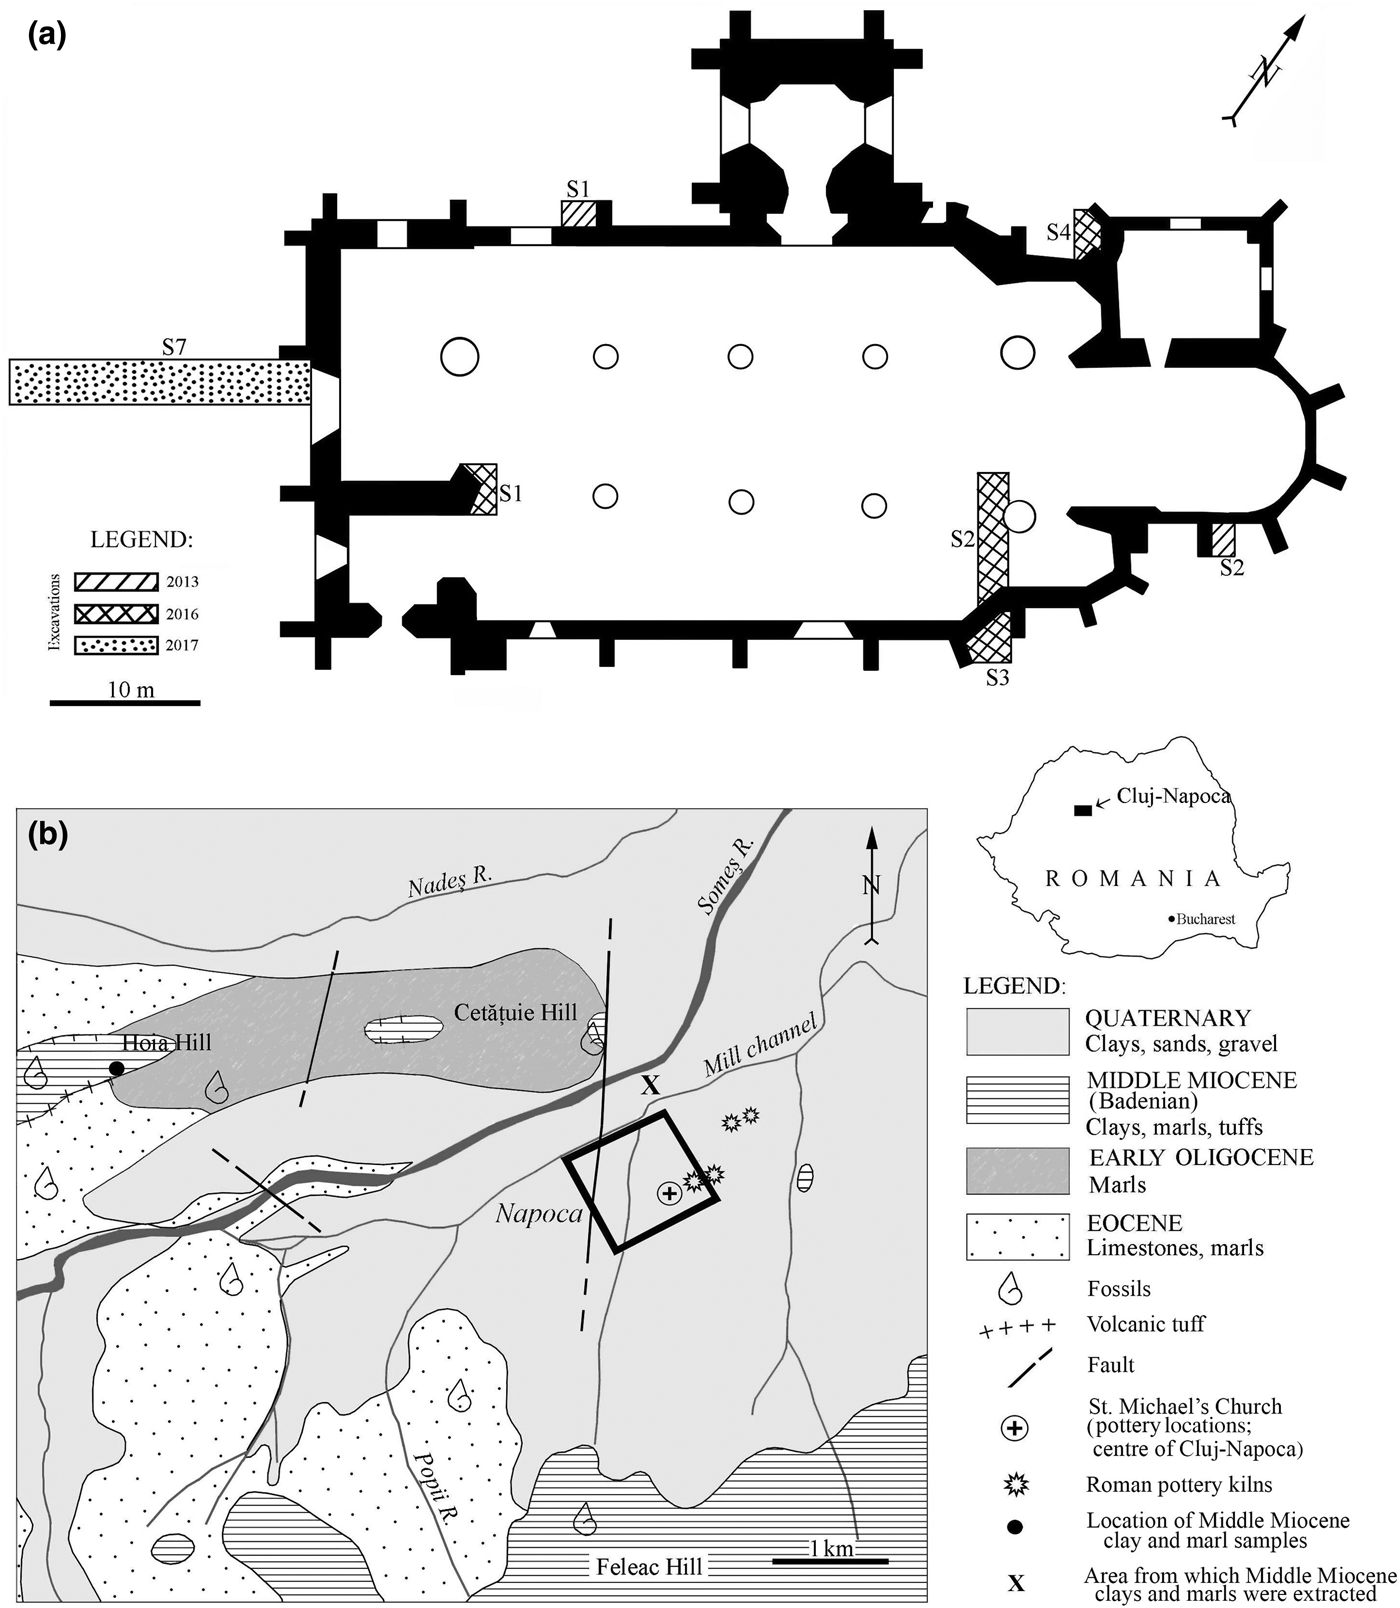
Fig. 1. (a) Location of the archaeological excavations from 2013, 2016 and 2017 projected on the St Michael's Church plan made by M & M Studio and the National Museum of Transylvanian History. (b) Simplified geological map (based on Mészáros & Clichici, Reference Mészáros and Clichici1988) of the surroundings of Cluj-Napoca. The black rectangle marks the limits of the Roman city Napoca (Rusu-Bolindeț, Reference Rusu-Bolindeț2007). The inset in the upper right marks the position of the map area within Romania. The location of the Roman pottery kilns follows the descriptions of Ardevan (Reference Ardevan2001) and Rusu-Bolindeț (Reference Rusu-Bolindeț2007).
In order to complete the typological classification of the ceramic artefacts, this study approached the composition, microstructure and thermal changes of the ceramic body through a combination of polarized light optical microscopy (OM), X-ray powder diffraction (XRPD), Fourier-transform infrared (FTIR) spectroscopy and cold field emission scanning electron microscopy coupled with energy-dispersive X-ray spectroscopy (CFE-SEM-EDX). Micropalaeontological analysis in thin sections completed the study. The research aimed to provide a snapshot of the social and economic life within a Roman city with new data regarding the production of pottery, the raw materials and the technology used. Such a broad approach offers a new glimpse into the life of a Roman city located at a distance away the capital of the empire.
Optical microscopy provides the first insights into the mineral composition and the fabric (microstructure and microtexture) of the ceramic body (Maggetti, Reference Maggetti1979, Reference Maggetti, Olin and Franklin1982). X-ray powder diffraction is used widely in identifying crystalline mineral phases in ceramics (Heimann, Reference Heimann and Hunt2017), but not pseudo-amorphous ones. In contrast, FTIR spectroscopy allows for the study of both crystalline and pseudo-amorphous phases (Shoval et al., Reference Shoval, Yadin and Panczer2011), producing “a mineralogical fingerprint of the ceramic” (Shoval, Reference Shoval and Hunt2017), and it may be used for structural investigations of clay minerals (Madejová & Komadel, Reference Madejová and Komadel2001; Madejová, Reference Madejová2003). Finally, CFE-SEM-EDX investigates (to a resolution of <10 nm) the physical details and the chemistry of the materials (Inada et al., Reference Inada, Kakibayashi, Isakozawa, Hashimoto, Yaguchi and Nakamura2009; Brodusch et al., Reference Brodusch, Demers and Gauvin2018). This high-resolution method can be used for the study of ancient ceramics, in a similar way to the field emission electron gun microprobe (Ionescu et al., Reference Ionescu, Topa and Hoeck2017). Micropalaeontology might give important additional hints as to the clayey raw materials used and the firing temperature used for pottery (see Quinn & Day, Reference Quinn and Day2007; Quinn, Reference Quinn2008).
In order to determine whether the pottery was produced locally, Middle Miocene rocks from the surroundings of the site (Fig. 1b) were investigated by OM and XRPD and for their micropalaeontological content.
ARCHAEOLOGICAL AND GEOLOGICAL BACKGROUND
St Michael's Catholic church located in the very centre of present-day Cluj-Napoca is one of the most famous gothic buildings in Transylvania (Romania). It was built in two major phases, starting from the beginning of the fourteenth century until the end of the fifteenth century (Pascu, Reference Pascu1974; Lukács, Reference Lukács2005). During the 2013, 2016 and 2017 renovation works, three archaeological research campaigns were carried out in trenches excavated inside and outside of the church building (Fig. 1a). Beneath the levels containing mediaeval structures, remnants of buildings from Napoca – one of the most important civil settlements of Roman Dacia in the second to third century CE – were found. The plan of Napoca fits into the common urban scheme of Roman cities, which consisted of ‘insulas’ (islands; i.e. parcels of land delimited by four streets). These insulas usually contained one or more houses (Havas et al., Reference Havas, Németh and Szabó2001).
The Roman stratigraphic sequence that was opened in the western part of St Michael's church, between 1.50 and 2.60 m in depth, includes three construction levels of Roman Napoca. Two levels are assigned to the so-called ‘wooden phase’, dated between 106 CE (the conquest of Dacia) and 160 CE (Cociş et al., Reference Cociş, Voişan, Paki and Rotea1995), when the city consisted of wooden structures covered with plaster. The third, younger level belongs to the ‘stone phase’, dated between 160 and 273 CE (Cociş et al., Reference Cociş, Voişan, Paki and Rotea1995), when the wooden houses were gradually replaced by stone buildings (Rusu-Bolindeț, Reference Rusu-Bolindeț2007).
Archaeological ditch S7 (Fig. 1a) uncovered parts of a building wall and a foundation dated to the ‘stone phase’ (second to third century CE). These overlie an intact stratigraphic sequence, containing remnants of a villa urbana (i.e. a residence on an ‘island’) in the centre of Napoca, dated to the last part of the ‘wooden phase’ (second century CE). Various artefacts have been found at this level, including the household pottery that is the subject of the present study.
The geology of the Cluj-Napoca area (Fig. 1b) consists of Eocene, Oligocene and Miocene sediments of the Transylvanian Basin, as well as Quaternary alluvial and terrace deposits (Nicorici et al., Reference Nicorici, Petrescu and Mészáros1979; Mészáros & Clichici, Reference Mészáros and Clichici1988). Eocene marine limestones (so-called ‘Cluj limestone’) grading into marls towards the top occur southwest and west of Cluj-Napoca, including Hoia Hill and the Someș riverbed. An alternation of marine, brackish and continental sedimentary rocks of Early Oligocene age is found northwest of the city. The Middle Miocene formations are transgressive on the Oligocene and Eocene deposits. The first Middle Miocene sequence (Lower BadenianFootnote 1) is stratigraphically included in the so-called ‘Dej Formation’ (Popescu, Reference Popescu1970) and consists mainly of clays, marly clays and marls with thin levels of volcanic tuffs. The clays and marls contain a characteristic foraminifera fauna, particularly globigerinae. The Lower Badenian deposits crop out north and south of the Someș River, on the Hoia, Cetățuia and the Feleacu hills (Fig. 1b). In the 1980s, surface excavations exposed similar Lower Badenian clays and marls beneath the soil level (Mészáros & Clichici, Reference Mészáros and Clichici1988), south of the Mill Channel. The Upper Badenian deposits consist of radiolarian shales and marls with pteropods and occur south of Cluj-Napoca.
The Someș River Quaternary terraces and alluvial sediments consist of pebbles and sands originating from the metamorphic (and few magmatic) rocks of the Apuseni Mountains, located 25 km west of Cluj-Napoca (Răileanu et al., Reference Răileanu, Saulea, Dumitrescu, Bombiţă, Marinescu, Borcoş and Stancu1967), such as quartzitic schists, micaschists, gneisses, andesites, etc. The watershed of the river also includes various sediments of the Transylvanian Basin (e.g. clays, marls, siltstones, chert, sandstones and limestones).
MATERIALS AND ANALYTICAL METHODS
In the following, we consider ceramics as ‘artificial rock’ (Maggetti, Reference Maggetti2001), formed through the so-called ‘anthropogenic metamorphism’ (Grapes, Reference Grapes2011), by firing a claystone (mudstone) at high temperature and atmospheric pressure. Compositionally, a clay-based ceramic body consists of a fine matrix (groundmass) cementing various aplastic fragments (clasts, or ‘inclusions’). The size limit between matrix and clasts is conventionally set at 15 µm (Maggetti, Reference Maggetti1979, Reference Maggetti, Olin and Franklin1982) or 20 µm (Ionescu & Ghergari, Reference Ionescu, Ghergari and Rusu-Bolindeţ2007; Ionescu et al., Reference Ionescu, Hoeck and Ghergari2011). The aplastics originate either in the clayey raw material or are added by the potter, in which case they are called ‘temper’ (Maggetti, Reference Maggetti1979; Shepard, Reference Shepard1985).
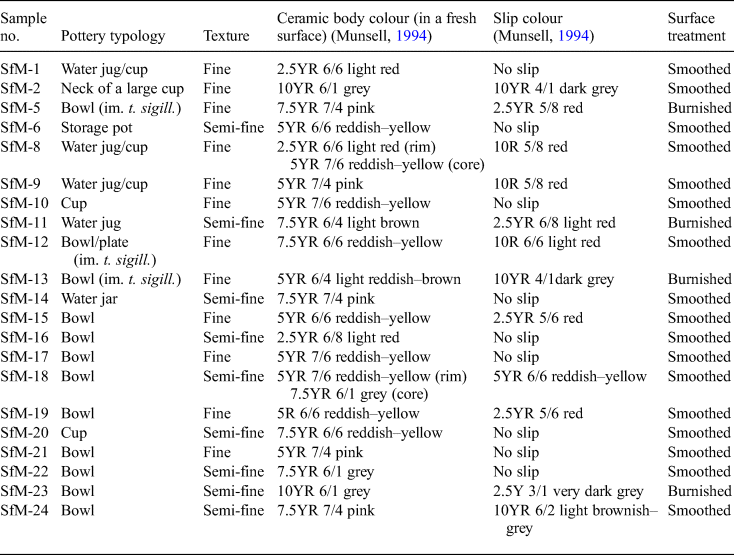
The present study includes 21 samples labelled SfM (from ‘Sfantul Mihail’, i.e. ‘Saint Michael’ in Romanian), out of ~100 fragments of Roman pottery found so far in a level linked to a villa urbana and dated to the ‘wooden phase’ of the Roman city of Napoca. The 21 samples (Table 1) are representative of the ceramic varieties in terms of typology and fineness/appearance. The sherds are fragments of household wares such as cups, bowls, water jugs, storage pots and water jars (Table 1). Except for samples SfM-8 and SfM-18, which have a slight ‘sandwich-structure’ (Nodari et al., Reference Nodari, Maritan, Mazzoli and Russo2004), the ceramic bodies of all sherds are homogeneous, with mostly reddish–yellow and, less often, grey hues (Fig. 2). Almost no inclusions are visible except for some quartzitic ones in SfM-22 and SfM-23. The ceramic sherds have a smoothed surface, sometimes with shiny traces of burnishing (i.e. treatment with an implement such as a water-worn pebble; see Ionescu et al., Reference Ionescu, Hoeck, Crandell and Šarić2015) or are covered by slip. All sherds show parallel striations on the surface and were probably modelled on a potter's wheel. Three samples (SfM-5, SfM-12 and SfM-13) are rough imitations of terra sigillata (i.e. well-known tableware produced in Italy and Gaul and with a distinct appearance, with glossy reddish slip and images in positive relief). Because, macroscopically, these samples have a similar ceramic body (wall) to the rest of the sherds, they were included in the study.
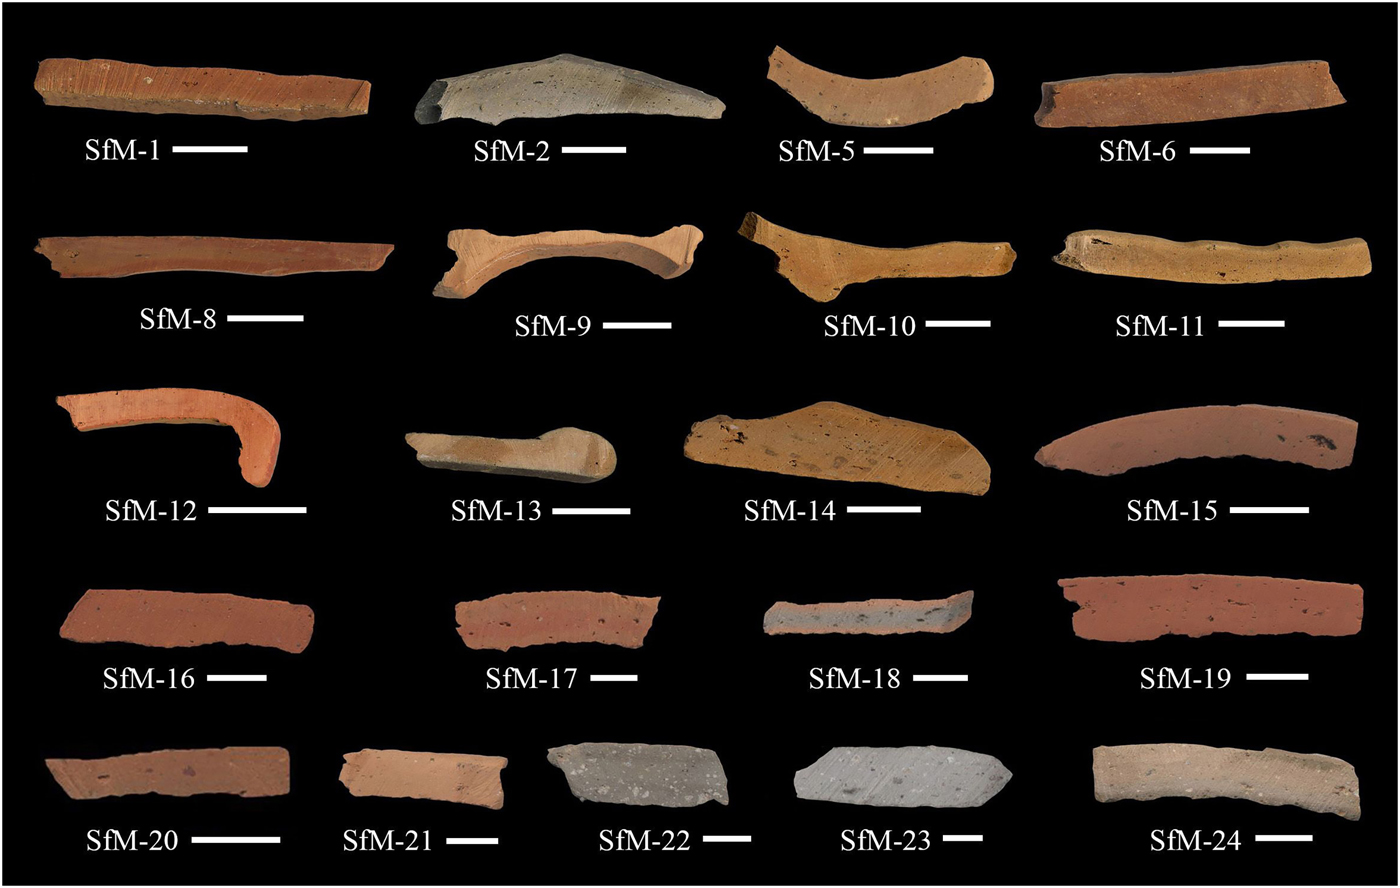
Fig. 2. The colouring and internal structures of the 21 Roman sherds as seen in freshly cross-cut surfaces of the slices used for the thin sections. The scale bar is 1 cm for all samples.
Table 1. List of samples studied and their typological and macroscopic characteristics.
im. t. sigill = imitation of terra sigillata.
From thin slices cut across the ceramic wall, two sections have been prepared from each sherd (Fig. 2) and studied mineralogically and petrographically with an Axio Imager.A2m Zeiss polarizing microscope. A high-resolution Zen 2011 Axio digital video and still camera was used for image capture. The Middle Miocene marly clay samples were impregnated with epoxy resin to facilitate the cutting of thin sections.
To define the mineralogical composition and some of the thermal changes that occurred during firing, a few grams from each of the 21 sherds were hand-milled in an agate mortar and analysed by XRPD. The bulk samples and the clay fraction (<4 µm) from the Middle Miocene marly clay were analysed by X-ray diffraction (XRD). The clay fractions were treated for several days with acetic acid (9 vol.% concentration) to remove carbonates prior to preparation of oriented specimens. The clay mounts were air-dried and ethylene glycol (EG)-solvated for 24 h at room temperature (Price & McDowell, Reference Price and McDowell1993) and also analysed by XRPD to identify smectite. A Bruker D8 Advance diffractometer (Department of Geology, Babeş-Bolyai University, Cluj-Napoca) with Bragg-Brentano geometry operated at 40 kV and 40 mA, with Cu-Kα1 radiation (λ = 1.5418 Å), a Ni 0.0125-mm filter and a one-dimensional LynxEye detector (fitted with a 2.5° Soller slit), was employed for XRD analysis. The samples were scanned between 5 and 64°2θ, with a step size of 0.02°2θ. Corundum NIST SRM1976a served as an internal standard. The identification of the minerals is based on Caroll (Reference Caroll1970), Moore & Reynolds (Reference Moore and Reynolds1997), Bruker's Diffrac.Eva 2.1 software and The International Centre for Diffraction Data (www.icdd.com) PDF 2016 database.
Fourier-transform infrared spectroscopy provided information on the composition and microstructural changes in the ceramic bodies of all 21 sherd samples. About 3 mg of powder was analysed at room temperature with an ASCO 6200 FTIR spectrometer (Institute of Interdisciplinary Research on Bio-Nano-Sciences, Babeş-Bolyai University, Cluj-Napoca). The pellets were prepared by mixing the powder with 250 mg of spectroscopically pure KBr and were analysed immediately after preparation to avoid hydration. Spectra were recorded over 256 scans in the 4000–400 cm–1 range and at 4 cm–1 resolution. For all samples, deconvoluted spectra for the 1400–700 cm–1 domain were obtained.
The microstructural features and chemistry of the fresh surfaces of 11 ceramic samples selected based on representative composition and texture (SfM-1, SfM-6, SfM-11, SfM-12, SfM-14, SfM-15, SfM-16, SfM-17, SfM-18, SfM-19 and SfM-24) were investigated using an Hitachi 8230 CFE-SEM equipped with an EDX detector (Oxford Instruments) at INCDTIM, Cluj-Napoca. Detailed images were obtained by scanning the sample surface under vacuum with a very finely focused <10 nm electron beam. The beam was produced by CFE using a tungsten crystal. For chemical analysis, the spectra were collected from uncoated samples. For secondary electron (SE) images, the surfaces of the samples were sputter-coated with a 10-nm-thick film of Au + Pd. The contact with the support was through Ag paste. For the quantitative analyses, the microscope was operated at a 30 kV acceleration voltage and a 50 s live time, scanning a surface of a minimum of 100 nm2. The detection limits are ~0.1 mass% for all analysed elements.
RESULTS
Polarized light OM
The ceramic body has basically the same compositional characteristics as any traditional ceramics (i.e. a clayey matrix embedding aplastic inclusions [clasts] of various sizes and natures; Table 2, Figs 3a–f, 4a,b). Under plane-polarized light, the matrix has a reddish–brownish–orange colour and is generally translucent, with scarce tiny opaque concretions. Apart from very fine grains of quartz and feldspar, in the matrix there are fine grains of unevenly distributed carbonate. The porosity is low and most of the voids have a small size and irregular shape. A gradual transition from microcrystalline (e.g. sample SfM-13 in Fig. 3a) to an amorphous or pseudo-amorphous clayey matrix (e.g. sample SfM-16 in Fig. 3d) is observed in the whole set of sherds. The microcrystalline matrix is predominantly anisotropic and shows high birefringence. Only in some places or at the grain boundaries are there amorphous, isotropic zones, probably due to sintering (Emami et al., Reference Emami, Sakalib, Pritzel and Trettin2016). Gradually, the amount of amorphous material increases (SfM-6 and SfM-8 in Fig. 3b,c) and the matrix becomes more isotropic (SfM-16 in Fig. 3d). Quartz, feldspars and micas not affected by firing display anisotropy (i.e. a crystalline structure is still present).
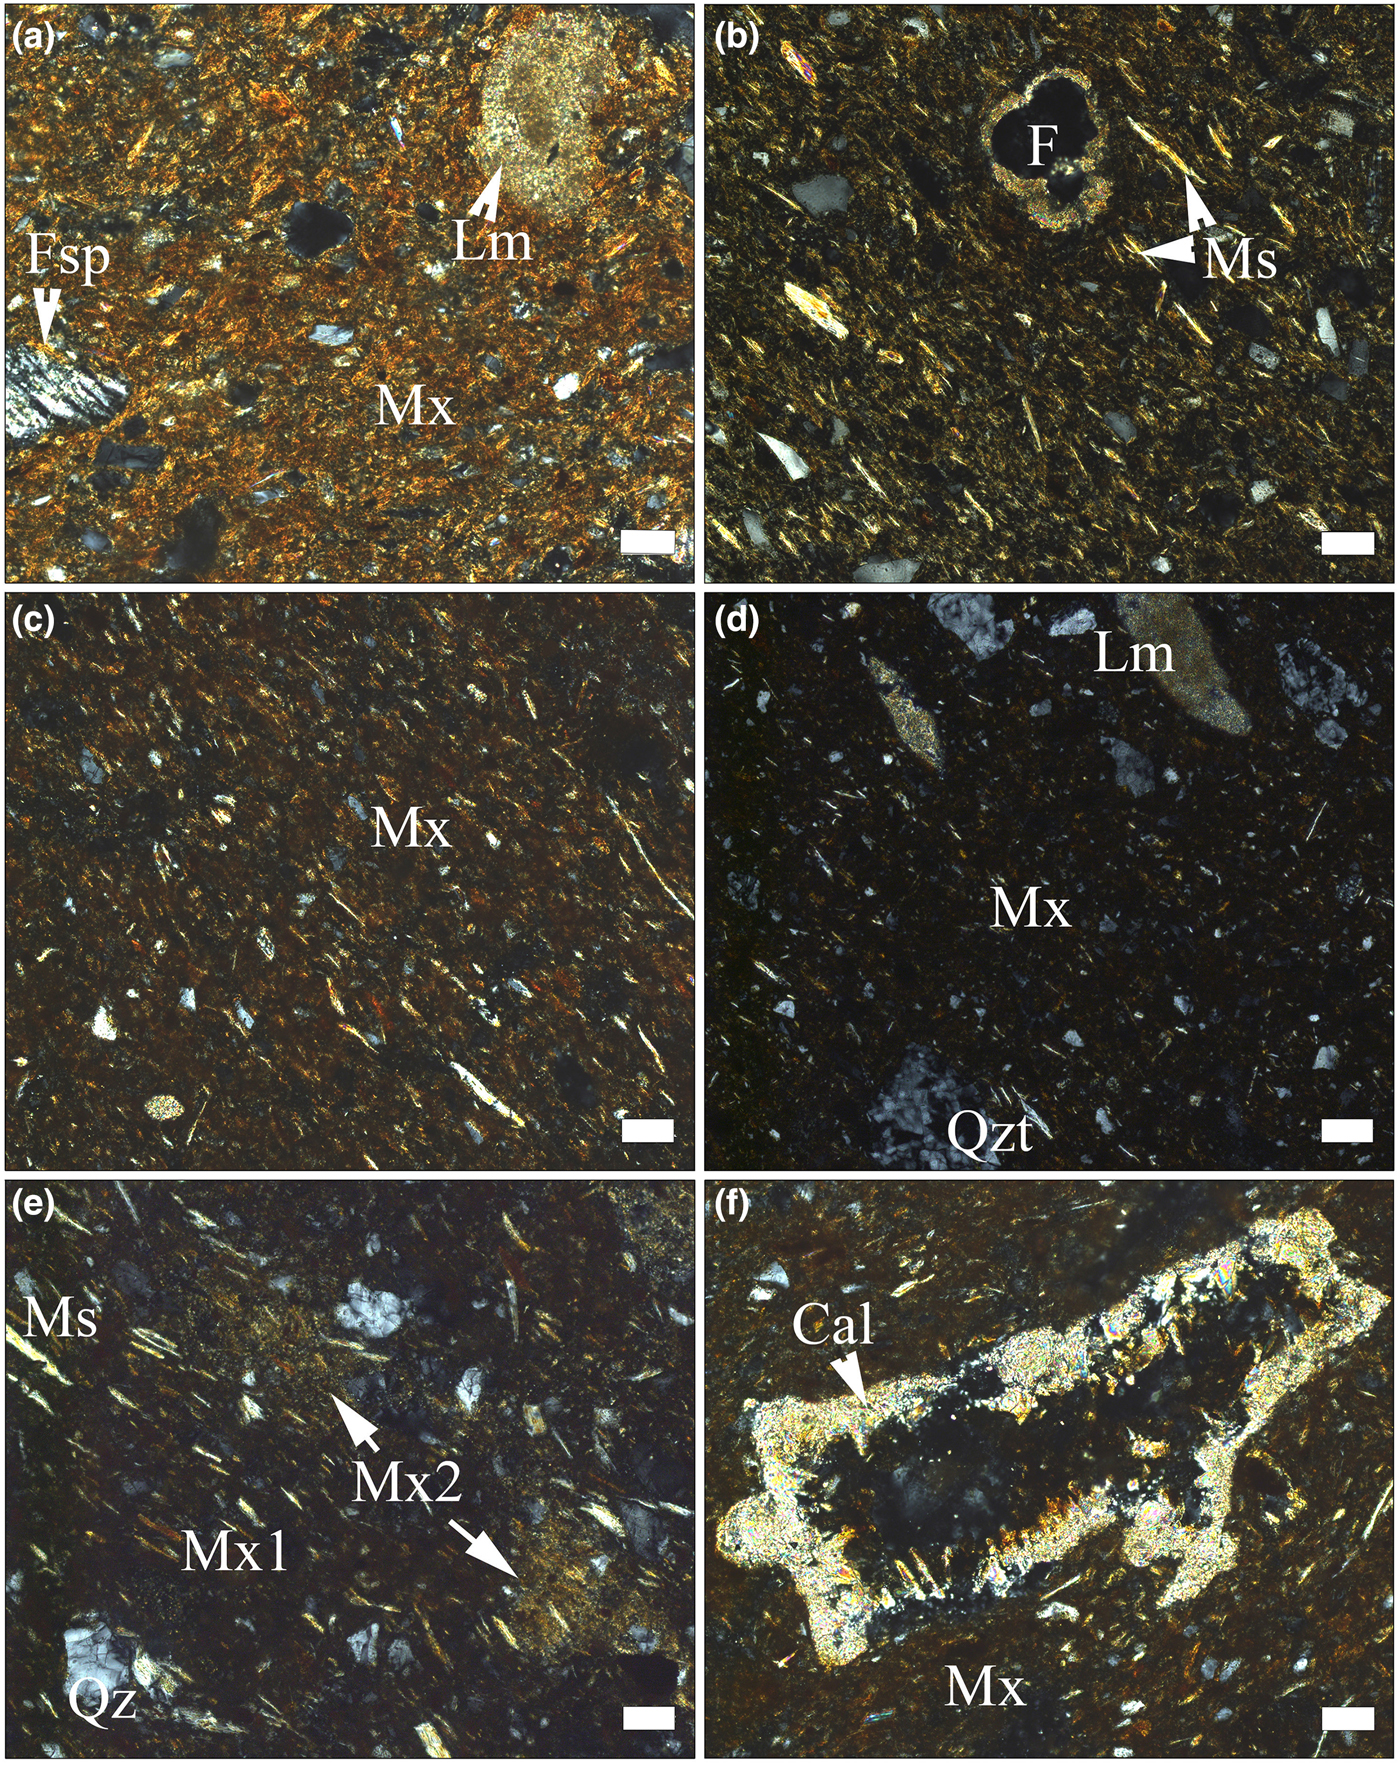
Fig. 3. Polarized light photomicrographs of pottery sherds. (a) Anisotropic matrix in SfM-13 (imitation of terra sigillata), with fragments of feldspar, quartz (white and grey spots) and slightly thermally transformed micritic limestone; chaotic texture. (b,c) Mostly anisotropic matrix (light parts in the images), with isolated isotropic areas (dark parts in the images) due to sintering; the muscovite lamellar arrangement marks the oriented texture in samples SfM-6 (b) and SfM-8 (c). Indeterminate planktonic foraminifera (F) in (b). (d) Isotropic matrix, with crystalline quartz, micas (elongated light spots) and quartzite and micritic limestone lithoclasts; SfM-16. (e) Mix of carbonate-poor (Mx1) and carbonate-rich (Mx2) clayey material in SfM-10; oriented texture. (f) Calcite crystals lining the walls of a void in SfM-8. Mineral abbreviations according to Whitney & Evans (Reference Whitney and Evans2010) are used here: Fsp = feldspar, Qz = quartz, Ms = muscovite, Cal = calcite. Additional abbreviations: Mx = matrix, Qzt = quartzite, Lm = limestone. All images with crossed polarizers (P+). Scale bar is 50 µm, except for (d), where it is 100 µm.
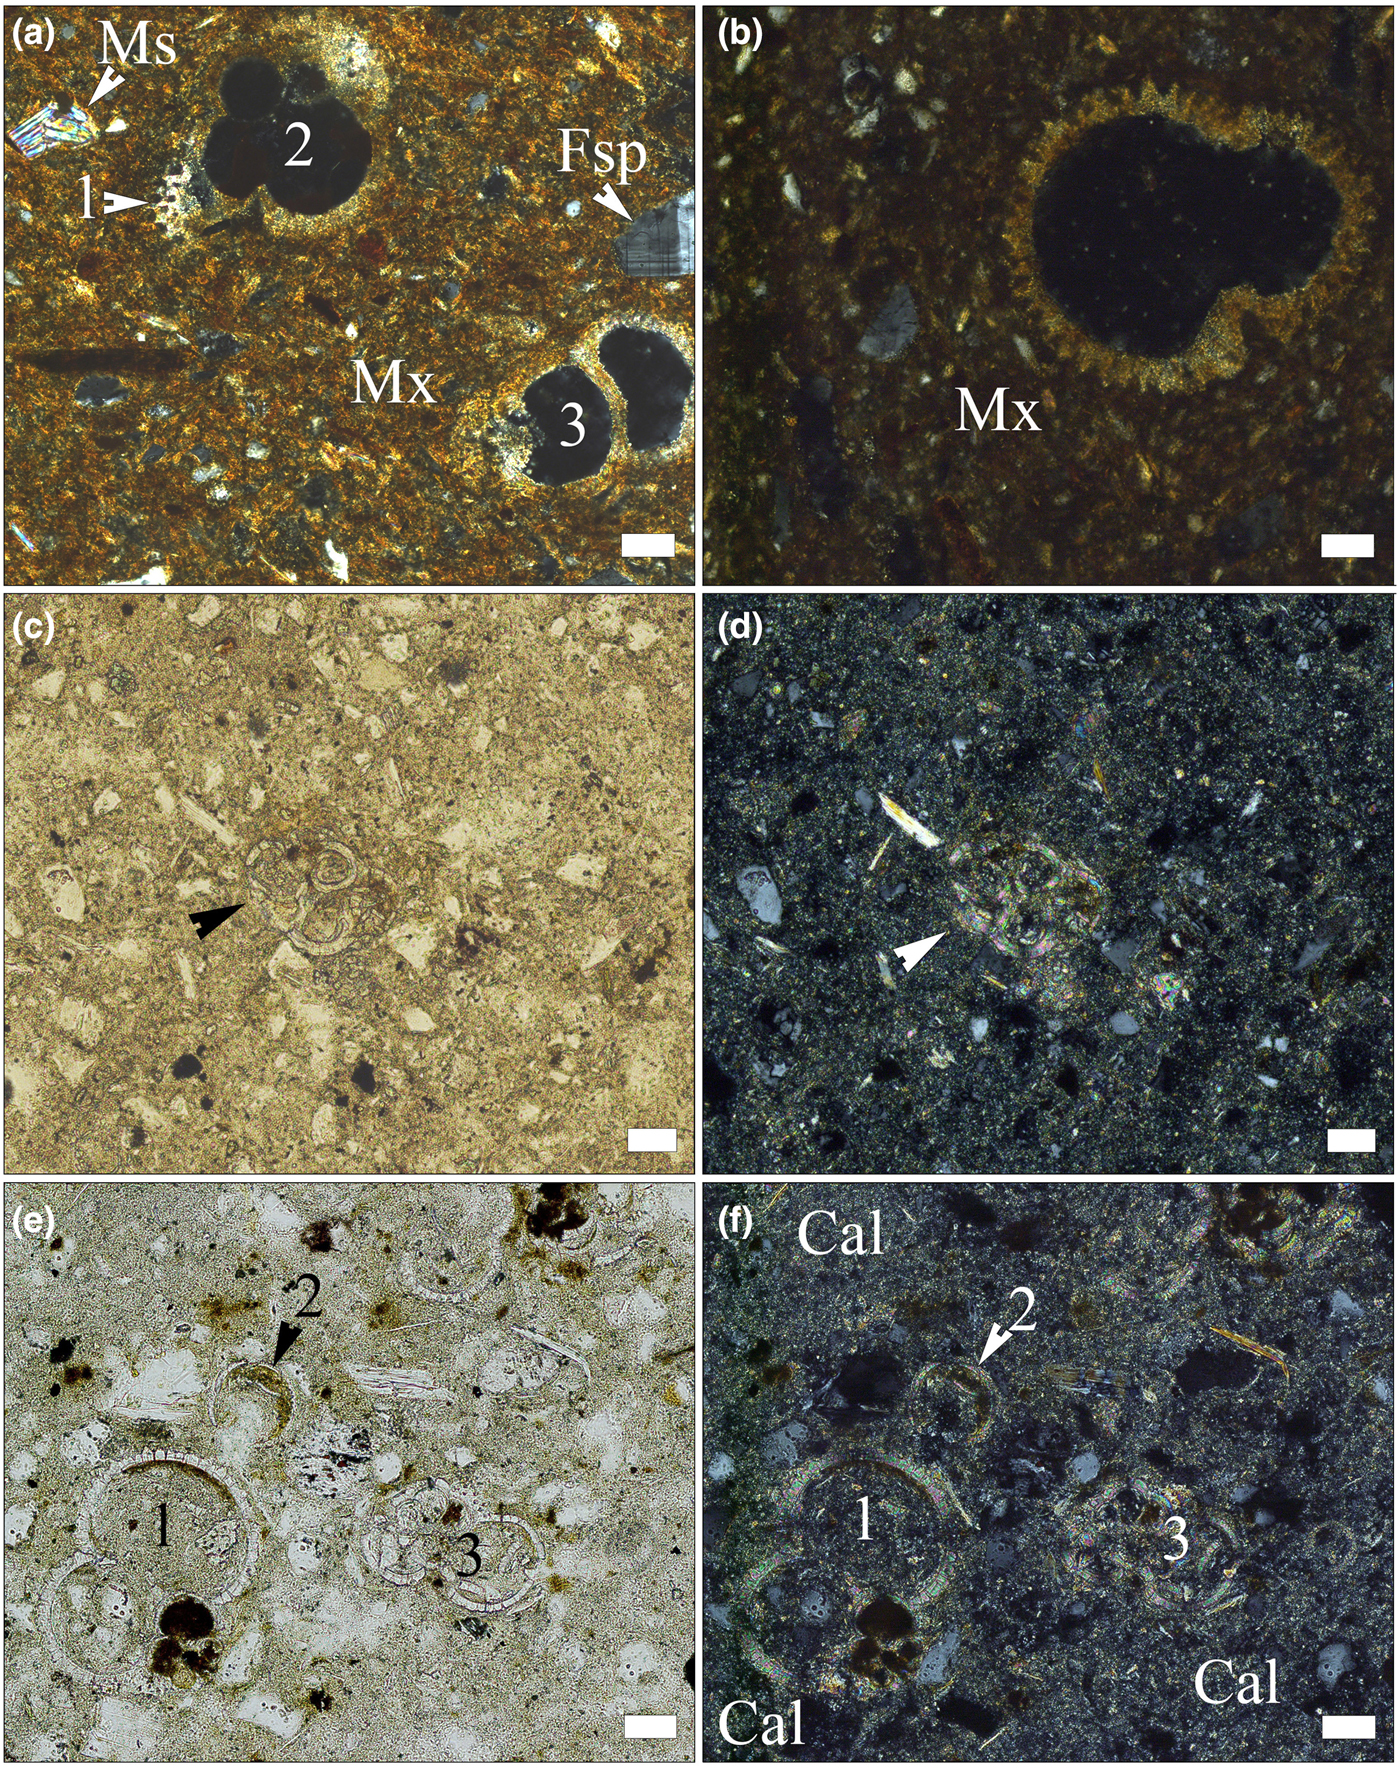
Fig. 4. Photomicrographs of fossil foraminifera tests in pottery sherds (a,b) and in Lower Badenian rocks (c–f). (a) Globigerina sp. (1, 2) and indeterminate foraminifera (3) in sample SfM-6, crossed polarizers. (b) Trilobatus sp. in sample SfM-14, crossed polarizers. (c) Globigerina sp. (indicated by arrowhead), in sample Clay-3, single polarizer. (d) Same image, with crossed polarizers. (e) Numerous foraminifera tests in sample Clay-3: Trilobatus sp. (1), Candorbulina sp. (2) and Globigerina sp. (3) single polarizer. (f) Same image, with crossed polarizers; the rock shows zones richer in carbonates (Cal). Scale bar is 50 µm for all images.
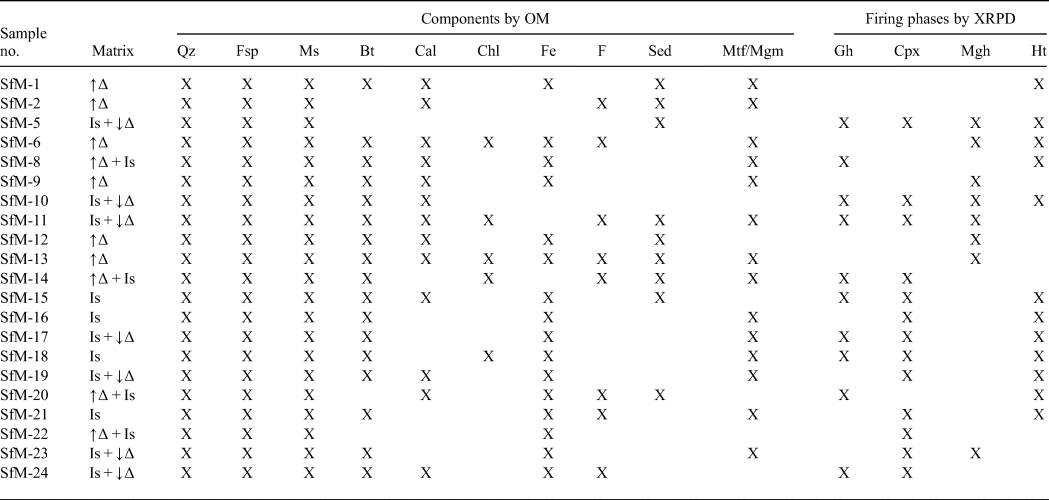
Table 2. Optical characteristics of the matrix and phase compositions of the ceramic sherds resulting from OM and the main firing phases, based on XRPD.

Mineral abbreviations as previously, in addition: Bt = biotite; Chl = chlorite; Gh = gehlenite; Cpx = clinopyroxene; Mgh = maghemite; Ht = hematite; F = fossils; Sed = sedimentary rock fragments; Mtf/Mgm = metamorphic/magmatic rock fragments; ↑∆ = high birefringence; ↓∆ = low birefringence; Is = isotropic.
About half of the sherds are fine-grained with scarce subangular clasts of up to 50 µm in size. The larger clasts, between ~100 and ~200 µm in size and rarely up to 500 µm or even 1 mm (SfM-22), seen in the other sherds give a semi-fine character. The well-oriented texture is marked by the parallel arrangement of mica lamellae and pores (Fig. 3b,c,e). Locally, in some sherds, a chaotic texture may appear (Fig. 3a). The clasts are fragments of quartz, feldspars, muscovite, biotite, rare chlorite and heavy minerals (Table 2). Inhomogeneously distributed fine grains of carbonate occur in most of the sherds. Secondary calcite lining the voids (Fig. 3f) and fissures is also common. Some samples contain small hematitic aggregates, probably of pedogenic origin. The lithoclasts are rare, restricted to the semi-fine sherds and have a subrounded shape. They consist of quartzite, quartzitic schist, micaschist, gneiss, micritic limestone, sandstone, siltstone, chert and andesite. Sample SfM-6 contains scarce subangular fragments of crushed potsherds showing sharp boundaries, a slightly coarser structure and a lower birefringence compared with the host body.
In a number of sherds, such as SfM-10 (Fig. 3e), SfM-11, SfM-14, SfM-15, SfM-17 and SfM-19, the matrix has an inhomogeneous appearance, due to the mix between zones with small and large amounts of carbonate.
In sherds SfM-2, SfM-6, SfM-11, SfM-14, SfM-20, SfM-21, SfM-24 and SfM-13, the latter of which is an imitation of terra sigillata, fossil foraminifera are still preserved, enabling their determination. These fossils are found in sherds both with a crystalline (Figs 3b, 4a) and isotropic matrix (Fig. 4b). Orbulininae (Candorbulina sp.), Globigerinidae (Trilobatus sp. and various other indeterminate species), as well as Globorotaliidae were identified. Abundant foraminifera are characteristic of the Lower Badenian.
The marly clays show fine- to silt-sized quartz, feldspar and rare quartzite clasts, muscovite and chlorite lamellae, fine-grained carbonates and characteristic Lower Badenian foraminifera assemblages, including Orbulininae, Globigerinidae and Globorotaliidae (Fig. 4c–f). In places, the rock looks inhomogeneous due to the large amount of carbonate (Fig. 4f).
X-ray powder diffraction
Phases of various origins occur in the XRD traces, namely primary, firing and secondary (Table 2, Fig. 5). Quartz, illite-muscovite and feldspar are primary minerals, although the latter may also form during firing. The firing phases are hematite, gehlenite, clinopyroxene and maghemite. Calcite is either primary, as a component of micritic limestone fragments or as fine-grained carbonate aggregates physically mixed with an illitic mass, or secondary, being formed by recarbonation after burial.
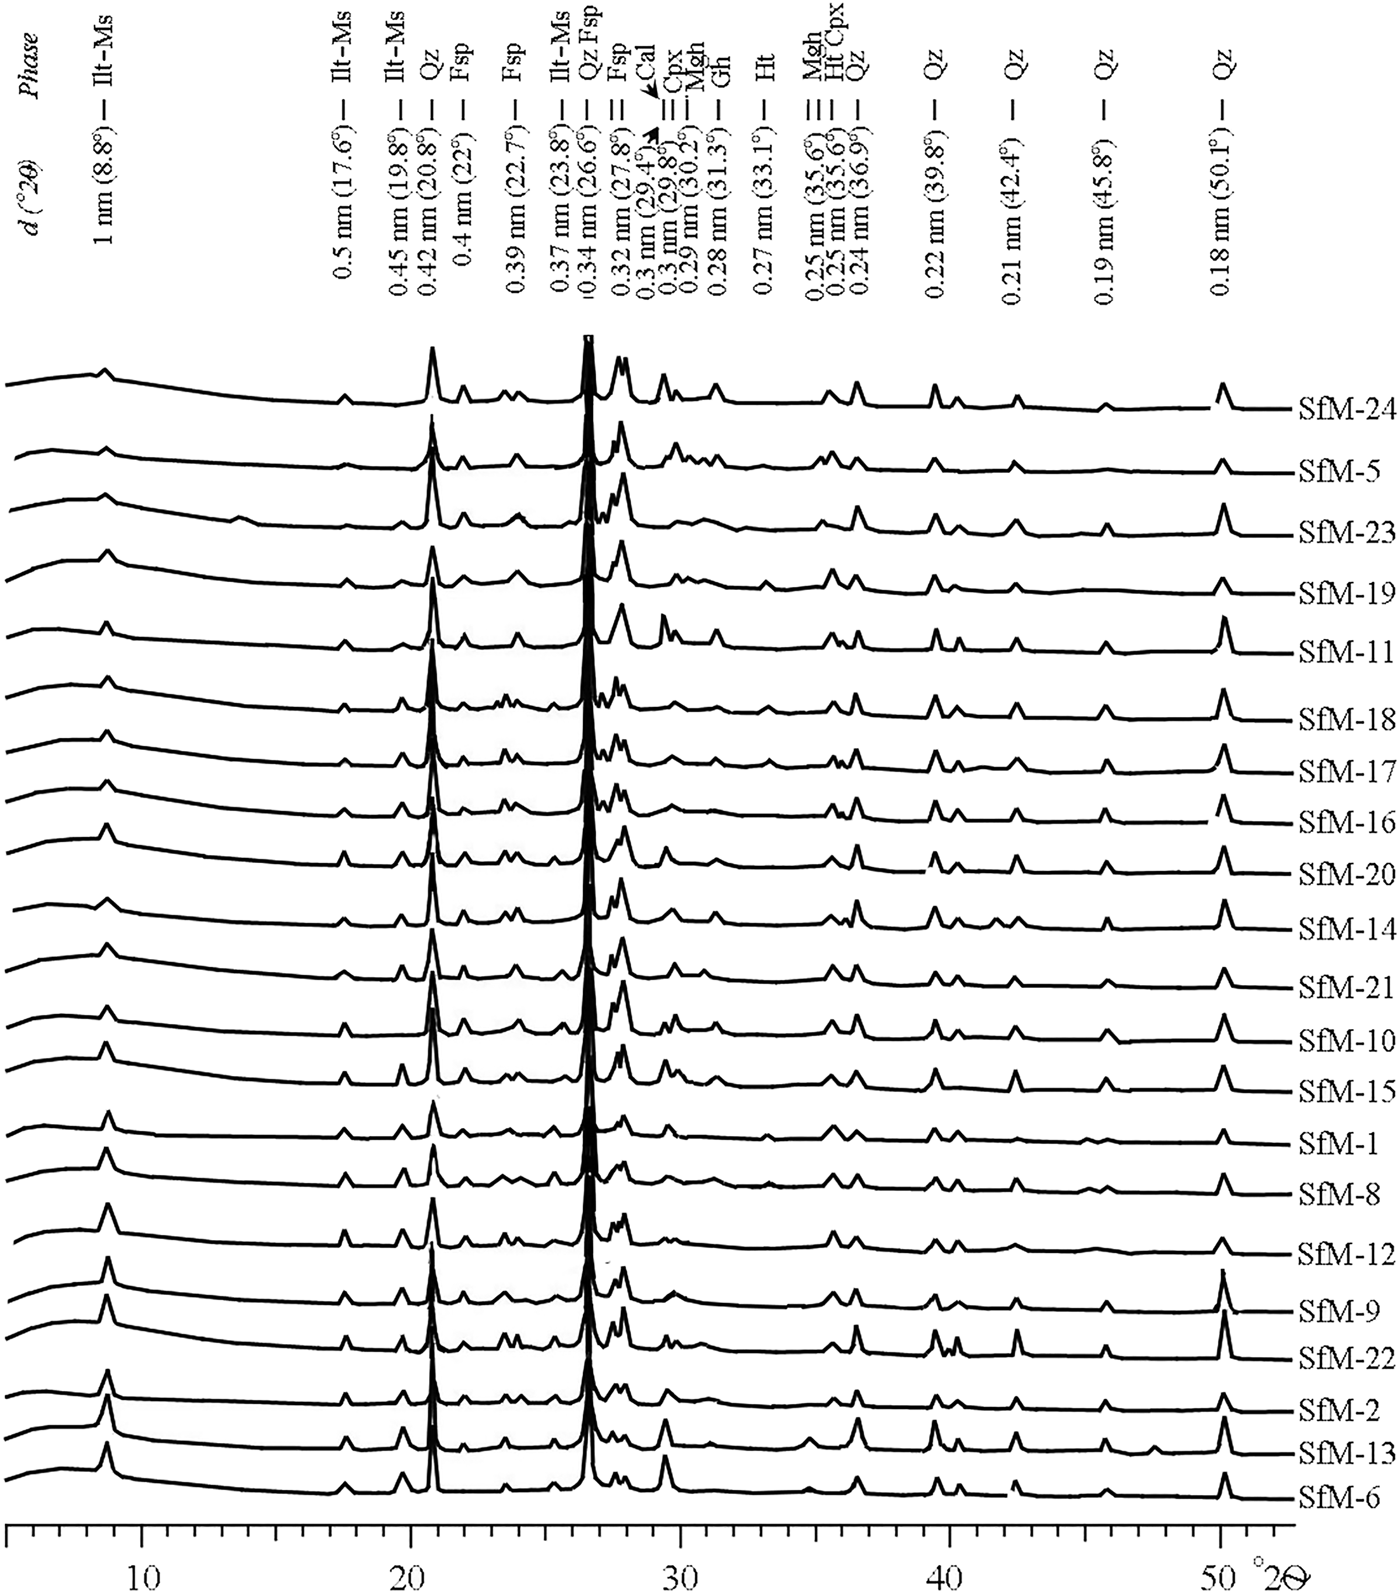
Fig. 5. XRD traces of the Roman potsherds arranged, from bottom to top, according to decreasing intensity of the 10 Å peak of illite-muscovite. Abbreviations as previously, additionally: Ilt-Ms = illite-muscovite.
The peaks at 1 nm (10 Å), 0.50 nm, 0.45 nm and 0.26 nm are common to both illite and muscovite, referred to here as ‘illite-muscovite’. The 1 nm peak may also represent an illite-like material formed by thermal modification of smectite by firing. The 1 nm and 0.45 nm peaks of illite-muscovite are sharp and relatively intense for the samples with a birefringent matrix, and noticeably diminished in the sherds displaying a mixed, low-birefringent and isotropic matrix (compare Fig. 5 with Table 2).
Quartz and feldspar occur in all XRD traces. The intensity of the 0.32 nm peak of feldspar is greater in some samples (e.g. SfM-5, SfM-10, SfM-11, SfM-19, SfM-23 and SfM-24), reflecting the formation of anorthite-rich plagioclase upon firing. The 0.27 nm hematite peak occurs in reddish–brown sherds (compare Table 2 with Figs 2, 5), whereas gehlenite (0.28 nm) and clinopyroxene (0.30 and 0.25 nm) peaks are observed in samples SfM-5, SfM-10, SfM-11, SfM-14, SfM-17, SfM-18 and SfM-24. The main diffraction peak of gehlenite at 0.28 nm fits the Fe3+-rich melilite data obtained by Foit et al. (Reference Foit, Hooper and Rosenberg1987). A small amount of maghemite (0.25 nm) is found in a few sherds. The 0.30 nm calcite peak has variable intensity and occurs in most of the samples.
The XRPD for Lower Badenian marly clays (not shown here) reveals an essentially illitic composition, with quartz, muscovite, calcite and some chlorite. The EG-solvated specimen displays a shift of the diffraction peak from 1.4 to 1.7 nm, indicating the presence of smectite as well as chlorite.
FTIR spectroscopy
All samples produced a wide but weak absorption band at 3430 cm–1 (Fig. 6a), generally interpreted as adsorbed water, which should be liberated at low temperatures upon heating (Madejová & Komadel, Reference Madejová and Komadel2001; Kaufhold et al., Reference Kaufhold, Hein, Dohrmann and Ufer2012; Shoval, Reference Shoval and Hunt2017). Its presence in fired ceramics suggests a rehydroxylation. The 1635 cm–1 band is also due to water (Barilaro et al., Reference Barilaro, Barone, Crupi, Majolino, Mazzoleni, Triscari and Venuti2006), which may be absorbed from the soil during burial, or from the environment after exhumation. The obvious lack of strong OH-stretching vibrations at 3600–3700 cm–1 suggests dehydroxylation upon firing.
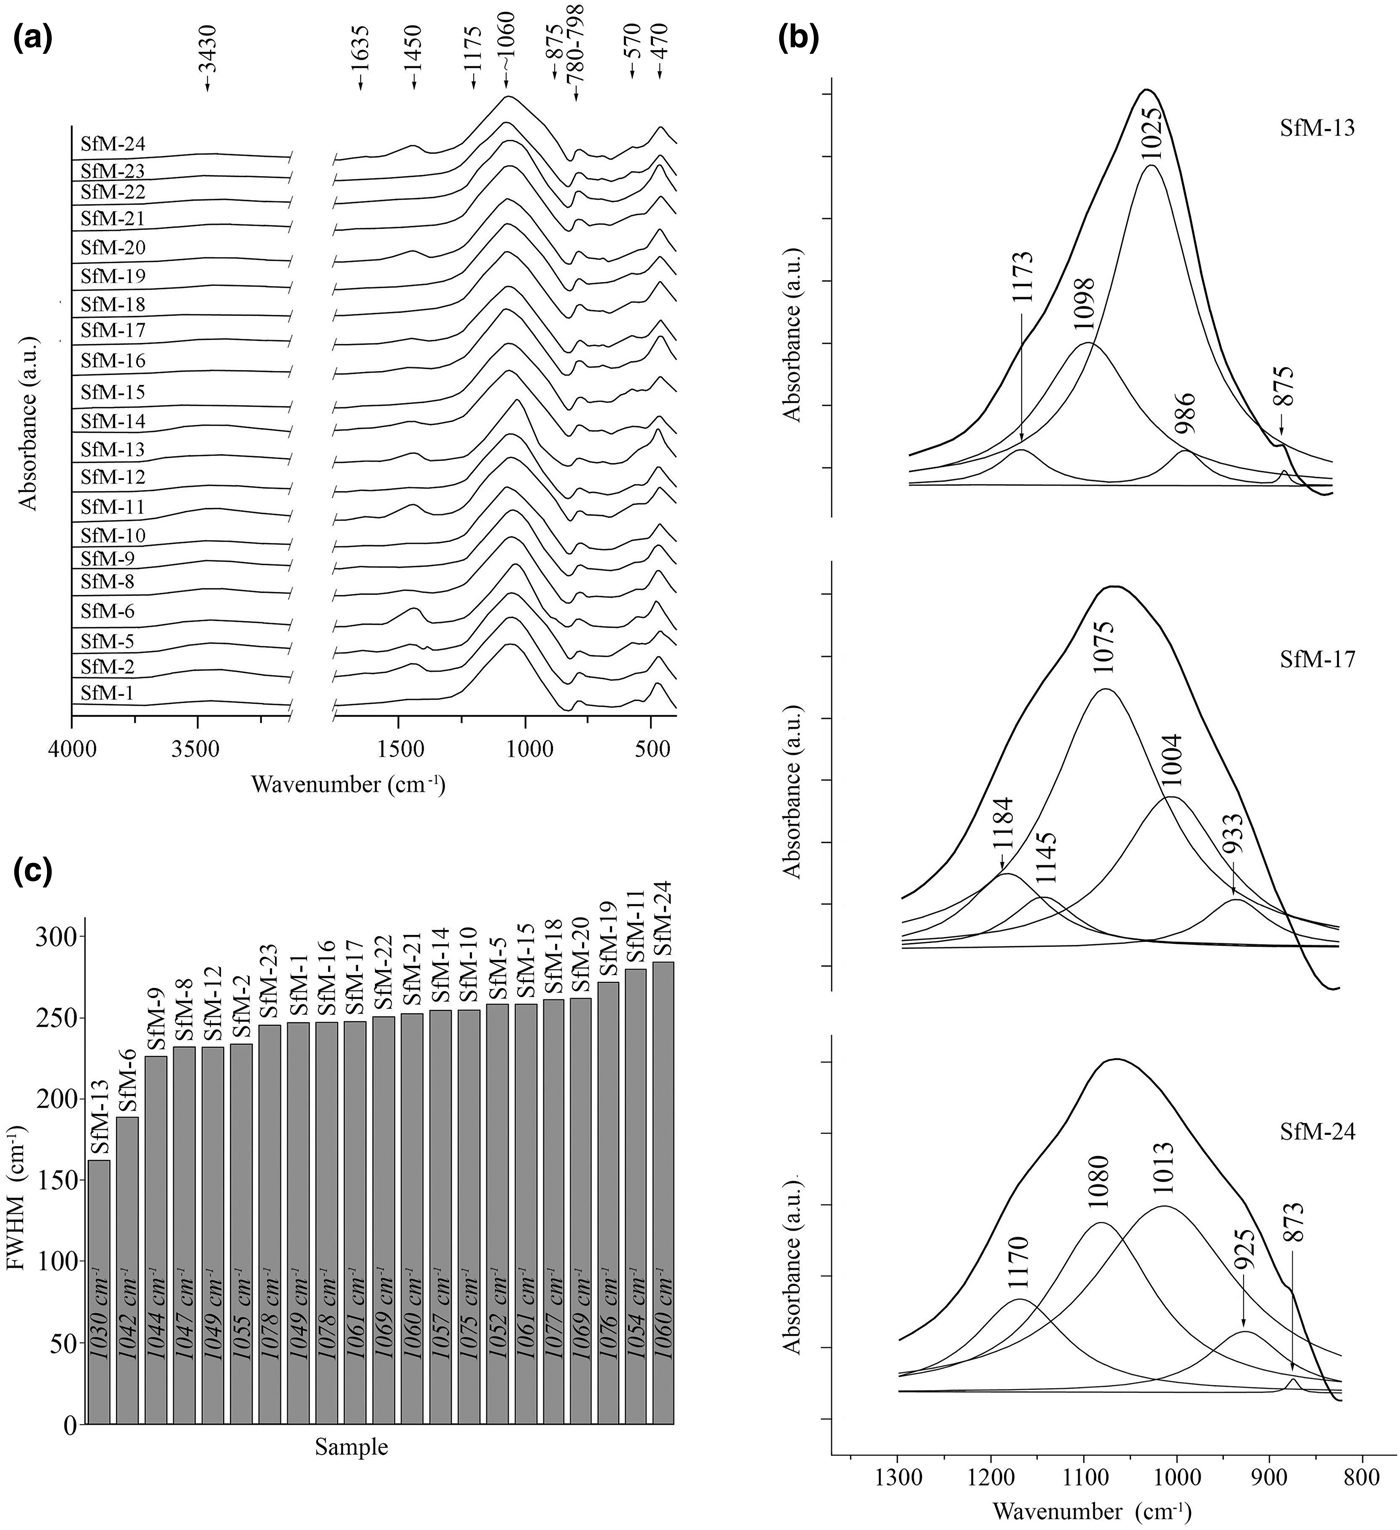
Fig. 6. (a) FTIR spectra of the ceramic samples in the regions 2750–4000 cm–1 and 300–1750 cm–1. (b) Deconvoluted spectra for samples SfM-6, SfM-17 and SfM-24 of the main band (800–1300 cm–1) and phase assignment for each individual contributing band. The fitted spectrum overlaps the experimental one for each deconvolution. (c) Diagram of the FWHM measured for the absorption band centred at 1060 cm–1, arranged in increasing value order. The figures within the bars show the central position for the main bands of the spectra.
The absorption band at 1450 cm–1 is generated by CO3 vibrations (De Benedetto et al., Reference De Benedetto, Laviano, Sabbatini and Zambonin2002; Shoval, Reference Shoval2003; Fabbri et al., Reference Fabbri, Gualtieri and Shoval2014). Although in calcite the band normally appears at lower wavelengths (1420–1430 cm–1), in calcite formed by recarbonation after firing, the band shifts to 1450 cm–1 (Shoval et al., Reference Shoval, Beck, Yadin, Maggetti and Messiga2006; Fabbri et al., Reference Fabbri, Gualtieri and Shoval2014). In this respect, the 1450 cm–1 band (stronger in samples SfM-2, SfM-5, SfM-6, SfM-11, SfM-20 and SfM-24 and weaker in samples SfM-1, SfM-8, SfM-14, SfM-16, SfM-17 and SfM-22) corroborates the assumption that at least some calcite might be interpreted as being formed by recarbonation.
The dominant signal, common for all spectra, is centred at ~1060 cm–1 (Fig. 6a–c), varying from 1030 cm–1 in sample SfM-13 to 1076 cm–1 in SfM-19. This band is related to the Al–O- and Si–O-stretching vibrations and originates from the contribution of various phases, such as fired illite, kaolinite and smectite combined in the so-called ‘meta-clay’ (Shoval et al., Reference Shoval, Yadin and Panczer2011; Shoval, Reference Shoval and Hunt2017), quartz, feldspar (De Benedetto et al., Reference De Benedetto, Laviano, Sabbatini and Zambonin2002) and Ca–Al silicates.
The deconvolution in the 700–1400-cm–1 domain obtained for all samples (e.g. SfM-13, SfM-17 and SfM-24 in Fig. 6b) assisted in assigning this dominant signal. For example, the sherd SfM-13, which displays anisotropy (Table 2), produces a strong band at 1025 cm–1 (‘meta-clay’, quartz and feldspar), and a medium-sized band at 1098 cm–1 due to clinopyroxene (Barilaro et al., Reference Barilaro, Barone, Crupi, Majolino, Mazzoleni, Triscari and Venuti2006) and quartz (Shoval et al., Reference Shoval, Ginott and Nathan1991). The small shoulder at 1173 cm–1 is generated by Si–O-stretching vibrations in quartz and feldspar (De Benedetto et al., Reference De Benedetto, Laviano, Sabbatini and Zambonin2002). Calcite (Madejová & Komadel, Reference Madejová and Komadel2001) and probably gehlenite (De Benedetto et al., Reference De Benedetto, Laviano, Sabbatini and Zambonin2002) yield signals at 875 and 986 cm–1, respectively. Sample SfM-17, which has a combined, isotropic and anisotropic matrix, produces a different dominant signal from SfM-13. In this case, the main contribution is due to the 1075 cm–1 band, assigned to illite (Davarcioğlu & Çiftçi, Reference Davarcioğlu and Çiftçi2009), feldspar (De Benedetto et al., Reference De Benedetto, Laviano, Sabbatini and Zambonin2002), quartz (Shoval et al., Reference Shoval, Ginott and Nathan1991) and clinopyroxene (Barilaro et al., Reference Barilaro, Barone, Crupi, Majolino, Mazzoleni, Triscari and Venuti2006), which were also identified by XRPD. The calcite band at 875 cm–1 is replaced by the gehlenite 933 cm–1 signal. The deconvolution for a sample with an isotropic matrix, such as SfM-24, contains equally contributing bands at 1080 cm–1 (feldspar, clinopyroxene) and 1013 cm–1 (feldspar), reflecting the tendency to homogenize the material through firing. The smaller but significant band at 925 cm–1 may be linked to high-temperature phases, namely gehlenite and clinopyroxene.
The band centred at 1060 cm–1 shows variable full width at half maximum (FWHM) values from 227 to 263 cm–1 in most of the sherds (Fig. 6c). The narrowest FWHM values of 163 and 190 cm–1 were recorded for samples SfM-13 and SfM-6, and the wider signals of 273–285 cm–1 were obtained from samples SfM-19, SfM-11 and SfM-24. This variation may be related to various degrees of crystalline structure collapse during firing. The higher the structural disorder, the wider the absorption bands, and vice versa (Freund, Reference Freund and Farmer1974; Berna et al., Reference Berna, Behar, Shahack-Gross, Berg, Boaretto, Gilboa, Sharon, Shalev, Shilstein, Yahalom-Mack, Zorn and Weiner2007; Shoval et al., Reference Shoval, Yadin and Panczer2011). The vibrations of the Al–O and Si–O bonds yielding wider absorption bands may be related to both the disrupted crystalline structure (including glass) at higher temperature and to the very-fine-grained material. The clay minerals are transformed into metastable dehydroxylated phases (‘meta-clay’), before melting.
The Si–O bending vibrations in quartz give the 798–780 cm–1 doublet (Madejová & Komadel, Reference Madejová and Komadel2001). The signals at 570 and 470 cm–1 are produced by Si–O–Al bending vibrations (Shoval & Beck, Reference Shoval and Beck2005) in various phases, such as feldspar (Barilaro et al., Reference Barilaro, Barone, Crupi, Majolino, Mazzoleni, Triscari and Venuti2006; Barone et al., Reference Barone, Crupi, Longo, Majolino, Mazzoleni and Venuti2011), muscovite (De Benedetto et al., Reference De Benedetto, Laviano, Sabbatini and Zambonin2002; Barone et al., Reference Barone, Crupi, Longo, Majolino, Mazzoleni and Venuti2011) and illite (Srasra et al., Reference Srasra, Bergaya and Fripiat1994).
Cold field emission scanning electron microscopy coupled with energy-dispersive X-ray spectroscopy
The SE images and the EDX spectra show a matrix that is more or less thermally transformed (Figs 7a–h, 8a–f), embedding mostly quartz, feldspar and muscovite clasts. In samples SfM-1 (Fig. 7a,b), SfM-6 (Fig. 7c,d), SfM-12 and SfM-14, the clay minerals and muscovite making up the matrix were sintered together by thin glassy areas. In contrast, sherds SfM-11 (Fig. 8c), SfM-15, SfM-16, SfM-17 (Fig. 7g,h), SfM-18 (Fig. 7e,g), SfM-19 and SfM-24 show extended vitrification, with the glassy matrix forming a reticulated network (Fig. 7e). The glass generally has bloating pores (Fig. 7e) due to degassing during melting.
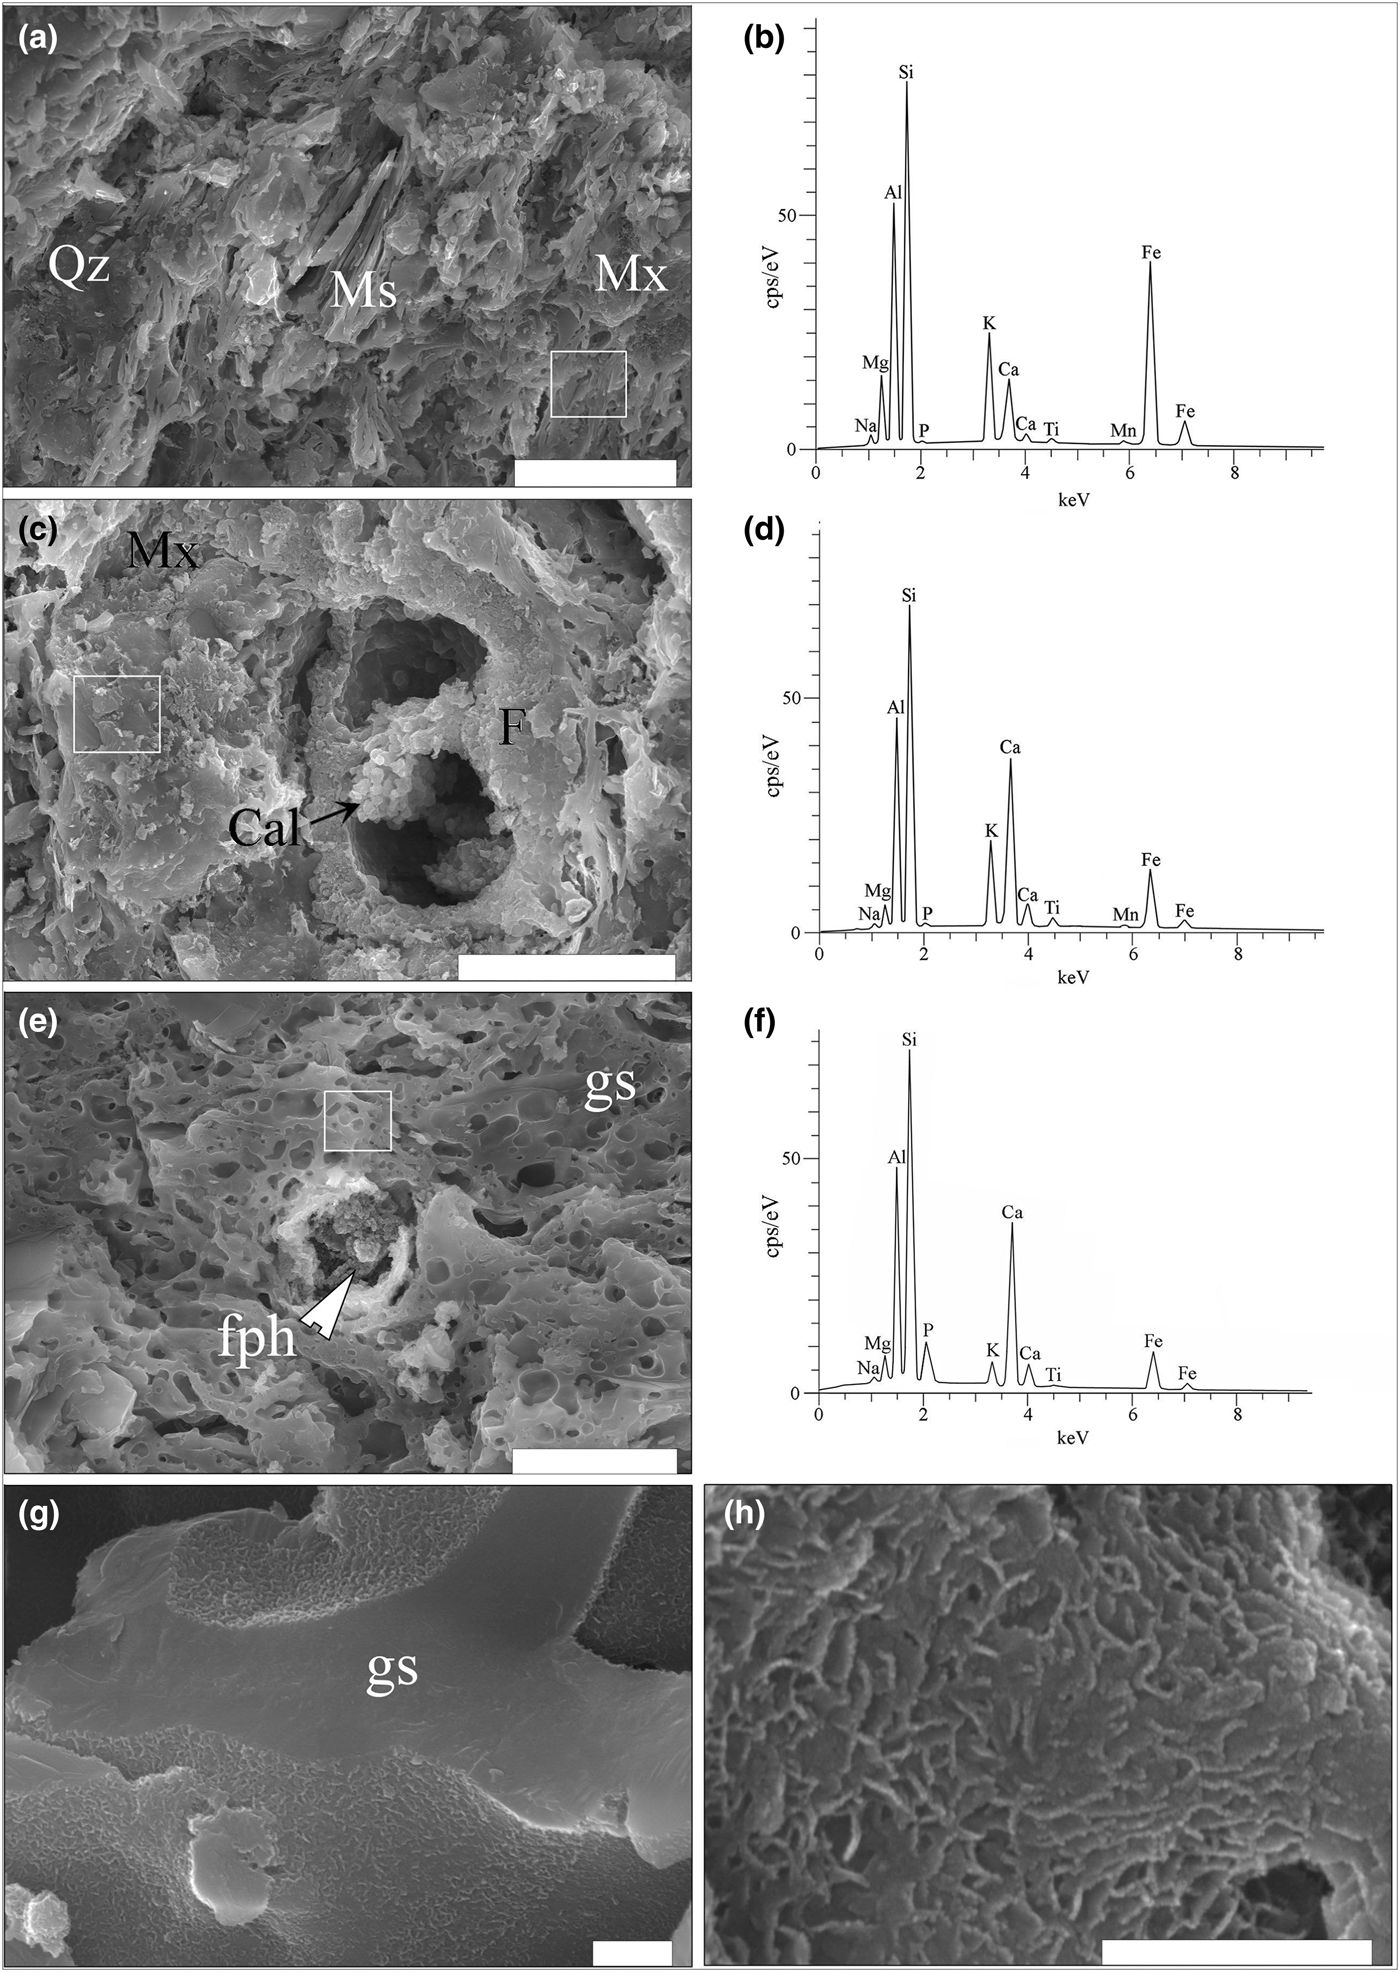
Fig. 7. SE images and EDX spectra for the ceramic sherds. (a) Sintered Fe-rich illite-like matrix, quartz grains and muscovite lamellae in sample SfM-1. (b) EDX spectrum of Ca-poor illite-like matrix in SfM-1. (c) Sintered mass of phyllosilicates forming a Ca-rich illite-like matrix in SfM-6. Remnants of a fossil foraminifera test containing a cluster of calcite crystals. (d) EDX spectrum of the matrix in SfM-6. (e) Sample SfM-18 showing a glassy matrix (gs) with bloating pores and a decomposed carbonate aggregate replaced by a fine-grained firing phase (fph). (f) EDX spectrum of glass in SfM-18. (g) Glassy network in SfM-17. (h) Details of the ‘wrinkled’ surface of the glass. The white rectangles in (a), (b) and (c) mark the surfaces where the spectra were collected. Abbreviations, as previously. Scale bars: 20 µm for (a) and (c); 10 µm for (e); and 500 nm for (g) and (h).
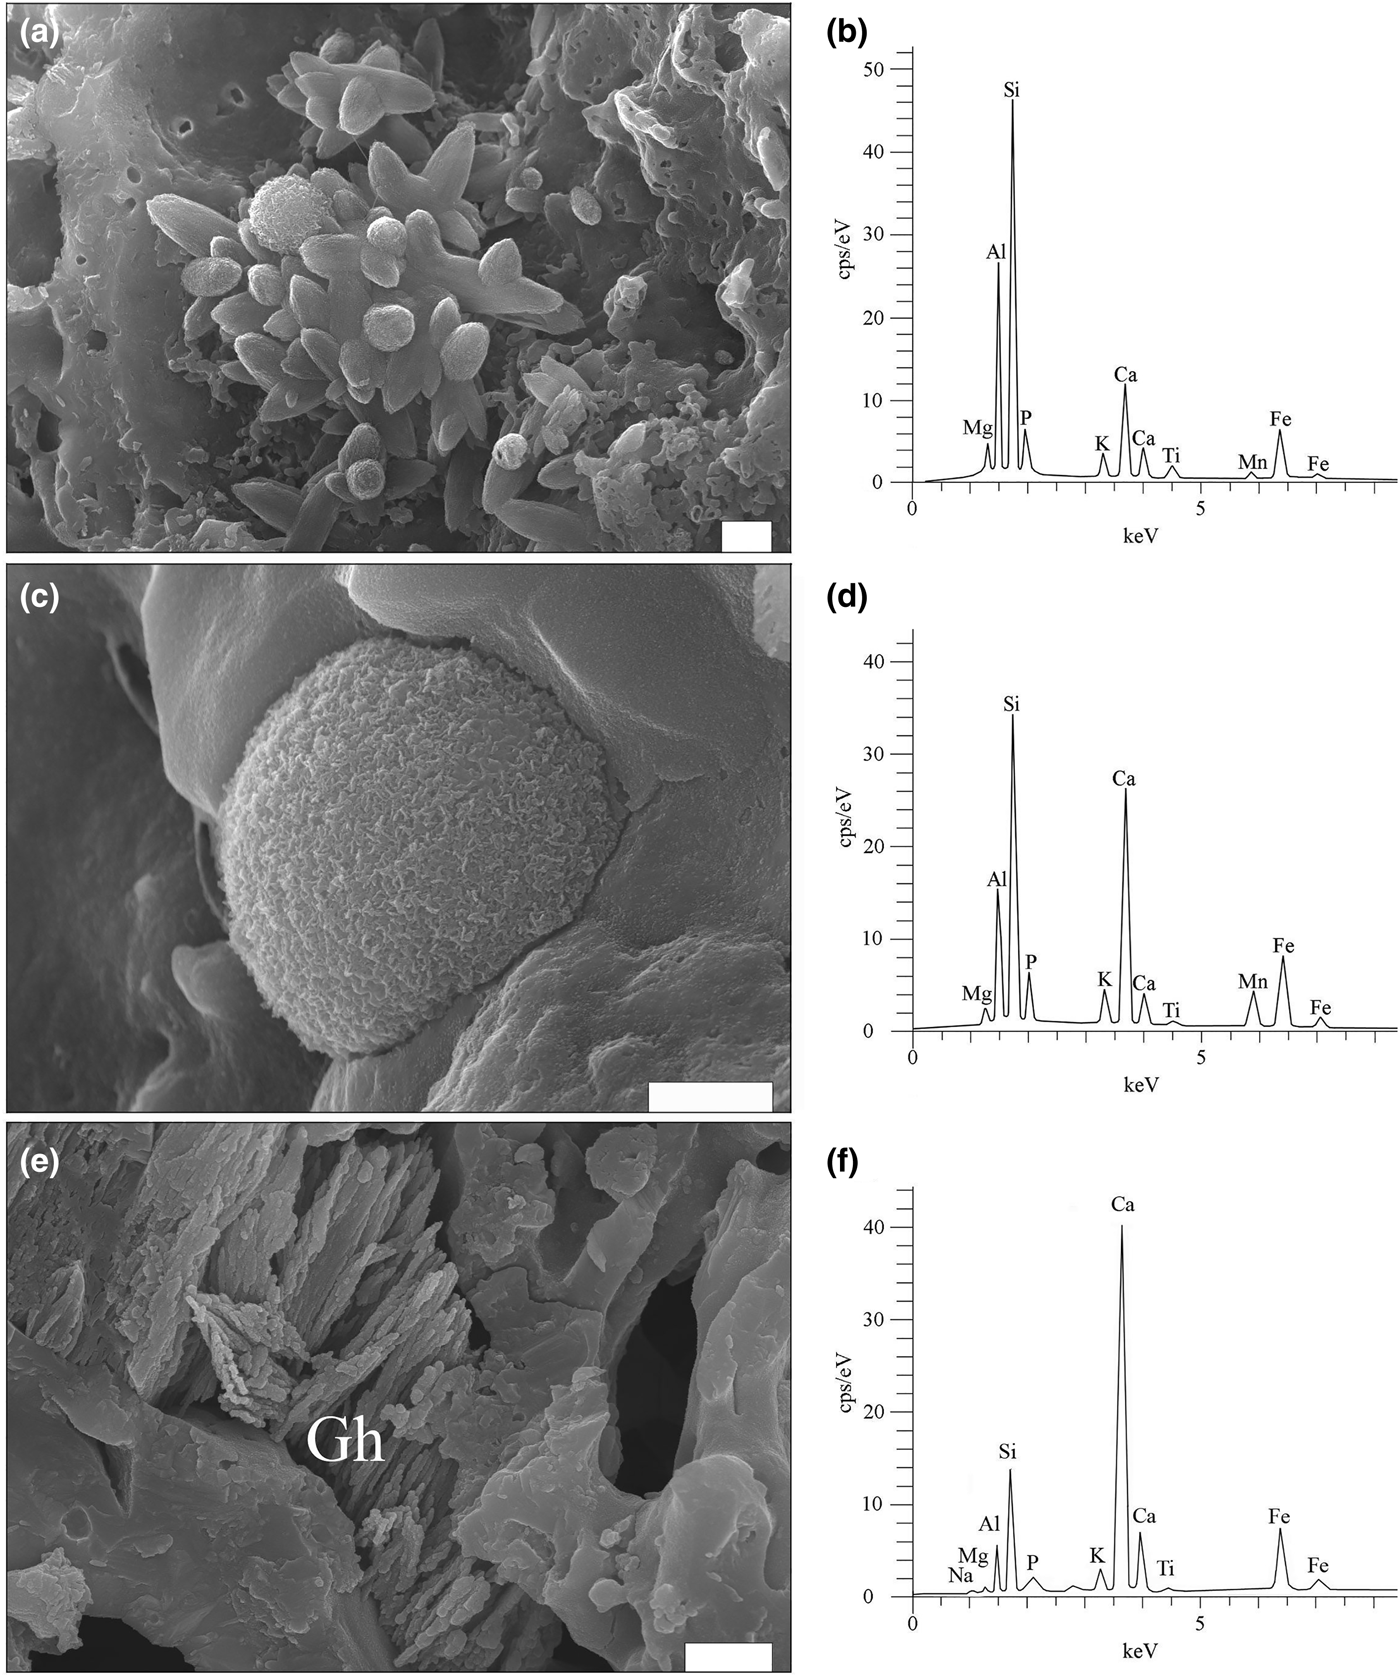
Fig. 8. SE images and EDX spectra for firing phases. (a) Cluster of ‘ceramic melilite’ crystals and scattered microspheres in sample SfM-11. (b) EDX spectrum of ‘ceramic melilite’ crystals. (c) A microsphere with a wrinkled surface, formed on the inner wall of a foraminifera test in SfM-11. (d) EDX spectrum of the microsphere. (e) Dendritic crystals of Fe-gehlenite (Gh) in SfM-24. (f) EDX spectrum of Fe-gehlenite. Scale bar is 1 µm.
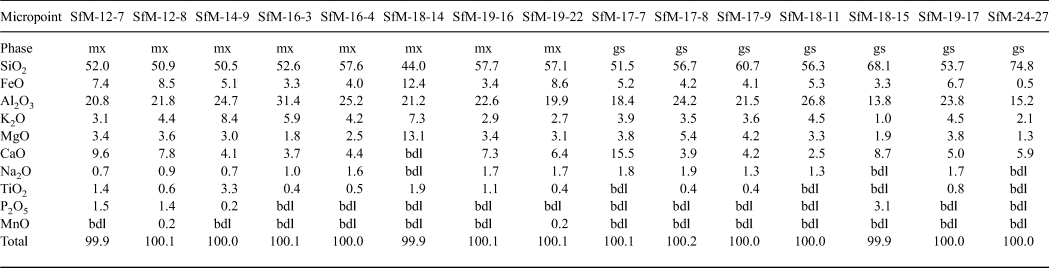
The chemical composition of the matrix is similar for all sherds analysed (Table 3), regardless of whether their matrix microstructures are microcrystalline or amorphous. The sintered and the vitrified matrices consist of a similar Si–Al material, with abundant Fe, Ca and K in various proportions. The SiO2 displays a wide range of concentrations, from 44 to 75 wt.%, being greater in the glass (~60 wt.% on average) than in the sintered matrix (~53 wt.% on average). The Al2O3 – the second most abundant chemical compound – generally exceeds 20 wt.% and has similar content levels in the sintered matrix (23 wt.% on average) and glass (~21 wt.% on average). K2O (3–8 wt.%) and FeO (3–12 wt.%) are important components of the matrix, being more abundant in the sintered matrix than the glass and indicating a mainly Fe-rich illitic to muscovitic groundmass. The CaO content (6.0–6.5 wt.%) is similar in the sintered matrix and the glass. The X-ray mapping (not shown) reveals that both Ca and Fe are finely but inhomogeneously dispersed within the mass of clay minerals, probably forming a primary physical mixture of calcite and Fe oxide on one side, with the illitic mass on the other side. Even in the same sherds, there is Ca-rich matrix and Ca-poor or Ca-free matrix (e.g. Fig. 7c,d). Some of the CaO and Na2O might originate from decomposition of some of the smectite present in the raw clay material. The P2O5 content of the sintered matrix is in the normal range for clays (~1–2 wt.%). With one exception (SfM-18), the glass is free of phosphorous.
Table 3. Chemical composition (wt.%) of sintered matrix (mx) and glass (gs) resulting from SEM-EDX.

FeTOT as FeO.
bdl = below detection limit.
In the voids formed by the decomposition of the carbonate aggregates and calcareous fossils (i.e. foraminifera tests), there are various fine-grained high-temperature phases, as well as calcite crystals (Fig. 7c), the latter probably being formed by recarbonation. Four peculiar high-temperature phases were identified (Figs 8a–f, 9a–d): (1) elongate crystals, (2) microspheres, (3) dendritic crystals and (4) anhedral grains.
The elongate crystals, 1–5 µm long, resemble bipyramids/scalenohedrons (Fig. 8a) and occur in samples with an isotropic matrix (e.g. SfM-11) and in smaller amounts in the sherds with an anisotropic matrix (e.g. SfM-6). They have a composition (Table 4, Fig. 8b) close to that of ‘ceramic melilite’, a solid solution between gehlenite, åkermanite and ferri-gehlenite, containing 29–42 wt.% SiO2, 3.7–10.0 wt.% Fe2O3, 10–19 wt.% Al2O3, 2.5–7.2 wt.% MgO and 32–42 wt.% CaO (Dondi et al., Reference Dondi, Ercolani, Fabbri and Marsigli1999).
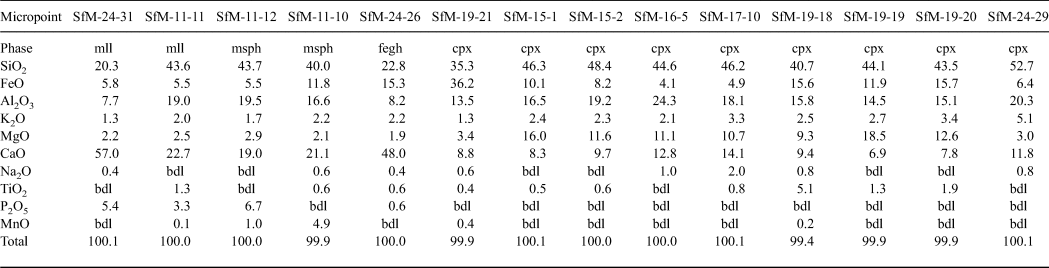
Table 4. Chemical composition of firing phases in ceramics resulting from SEM-EDX (wt.%).
FeTOT as FeO.
mll = ‘ceramic melilite’; msph = microsphere; fegh = Fe-gehlenite; bdl = below detection limit.
The microspheres, 0.5–5.0 µm in diameter, are present in the sherds with a mostly isotropic matrix (SfM-11, SfM-17 and SfM-24), as well as in SfM-6, which shows an anisotropic matrix. Usually, the microspheres occur in the glassy areas (Fig. 8c) or associated with ‘ceramic melilite’ crystals (Fig. 8a). The wrinkled surface (Fig. 8c) is similar to that of the glass (Fig. 7g,h), and the cracks may be due to shrinking during cooling. In some cases, several microspheres may coalesce. Their composition is highly variable and ranges from a Si–Ca–Al–Fe material to a Si–Al–Ca–Fe–Mn material (Table 4, Fig. 8d). Some microspheres show a composition close to that of ‘ceramic melilite’ crystals (compare points SfM-11-12 and SfM-11-11 in Table 4) or to that of sintered matrix (compare point SfM-11-10 in Table 4 with SfM-18-14 in Table 3). These microspheres probably have no crystalline structure and represent droplets of melt solidified upon fast cooling. The variable but high P2O5 content (up to >6 wt.%) might originate from the clayey raw material.
The rod-shaped dendrite-like crystals, a few micrometres long and ~50–100 nm thick (Fig. 8e), occur in samples with an isotropic matrix (e.g. SfM-11, SfM-18 and SfM-24) and in a sample (SfM-8) with a mixed matrix. They belong to Fe-gehlenite (Tables 3, 4, Fig. 8f).
The anhedral grains (Fig. 9a–d) are <0.5 µm in size and are almost isometric, but without defined crystallographic forms. They usually occur as clusters filling in the voids of the foraminifera tests or replacing decomposed carbonate aggregates (e.g. SfM-11, SfM-15, SfM-19 and SfM-24) and belong to clinopyroxene (Table 4). With ~35 wt.% SiO2, ~36 wt.% FeO, ~13 wt.% Al2O3 and ~9 wt.% CaO, they are close to a fassaite–esseneite composition (Table 4), assuming Fe as Fe3+, which is in agreement with the oxidizing conditions of firing. The K2O present in all analysed points may result from contamination from the illitic-muscovitic matrix.

Fig. 9. SE images and EDX spectra showing the large variability of clinopyroxene composition. (a) Cluster of clinopyroxene grains in sample SfM-15 (for composition, see point SfM-15-2 in Table 4). (b) EDX spectrum of clinopyroxene. (c) Cluster of clinopyroxene grains in SfM-19 (for composition, see point SfM-19-21 in Table 4). (d) EDX spectrum of clinopyroxene. The white rectangles in (a) and (c) mark the surfaces where the spectra were collected. Scale bar is 1 µm.
DISCUSSION
Raw materials and their provenance
Finding the geological sources of the raw materials used to produce pottery is a highly demanding task for several reasons, the most significant being the variability of the raw materials (mixing, processing and refinement), reactions during firing and burial alteration. Mineralogy and petrography are important in determining the raw material composition and the geological sources of the mineral and rock fragments in the pottery (Velde & Druc, Reference Velde and Druc1999; Hunt, Reference Hunt2012).
The geology of the surroundings of Cluj-Napoca includes marl and clay levels of various ages within the Cenozoic sedimentary pile of the Transylvanian Basin (Mészáros & Clichici, Reference Mészáros and Clichici1988). The Roman pottery is an exceptional case in which microfossils play a crucial role in identifying the raw material. The foraminifera taxa identified in the ceramic thin sections (Figs 3b, 4a,b) are indicative of the Lower Badenian (Middle Miocene). Lower Badenian marly deposits crop out north of the Someș River (Fig. 1b) (Mészáros et al., Reference Mészáros, Petrescu, Mârza and Mârza1991) and were found beneath the soil south of the Someș River (Mészáros & Clichici, Reference Mészáros and Clichici1988). They are marly clays, consisting mainly of illite, muscovite, some quartz grains and significant amounts of carbonate (Figs 3e, 5). Thin layers of Ca-free and Ca-poor clays are frequent. The Lower Badenian rocks contain the same foraminifera taxa as the Roman sherds. Several shallow boreholes drilled close to St Michael's Church and immediately south of the Someș River crossed Lower Badenian clays and marls. Surface excavations south of the Mill Channel also opened similar marly deposits at a shallow depth (Mészáros & Clichici, Reference Mészáros and Clichici1988). In Roman times, it is possible that there were Badenian exposures in the Someș riverbed, but, at present, they are buried beneath alluvial sediments and rubble, as well as mediaeval and modern buildings.
Only the ceramic pastes for the SfM-22 and SfM-23 sherds (Fig. 2) show scarce larger aplastic clasts, mainly metamorphics, which might originate from the raw clayey material. Alternatively, the Someș alluvial sands might have been added as temper, as was shown by the match between the clasts in the sherds and the petrographic diversity of the river catchment area. In any case, the aplastic material would be the same, because it originates largely from the Apuseni Mountains, even as early as the Badenian. Crushed pieces of older ceramics are an exception and were probably included in the ceramic paste accidentally.
Firing technology constraints
The main indicators for inferring the temperature of firing are the microstructural changes of the primary phases (clay minerals, micas, carbonates) on the one hand and the type of newly formed phases upon firing on the other. For example, an illitic-muscovitic matrix is anisotropic at 850°C and becomes widely isotropic at ~900°C, with increased vitrification. Not all illite and muscovite are destroyed at 900°C, so the loss of OH– continues above this temperature (Maggetti, Reference Maggetti, Olin and Franklin1982; Riccardi et al., Reference Riccardi, Messiga and Duminuco1999; Cultrone et al., Reference Cultrone, Rodriguez-Navarro, Sebastian, Cazalla and De la Torre2001). Neoformed feldspar appears at least at 900°C (Kacim & Hajjaji, Reference Kacim and Hajjaji2003). The products of calcite decomposition and their relationship with quartz and the illitic groundmass are also important in assessing the firing temperature. Fine-grained calcite may begin to decompose at <800°C, but micritic limestone clasts show a weak decomposition process, even at 900°C. Reaction products such as melilite-gehlenite (De Bonis et al., Reference De Bonis, Cultrone, Grifa, Langella and Morra2014) and clinopyroxene (Rathossi & Pontikes, Reference Rathossi and Pontikes2010) occur at ~850°C and may persist until 900–950°C (Fabbri et al., Reference Fabbri, Gualtieri and Shoval2014). The XRPD provides important information on not only the composition, but also the thermal behaviour of clay minerals. In this respect, the 1.0 and 0.5 nm diffraction maxima of illite disappear at >900°C, and other mica peaks disappear at >1000°C. The broadening of the dominant FTIR signal centred at 1060 cm–1, and in particular its shifting towards higher wavelengths, indicates higher firing temperatures (Shoval, Reference Shoval and Hunt2017).
The Roman sherds from Napoca display an Fe- and Ca-rich illite-like matrix and various clasts. These compounds show several characteristics that support the inference of a certain technology, particularly the firing temperature. In some specimens, the anisotropic matrix (Fig. 3a), the sintering process (Fig. 7a), the clearly visible 1.00, 0.50 and 0.45 nm illite-muscovite diffraction peaks (Fig. 5) and the presence of Fe-gehlenite (SfM-8) indicate a firing temperature of at least 850°C. Gradually, the sintered areas expand, the amount of glass increases and the matrix becomes more isotropic (Fig. 3b,c). In parallel, the intensities of the 0.5 nm and in particular the 1.0 nm diffraction peaks of illite-muscovite diminish (Fig. 5). Finally, some sherds exhibit specific features of ceramics fired at higher temperatures (>900°C), among which the most conspicuous are: (1) the matrix turning into an isotropic, dark mass due to collapse of the clay mineral structures (Fig. 3d); (2) the prevalence of a melt/glassy phase (Fig. 8a,c); and (3) the formation of clinopyroxene and ‘ceramic melilite’ (Fig. 8a), Fe-gehlenite (Fig. 8e), clinopyroxene (Fig. 9a,c) and anorthite-rich plagioclase (Fig. 5).
The CFE-SEM enabled the observation of phases ~10 nm in size and the determination of their chemistry on a ~100 nm2 area. The composition of newly formed phases is different from that of geological samples (Deer et al., Reference Deer, Howie and Zussman1992), suggesting that firing time was too short to attain equilibrium. The firing phases show contamination with K2O (Table 4), probably originating from the surrounding illitic-like matrix.
One unusual aspect of the samples studied is the presence of calcite formed by recarbonation, sometimes together with neoformed phases such as Fe-gehlenite (Table 2, Fig. 5). Except for those cases where secondary calcite is clearly visible in thin sections or in SE images, it is difficult to accommodate calcite with newly formed Ca silicates. The decomposition of primary calcite into lime was probably followed by recarbonation during cooling at ~500–600°C (Yoffe et al., Reference Yoffe, Nathan, Wolfarth, Cohen and Shoval2002).
Hematite indicates an oxidizing atmosphere in the kiln and forms at 700–750°C (Nodari et al., Reference Nodari, Marcuz, Maritan, Mazzoli and Russo2007), at the expense of Fe-oxyhydroxides originating from the raw clayey material. Towards the end of firing, the oxygen was consumed, the atmosphere in the (closed) kiln became slightly reducing and small amounts of maghemite formed. Hematite gave the reddish hues, whereas maghemite produced the brownish hues (Molera et al., Reference Molera, Pradell and Vendrell-Saz1998). Only three of the sherds have grey hues, which may be due to a reducing atmosphere. The colour of the sherds is due not only to the finely dispersed Fe in the matrix (as shown by X-ray mapping), but also to the incorporation of Fe into the newly formed phases, such as Fe-gehlenite and clinopyroxene (Kreimeyer, Reference Kreimeyer1987; Molera et al., Reference Molera, Pradell and Vendrell-Saz1998).
CONCLUSIONS
The combination of OM, XRD, FTIR spectroscopy, CFE-SEM-EDX and micropalaeontology is a powerful tool in inferring not only the technology of ceramics at the north-eastern border of the Roman Empire in the second century CE, but also the practical skills of the local population in finding nearby raw materials suitable for good-quality ware, including the imitation of well-known and widely sought terra sigillata. The potters found excellent carbonate-rich marly clays that were probably processed so carefully that, despite the high temperature of firing, the foraminifera tests were preserved. The latter clearly prove that Lower Badenian (Middle Miocene) marls served as raw material.
Two lines of evidence enabled an estimation of the firing temperature: (1) the microstructural modification of the illitic-muscovitic matrix; and (2) the formation of new phases. The optical characteristics revealed that, in large parts of the matrix, the crystalline structure was already destroyed and the material became isotropic. To a large extent, the structural OH– groups had already been released from the mineral structure. This process of dehydroxylation requires a temperature from 850°C to >900°C. Further results from the FTIR spectroscopy suggested that the CO3 bands were derived from secondary calcite. Some of the decomposed carbonate reacted with the vitrified groundmass to form Fe-gehlenite, ‘ceramic melilite’ and clinopyroxene at ~850–950°C.
Finally, the CFE-SEM-EDX provided insights into the degree of sintering and vitrification, the thermal alteration of some components and the shape and composition of newly formed phases in Roman household pottery.
ACKNOWLEDGEMENTS
This study was financed by the Excellence Research Program (Romanian Ministry of Education and Ministry of Research) through the UEFISCDI/CNCS project PN-III-P4-ID-PCE-2016-0229. C.I. acknowledges subsidy by the Russian Government to support the “Program of competitive growth of Kazan Federal University.” Dr Alexandru Szakács (Sapientia University, Cluj-Napoca) is thanked for pertinent suggestions and Dr Otis Crandell (Federal University of Paraná, Curitiba) is thanked for carefully checking the language. The comments of two anonymous reviewers contributed significantly contributed to improving the manuscript. V.A.C. thanks Dr Lóránd Silye for advice regarding micropalaeontology. Mrs M. Mereu produced the computer drawings.