


INTRODUCTION
The jumbo flying squid, Dosidicus gigas, is the largest ommastrephid squid and only can be found within the Eastern Pacific Ocean from northern California to southern Chile. Dosidicus gigas support a major fishery off Chile, Peru and the Gulf of California, with combined annual landings of 671–819 thousand t during 2004 to 2007 (FAO, 2009). In the Chilean waters, D. gigas are highly abundant and support one of the most important fisheries with an annual catch of 122,000–300,000 t during 2005 to 2007 (Zúñiga et al., Reference Zúñiga, Cubillos and Ibáñez2008; FAO, 2009).
Many studies were conducted on fishery biology of D. gigas in the Gulf of California and off the Peruvian coast (e.g. Masuda et al., Reference Masuda, Yokawa, Yatsu, Kawahara and Okutani1998; Argüelles et al., Reference Argüelles, Rodhouse, Villegas and Castillo2001; Morales-Bojórquez et al., Reference Morales-Bojórquez, Hernández-Herrera, Nevárez-Martínez, Cisneros-Mata and Guerrero-Escobedo2001; Nigmatullin et al., Reference Nigmatullin, Nesis and Arkhipkin2001). Some of the previous studies also described the fishery biology of D. gigas in offshore and coastal waters of Chile (Rocha & Vega, Reference Rocha and Vega2003; Chong et al., Reference Chong, Oyarzún, Galleguillos, Tarifeño, Sepúlveda and Ibáñez2005; Zúñiga et al., Reference Zúñiga, Cubillos and Ibáñez2008). Rocha & Vega (Reference Rocha and Vega2003) reported that D. gigas were landed year-round, mainly concentrated in waters off central Chile. González & Chong (Reference González and Chong2006) analysed maturation of D. gigas specimens and hypothesized the presence of at least two cohorts of the species to explain differences in the maturation observed between winter and spring. Ibáñez & Cubillos (Reference Ibáñez and Cubillos2007) described spatial and seasonal changes in the size–structure and reproductive activity of D. gigas in waters off central-south Chile (34°–40°S). Zúñiga et al. (Reference Zúñiga, Cubillos and Ibáñez2008) found a seasonal periodicity in the monthly variation of the D. gigas catch along the Chilean coast, and suggested the existence of two reproductive cycles for D. gigas based on the periodicity in the monthly catch of D. gigas along the Chilean coast during the time period from 2002 to 2005. Liu et al. (Reference Liu, Chen, Lu, Chen and Qian2010) described the fishery biology of D. gigas off the Chilean Exclusive Economic Zone (EEZ) waters based on data collected in the three scientific surveys undertaken by the Chinese squid jigger vessels during 2006 to 2008. However, little information was available on the age, growth and population structure of D. gigas in the Chilean EEZ waters.
Discovery of periodically deposited increments in cephalopod statoliths led to a proliferation of age and growth studies in many commercially important species (Jackson, Reference Jackson1994). Because growth increments in squid are only deposited after hatching (Balch et al., Reference Balch, Sirois and Hurley1988), we also can back-calculate their hatching dates and assign the sampled squids into different seasonal spawning groups according to their hatching dates (Laptikhovsky et al., Reference Laptikhovsky, Arkhipkin and Golub1993). The objectives of this study are to employ statolith increment analysis to determine the age and growth of D. gigas off the Chilean EEZ waters and to yield a preliminary estimation of population structure, based on data collected in the three scientific surveys for D. gigas by the Chinese squid jigger vessels during 2006 to 2008 in the waters outside the EEZ of Chilean waters.
MATERIALS AND METHODS
Sampling and ageing
Samples of D. gigas were randomly collected from the three scientific surveys by the Chinese squid jigging vessels in the waters confined by 22°–30°30′S 75°30′–78°W and 37°30′–41°S 78°30′–82°W during January to June 2007 and by 20°–24°30′S 74°30′W–82°W from January to May 2008 (Figure 1). Samples were randomly collected on a monthly basis in the course of three surveys. The samples were frozen on board immediately, and brought back to the laboratory for further processing.

Fig. 1. Sampling localities of Dosidicus gigas off the Exclusive Economic Zone of Chilean waters.
Statoliths of 386 females (206–702 mm (mantle length) ML) and 147 males (232–541 mm ML) were collected. Measurements of ML (mm) were taken to the nearest 1 mm and body weight (BW, g) to 1 g. The statolith of each sample was extracted for age determination. The standard ageing methodology of a statolith was used in this study (Dawe & Natsukari, Reference Dawe, Natsukari, Jereb, Ragonese and Boletzky1991). The number of increments for each statolith was counted independently by two readers. The average was used if the range of counts was within 10% of the mean (Yatsu et al., Reference Yatsu, Midorikawa, Shimada and Uozumi1997). Increments were counted from the nucleus to the edge of the dorsal dome, where increments were most clearly visible. However, it was sometimes necessary to extrapolate from adjacent areas to resolve increment counts in local unclear areas.
Increments observed in a statolith were assumed to be laid down daily, as was confirmed for other squid species of Ommastrephidae (Bigelow, Reference Bigelow1991; Nakamura & Sakurai, Reference Nakamura and Sakurai1991; Uozumi & Ohara, Reference Uozumi and Ohara1993; Yatsu, Reference Yatsu2000). The hatching date was back-calculated from the count of increments and the date of capture.
Data analysis
Based on the distribution of hatching dates, different seasonal spawning groups were defined (Argüelles et al., Reference Argüelles, Rodhouse, Villegas and Castillo2001). We applied and evaluated the following models to quantify the growth patterns of D. gigas for different seasonal spawning groups:
Linear function (Rodhouse & Hatfield, Reference Rodhouse and Hatfield1990):
Exponential function (Bigelow, Reference Bigelow1991; Villanueva, Reference Villanueva1992):
Power function (Jackson, Reference Jackson1994):
Logistic function (Dimmlich & Hoedt, Reference Dimmlich and Hoedt1998):
Von Bertalanffy function (Argüelles et al., Reference Argüelles, Rodhouse, Villegas and Castillo2001):
Gompertz function (Bigelow, Reference Bigelow1991):
where ML t is mantle length (mm) at age t; t is age (day); c, d, K and t 0 are the model parameters to be estimated; ML ∞ is the asymptotic mantle length; and t 0 is a hypothetical age when ML t equals zero.
The Schnute function (Schnute, Reference Schnute1981; Arkhipkin & Roa, Reference Arkhipkin and Roa2005) was also used:
![ML_t = \left[ML_1^b + \lpar ML_2^b - M_1^b\rpar \left({1 - e^{-a \lpar t - t_1\rpar } \over 1 - e^{-a \lpar t_2 - t_1\rpar }} \right)\right]^{1/b}](https://static.cambridge.org/binary/version/id/urn:cambridge.org:id:binary:20151022081941790-0391:S0025315410001438_eqn7.gif?pub-status=live)
where t 1 and t 2 are the youngest and oldest squid sampled, respectively. ML 1 and ML 2 are the estimated mean lengths of t 1 and t 2 days old squid, respectively.
For the above seven growth models, the likelihood and the Akaike information criterion (AIC) of each model were calculated using the following equation:
![L \lpar data /\theta\rpar = \prod_{i = 1}^{n} {1 \over \sqrt{2\pi} \delta} \exp \left[-{\lpar ML_i - f \lpar t\rpar \rpar ^2 \over 2\delta^2} \right]](https://static.cambridge.org/binary/version/id/urn:cambridge.org:id:binary:20151022081941790-0391:S0025315410001438_eqn8.gif?pub-status=live)
where L(data/θ) is the likelihood of observing the data given parameters θ; vector θ denotes parameters to be estimated; MLi and f(t) are the ML values observed and estimated from the growth model, respectively, for the i th sample; n is the number of observations; m is the number of model parameters; and Lmax is the maximum value of L(data/θ). The model which yields the smallest AIC value was selected as the best model.
Instantaneous relative growth rates (IRGRs, % d−1) and absolute growth rate (AGR, mm d−1 or g d−1) were calculated for each 30-day interval for different spawning seasons. The IRGR and AGR were calculated as:
respectively, where S 1 and S 2 were estimated ML or BW values at the beginning (t 1) and end (t 2) of the time interval (Ricker, Reference Ricker1958). The effect of spawning season on growth rates was evaluated through an analysis of covariance (ANCOVA).
RESULTS
Size–structure
The ML and BW of the sampled squid ranged from 206 to 702 mm and 208 to 11,300 g, respectively (Figure 2). For female squids, the average ML and BW reached 378.9 mm and 1840.3 g, respectively, and the squid with ML values ranging from 300 to 500 mm and BW from 1000 to 2500 g were dominant in the samples, consisting of 84.4% and 67.3% of the total samples, respectively (Figure 2). For male squids, the average ML and BW attained 361.3 mm and 1704.3 g, respectively, and the squid with ML of 300–500 mm and BW of 1000–2000 g consisted of 87.4% and 56.6% of the total sample, respectively (Figure 2).

Fig. 2. A statolith of Dosidicus gigas showing a composition of seven reading frames in increments.
Age, hatching date and spawning population
Three main growth zones (postnuclear, dark and peripheral) were observed in the dorsal dome of D. gigas statolith (Figure 3). Daily growth increments could be seen clearly (Figure 3). Ages of specimens were ranged from 127 to 307 days and most were from 210 to 270 days, consisting of 58.7% of all the samples (Figure 4). The ages of female squids were from 150 to 307 days with the dominant ages ranging from 210 to 270 days, which consisted of 74.35% of all the female samples (Figure 4). While for male squids, ages varied from 127 to 302 days, and the dominant ages were between 240 and 300 days, accounting for 76.87% of all the male samples (Figure 4).

Fig. 3. The distribution of mantel length (ML, mm) (a) and body weight (BW, g) (b) for Dosidicus gigas off the Exclusive Economic Zone of Chilean waters.

Fig. 4. The age distribution of Dosidicus gigas off the Exclusive Economic Zone of Chilean waters.
All the squids sampled in this study were hatched during January to December 2008 (Figure 5A), suggesting that the squid spawned almost throughout the year. The peak hatching dates were from August to November (austral spring), consisting of 52.91% of all the samples. The second hatching dates were from March to June (austral fall), which consisted of 30.77% of the sampled squids (Figure 5A). This suggests that there were two dominant groups for D. gigas off the Chilean EEZ waters: the austral spring spawning group and austral autumn spawning group (Figure 5A).

Fig. 5. The distribution of back-calculated hatching dates (a), estimated growths of mantel length (ML) (b), and body weight (BW) (c) of Dosidicus gigas off the Exclusive Economic Zone of Chilean waters.
Growth models
The best age–ML models and age–BW models for both the spawning groups identified based on the AIC were:
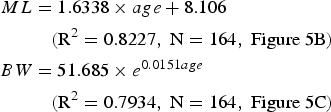
for the spring spawning group (Fig. 5B and 5C); and
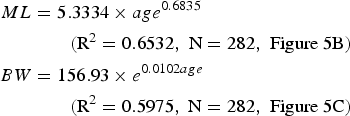
for the autumn spawning group (Figure 5B, C).
Growth patterns
The average IRGRs (P = 0.8653) and AGRs (P = 0.8094) did not differ significantly between the two spawning groups. The ANCOVA revealed no significant differences for IRGRs (P = 0.8119) and AGRs (P = 0.6269) between the two spawning groups for BW.
The IRGR and AGR varied with sizes of squid. Taking the spring spawning group as an example, the IRGR and AGR of ML reached the highest with the values of 0.72 and 2.25 at ages of 181 to 210 days, respectively (Table 1), and the IRGR of BW also reached the peak (2.63%) at ages of 211 to 240 days while the highest AGR of BW (40.59 mm per day) was at ages of 241 to 270 days (Table 1).
Table 1. Instantaneous relative growth rates (IRGRs) and absolute growth rate (AGR) for mantle length (ML) and body weight (BW) of the austral spring spawning group and austral autumn spawning group of Dosidicus gigas off the Exclusive Economic Zone of Chilean waters.

DISCUSSION
Hatching dates of specimens based on capture dates and ages were estimated in this study suggesting that D. gigas might spawn throughout the year. Based on the distribution of hatching dates (Figure 5A), two modes for different spawning groups could be identified, one in August to November and the other from March to June. This is consistent with the conclusion identified in Zúñiga et al. (Reference Zúñiga, Cubillos and Ibáñez2008) who suggested that there were two cohorts per year off Chile based on the seasonal pattern of monthly catch. Clarke & Paliza (Reference Clarke and Paliza2000) reported the existence of the two spawning periods within a year for D. gigas in the southern hemisphere, one of the peaks occurring in austral autumn (April–May) and the other in austral spring (October–November). González & Chong (Reference González and Chong2006) also suggested the presence of at least two cohorts of D. gigas based on the differences in the maturation of specimens observed between winter and spring. But Liu et al. (Reference Liu, Chen, Lu, Chen and Qian2010) reported that D. gigas might spawn all year around with a peak spawning time from November to next January in the waters of 20°−24°30′S and 74° 30′−82°W. The population structure of D. gigas in the eastern Pacific Ocean is complicated. In general, three groups of D. gigas were identified with different ML values at maturity (Nigmatullin et al., Reference Nigmatullin, Nesis and Arkhipkin2001). In the Gulf of California, the cohort analysis revealed five cohorts with different hatching times (Ehrhardt et al., Reference Ehrhardt, Jacpuemin, García, Gonzáles, López, Ortiz and Solís1983). Morales-Bojórquez et al. (Reference Morales-Bojórquez, Hernández-Herrera, Nevárez-Martínez, Cisneros-Mata and Guerrero-Escobedo2001) estimated catchability-at-length for D. gigas and suggested the existence of three different cohorts off the coast of Guaymas (Sonora, Mexico). In Peruvian waters, Tafur et al. (Reference Tafur, Villegas, Rabi and Yamashiro2001) reported there were two main spawning peaks, but mature individuals were observed throughout the year. Argüelles et al. (Reference Argüelles, Rodhouse, Villegas and Castillo2001) revealed the presence of two cohorts estimated by the date of hatching, one hatched in autumn/winter and recruited to the fishery in spring/summer and the other hatched in spring/summer and recruited to the fishery in autumn/winter. Clearly, the results derived in this study are similar to those of other studies conducted in different geographical areas and different time periods, suggesting the existence of multiple cohorts in a given year for D. gigas over the range of their distribution.
Statolith ageing in this study generally confirmed high growth rates of D. gigas. Dosidicus gigas can attain large sizes in less than 1 year. The oldest mature squid was found in this study to be 307 days old, with its size reaching 495 mm ML and body weight of 3300 g. The smallest immature squid was 127 days old with a size of 234 mm ML and body weight of 412 g. We conclude that the life span of D. gigas is likely to be about one year off the EEZ of Chilean waters, which generally conforms to the Ommastrephidae squid life history (Arkhipkin, Reference Arkhipkin2004). Although some large specimens (>750 mm ML) of the large sized group were found to live for longer than one year (up to 1.5–2.0 years; Nigmatullin et al., Reference Nigmatullin, Nesis and Arkhipkin2001; Markaida et al., Reference Markaida, Quiñónez-Velázquez and Sosa-Nishizaki2004), we did not find such individuals in this study.
Squid of each cohort tended to follow different growth models (Nigmatullin et al., Reference Nigmatullin, Nesis and Arkhipkin2001). The logistic model best described growth (BW–age and ML–age) for D. gigas in the Gulf of California (Markaida et al., Reference Markaida, Quiñónez-Velázquez and Sosa-Nishizaki2004), and an exponential model for age–ML of D. gigas was fitted for each maturity stage and hatching season by size-group in Peruvian waters (Argüelles et al., Reference Argüelles, Rodhouse, Villegas and Castillo2001). Growth in adult phases for D. gigas could be approximated by linear functions (Arkhipkin & Murzov, Reference Arkhipkin, Murzov and Ivanov1987; Masuda et al., Reference Masuda, Yokawa, Yatsu, Kawahara and Okutani1998). In the absence of larval and juvenile squid of this study, seven growth models including logistic model and exponential model were evaluated, and we found that the ML–age relationships were best described by a linear function and a power function, respectively, for the austral spring and autumn spawning groups; while the BW–age relationships of the two groups were both best described by exponential functions. However, we should note that the models identified might not be suitable to describe the growth of larval and juvenile squid because they were not included in the sample of this study.
Dosidicus gigas hatched in different seasons were found to have different growth rates off the EEZ of Chilean waters, however such differences were not significant between the two spawning groups (P > 0.05). The IRGR and ARG of ML for the austral spring spawning group tended to be higher than those of the austral autumn spawning group before the age of 240 days, and for the age of 211–270 days squid the IRGR and ARG of BW for the austral spring spawning group were obviously greater than those of the austral autumn spawning group (Table 1). In the Peruvian waters, the IRGR of D. gigas ranged between 0.61 (austral summer) and 0.76 mm d−1 (austral winter) for small squids, while larger squids had lower growth rates of 0.23 (austral summer) to 0.29 mm d−1 (austral spring; Argüelles et al., Reference Argüelles, Rodhouse, Villegas and Castillo2001). In the Gulf of California, the ARG of D. gigas can attain over 2 mm d−1 for more than 5 months, and no differences in growth were noted between the groups hatched in different seasons (Markaida et al., Reference Markaida, Quiñónez-Velázquez and Sosa-Nishizaki2004). This suggests large spatial and temporal variability in growth for D. gigas, possibly responding to environmental gradients.
We found that the growth rate of D. gigas might be high at young ages, and decreased after they reached sub-adult stages (age >180 days for the spring and autumn spawning groups; Table 1). The maximum ARG and IRGR of ML for the austral spring and autumn spawning groups were reached at 181–210 days old, and the maximum ARG of BW ranged from 211 to 240 and from181 to 210 days old, respectively, for the austral spring and autumn spawning groups (Table 1). In the Gulf of California, the ARG values of ML for the female (2.65 mm.d−1) and male (2.44 mm.d−1) D. gigas were reached at 230–250 and 210–230 days old respectively, and the maximum ARG of BW for females was 104 g.d−1 at 350 days old and for males 72 g.d−1 at 310 days old. Argüelles et al. (Reference Argüelles, Rodhouse, Villegas and Castillo2001) reported that the IGRG of D. gigas ranged between 0.48 (maturing) and 0.58 (mature) for small squid, while the larger sized squid ranged between 0.08 (maturing) and 0.10 (mature) in the Peruvian waters.
Growth was found to be different between female and male D. gigas (Markaida et al., Reference Markaida, Quiñónez-Velázquez and Sosa-Nishizaki2004). Although we did find differences in growth rates between sexes, we were not be able to conduct a statistical test to evaluate temporal and spatial differences in growth between female and male D. gigas because of small sample sizes when we divided sex-specific samples into different sampling time and spawning groups. We are planning to collect more samples in future to evaluate temporal and spatial differences in growth between female and male D. gigas with respect to environmental variability.
In summary, we conclude that D. gigas distributed off the EEZ of Chilean waters varied between 206 to 702 mm ML in size. The age of D. gigas estimated by counting daily growth increments in statoliths did not exceed one year old. At least two spawning groups were identified, the main spawning peak tends to occur between August and November, the secondary peak appears during March to June, but the hatching period was extended throughout the year. The best growth models differed between the two groups, but growth rates did not differ significantly between the two spawning groups. Population structure, age and growth of D. gigas identified in this study off the EEZ of Chilean waters seemed to be inconsistent with those in the eastern Pacific Ocean, suggesting large spatial variability in the key life history parameters for D. gigas. We suggest more extensive sampling of data with finer spatial and temporal scales and collaboration among different countries or regions to improve our understanding of spatial and temporal variability in the fishery biology of D. gigas.
ACKNOWLEDGEMENTS
The support of the three scientific surveys made by New Century No. 52, Xin Jieli No. 8 and Zhe Yunyu No. 807 are gratefully acknowledged. We would like to thank three anonymous referees whose comments have greatly improved the manuscript. This work was funded by the National Nature Science Foundation (NSFC40876090), ‘Shu Guang’ project (08GG14) from Shanghai Municipal Education Commission, Specialized Research Fund for the Doctoral Program of Higher Education (20093104110002) and Shanghai Leading Academic Discipline Project (Project S30702). Y. Chen's involvement in the project was supported by the Shanghai Dongfeng Scholar Program.


