


INTRODUCTION
Traditional photography relies on silver halide as the image capture component, and after exposure to light, the latent image is developed using wet chemical processing. The advent of digital imaging has resulted in a move away from conventional photographic technology. Today, thermally developed silver-based dry imaging materials are used for image output in many commercial digital products including microfilm, medical diagnostic, thermal printing, and graphic arts media. The silver source for image formation is typically a reducible silver carboxylate (Sahyun Reference Sahyun2009). Currently, the two technologies primarily used for dry-silver image generation are thermographic, TG, where image generation requires a thermal processing step (the thermally developed silver media is developed using heated rollers), or photothermographic, PTG, where the image is generated by exposure to light followed by a thermal processing step. Films of TG and PTG products are typically composed of several chemical components dispersed in a binder and coated on a poly(ethylene terephthalate), PET, polymer base. Extensive reviews of TG and PTG, materials and processes have been published by Klosterboer (Reference Klosterboer, Sturge, Walworth and Shepp1989), Cowdery-Corvan and Whitcomb (Reference Cowdery-Corvan, Whitcomb and Diamond2002), and Strijckers (Reference Strijckers2003).
The solid-state structures of many silver carboxylates have been published in the last 20 years, which has established the trend of these complexes to be commonly comprised of dimeric, 8-membered ring systems (Jaber et al., Reference Jaber, Charbonnier, Petit-Ramel and Faure1996; Smith et al., Reference Smith, Sagatys, Dahlgren, Lynch, Bott, Byriel and Kennard1995; Mehrotra and Bohra, Reference Mehrotra and Bohra1983; Chen and Mak, Reference Chen and Mak1991a; Chen and Mak, Reference Chen and Mak1991b; Olson et al., Reference Olson, Whitcomb, Rajeswaran and Stwertka2006; Whitcomb and Rajeswaran, Reference Whitcomb and Rajeswaran2003; Whitcomb and Rajeswaran, Reference Whitcomb and Rajeswaran2006) schematically illustrated in Figure 1 (Wu and Mak, Reference Wu and Mak1995). The driving forces for this basic building block seem to be the inherent bridging nature of the carboxylate ligand along with the propensity of the silver to achieve four coordinate status. The latter is the result of the primary two carboxylate linkages, together with interdimer Ag-O bonding and a short Ag-Ag separation (2.7–3.0 Å) consistent with silver–silver bonding found in metallic silver (2.889 Å).
While academic interest in silver carboxylates focuses on shorter chain and smaller substituents associated with the carboxylate ligand, n-fatty acid long chain carboxylates have been found to be in substantial demand as the source for silver ions in TG and PTG imaging materials (Klosterboer, Reference Klosterboer, Sturge, Walworth and Shepp1989; Cowdery-Corvan and Whitcomb, Reference Cowdery-Corvan, Whitcomb and Diamond2002; Blanton et al., Reference Blanton, Lelental, Zdzieszynski and Misture2002; Blanton et al., Reference Blanton, Zdzieszynski, Nicholas and Misture2005; Blanton et al., Reference Blanton, Whitcomb and Misture2007; Bokhonov et al., Reference Bokhonov, Burleva, Usanov and Whitcomb2001; Bokhonov et al., Reference Bokhonov, Burleva, Sidelnikov, Sharafutdinov, Tolochko and Whitcomb2003; Bokhonov et al., Reference Bokhonov, Sharafutdinov, Tolochko, Burleva and Whitcomb2005). In these materials, which have enjoyed significant commercial success, the silver ion is reduced to metallic silver
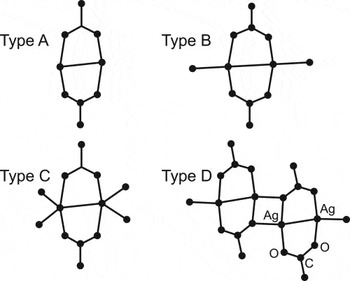
Figure 1. Schematic of Type A-D dimer structures of silver carboxylates.
nanoparticles that absorb sufficient visible light such that they are suitable as the viewable image. The long chain component of the silver carboxylate, normally containing 16–20 methylene units, contributes to the physical properties that make these silver complexes far more suitable for this application than other silver carboxylate complexes.
The first attempt to obtain crystallographic data on silver compounds of n-fatty acids consisted of powder X-ray diffraction (XRD) patterns for a series of compounds [AgO2C(CH2)nCH3]2, n = 4, 6, …, 16 (Vand et al., Reference Vand, Aitken and Campbell1949). While Vand and coworkers did not actually index any of the powder patterns obtained, based on the d-spacings of strong diffraction peaks vs. n, they inferred triclinic cells with lattice parameters ranging along the series: a = 4.588–4.693 Å, b = 4.016–4.120 Å, c = 20.41–50.35 Å, α = 101.20–104.58°, β = 102.47–93.98°, γ = 80.07–76.02° (reduced unit cells along the series: a = 3.981–4.115 Å, b = 4.547–4.688 Å, c = 19.690–48.748 Å, α = 101.20–104.58°, β = 102.47–93.98°, γ = 80.07–76.02°). They suggested a packing motif based on these cell dimensions and the interchain distances known from paraffin and other hydrocarbons but were unable to give any details of the Ag-carboxyl bonding. At the time of that work, it was thought that silver carboxylate is an ionic salt; however, it is now well established that the silver in these compounds is covalently bonded (Cowdery-Corvan and Whitcomb, Reference Cowdery-Corvan, Whitcomb and Diamond2002).
The next direct work on the atomic structure of silver alkanoates came from EXAFS measurements of silver stearate (n = 16) (Tolochko et al., Reference Bokhonov, Sharafutdinov, Tolochko, Burleva and Whitcomb1998). In that work, the experimental observations were distances between silver atoms and their neighbors. Assuming the Ag-carboxyl conformation consisted of a dimer with the same planar 8-membered ring as described above, the authors deduced lattice parameters (reduced cell) a = 4.11 Å, b = 4.68 Å, c = 48.74 Å, α = 92.13°, β = 90.33°, γ = 83.49°. While the agreement with the X-ray spectroscopic data was satisfactory, it cannot be regarded as a determination of the unit cell parameters. In addition, such a measurement is not sensitive to any of the atom positions beyond a few angstroms away from the Ag atom. A recent series of powder X-ray diffraction measurements of a series of silver alkanoates with n = 3–24, 26, 28 echoes the previous model of discrete silver carboxylate dimers stacked in bilayers (Binnemans et al., Reference Binnemans, Van Deun, Thijs, Vanwelkenhuysen and Geuens2004). The X-ray measurements were only of interlayer d-spacing as a function of chain length n. The authors assumed that the alkyl chains extend perpendicular to the plane of the silver (i.e., along c*) and claim good agreement with this model.
Current TG and PTG technology uses silver behenate, AgBeh, [Ag(O2C(CH2)20CH3]2, as the primary silver ion source for thermally developed silver imaging (Cowdery-Corvan and Whitcomb, Reference Cowdery-Corvan, Whitcomb and Diamond2002). AgBeh has also been proposed as a low-angle calibration standard for powder XRD (Huang et al., Reference Huang, Toraya, Blanton and Wu1993) and neutron diffraction (Giles and Wiedenmann, Reference Gilles and Wiedenmann1998) instruments, in as much as it presents a series of generally strong, cleanly separated diffraction peaks (Figure 2) with a d(001) spacing of 58.376 ± 0.006 Å measured in several laboratories (Blanton et al., Reference Blanton, Huang, Hubbard, Robie, Louer, Gobel, Will, Gilles and Raftery1995). The diffraction peaks are equally spaced (in sinθ) and can be used to not only calibrate a diffractometer but also to diagnose instrument aberrations. These applications of AgBeh are especially important as powder diffraction methods advance in the direction of analyzing materials with larger unit cells. Consequently, improved understanding of the solid-state structure of AgBeh and how it relates to its physical and chemical properties remains of interest.
Single-crystal XRD analysis of AgBeh would be the desired approach for structure elucidation. However, the inability to grow an AgBeh single crystal with adequate size and quality has prevented the use of this technique. Particles of AgBeh are typically plates or needles on the order of 1–2 μm in length and 0.1 μm in thickness (Huang et al., Reference Huang, Toraya, Blanton and Wu1993). Though powder XRD patterns show AgBeh to be crystalline, the powder diffraction peaks have proved to be too broad to enable the pattern to be indexed, even when collected at a high-resolution synchrotron beamline. In this study, we have successfully been able to recrystallize AgBeh, producing larger particles that combined with a high-resolution diffractometer and synchrotron radiation has allowed for the first time the determination of the crystal structure of silver behenate.
EXPERIMENTAL
Sample preparation
Silver behenate preparation has been previously described in the patent literature (Bryan, Reference Bryan1969; Simons, Reference Simons1974; Penfound, Reference Penfound1984). For this study, behenic acid was
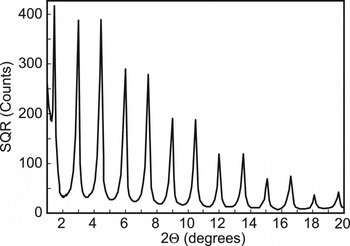
Figure 2. Low-angle powder X-ray diffraction pattern for AgBeh showing (00l) diffraction peaks. Bragg-Brentano diffractometer, Cu Kα radiation.
dispersed in water at a few percent concentration and then heated to approximately 85 °C. An equivalent amount of sodium hydroxide in water was added to make sodium behenate. The temperature was dropped to 50–55 °C followed by addition of an aqueous solution of silver nitrate. A white precipitate of AgBeh was stirred for one hour, then filtered, and washed two times. The collected solids were air dried until all water evaporated. AgBeh prepared in this manner was comprised of platelets ∼0.1 μm thick and 0.5–1 μm in the plane of the sample. After drying, the AgBeh was recrystallized by slow cooling a hot (∼70–75 °C) filtered solution of 1.0-g AgBeh in 200-mL ethanol:pyridine (10:1 v:v). The resulting particles were also observed to be platelets (Figure 3) with a thickness of ∼1 μm and planar dimension of 20–30 μm. The measured density of recrystallized AgBeh was determined by helium pycnometer and found to be 1.315 Mg/m3.
High-resolution X-ray diffraction data collection
High-resolution powder diffraction data on AgBeh were collected on the SUNY X3B1 beamline at the National Synchrotron Light Source, Brookhaven National Laboratory. The recrystallized AgBeh powder sample was sealed in a 1-mm diameter glass capillary, which was spun about its axis, perpendicular to the direction of the incident beam, during data collection. The direct synchrotron beam was monochromated by a double Si (111) crystal tuned to a wavelength of 1.14985(1) Å. Before the sample, the 2 × 8 mm incident beam was monitored by an ion chamber, and the diffracted signal was normalized for the decay and fluctuations of the primary beam. The diffracted beam was reflected by a Ge (111) analyzer crystal into a NaI scintillation counter, with a pulse height discriminator in the counting chain. Diffraction data were collected at room temperature by counting for 3 s at each 2θ, in steps of 0.005° from 0.75 to 54° (maximum d-spacing of 87.84 Å minimum d-spacing of 1.266 Å). Low-angle peaks, which exhibited a pronounced asymmetry due to axial divergence, had an intrinsic full width at half maximum, FWHM, of ∼0.015°, somewhat broader than the instrument resolution. Estimated standard deviations were taken to be the maximum of the square root of the counts and 1% of the intensity.

Figure 3. Scanning electron micrograph of AgBeh recrystallized in ethanol:pyridine.
Structure determination
Elucidation of the crystal structure from high-resolution powder diffraction data followed a series of steps applied in a systematic approach:
Unit cell indexing utilizing JADE (MDI, 2005), dicvol (Boultif and Louer, Reference Boultif and Louer1991), TREOR (Werner et al., Reference Werner, Eriksson and Westdahl1985), and user evaluation on a zone-by-zone basis
Space group determination based on systematic absences and density considerations
Peak profile fitting for peak position and intensity using Pawley Refinement (Pawley, Reference Pawley1991)
Identify the local structure around Ag using EXAFS
Structure model generation, independently using
Simulated annealing method using TOPAS (Bruker AXS, 2008) and Powder Solve (Engel et al., Reference Engel, Wilke, Konig, Harris and Leusen1999)
Global search algorithm using PSSP (Pagola and Stephens, Reference Pagola and Stephens2010)
Charge flipping method (Coelho, Reference Coelho2007) using TOPAS
Density functional theory method using CASTEP (Clark et al., Reference Clark, Segal, Pickard, Hasnip, Probert, Refson and Payne2005)
Checking and correcting any close atom contacts
Final structure refinement using the Rietveld method (Rietveld, Reference Rietveld1967)
The powder X-ray diffraction pattern calculated from the refined structure was then compared to the synchrotron X-ray diffraction raw data pattern for assessment of correct crystal structure determination.
Extended X-ray absorption fine structure data collection
Extended X-ray absorption fine structure, EXAFS, data were collected at beamline X18 at the National Synchrotron Light Source, Brookhaven National Laboratory. Bulk AgBeh was measured as a pellet (compressed powder) in fluorescence mode. A 13-element, high-purity Ge detector was used to collect the fluorescence signal, providing 13 measurements of the fluorescence per monochromator scan. Eight monochromator scans were made resulting in 13 × 8 independent measurements. All data were merged to provide the final data set for analysis. EXAFS analysis was carried out using the programs ATHENA (Ravel, Reference Ravel2006) and WINXAS (Ressle, Reference Ressle2003). Background fitting was carried out with the highly automated feature of ATHENA using a single-variable fit such that the long wavelength components of the EXAFS signal were removed from the data, thus removing any peaks in the real-space distribution below ∼1 Å. The Fourier transforms were performed using the Kaiser-Bessel window with a sill length of 2 Å−1 over the k range of 2–12 depending on the noise level. Phase shift corrections of ∼0.5 Å were applied to determination of nearest-neighbor distance lengths in AgBeh.
RESULTS AND DISCUSSION
The high-resolution powder diffraction pattern of AgBeh is shown in Figure 4. The first step in structure solution from powder diffraction data is to index the unit cell, i.e., to find a lattice that permits the assignment of Miller

Figure 4. High-resolution powder X-ray diffraction pattern of recrystallized AgBeh collected using 1.14985(1) Å synchrotron radiation. Intensity plotted as square root counts for better visualization of low intensity peaks.
indices (hkl) to each observed peak, within the error of measurement. While, in general, indexing is a routine task using established computer programs if data of the present quality are available, the large disparity between lattice parameters renders it difficult in this case. In particular, the (hk0) zone, which is required to establish the lattice parameters, first appears at the 55th allowed peak, the (110) at 2θ = 18.99°. Many iterations of indexing using previously mentioned programs yielded candidate lattices, but none of them resulted in a profile fit sufficiently better than others to determine the lattice decisively. With such a large number of closely spaced diffraction peaks, the profile fits were highly metastable. Ultimately, we used the following procedure, which is based on the fact that the c axis is much longer than a and b, so that the reciprocal lattice vectors a* and b* are very much longer than c*, and can be chosen to be nearly

Figure 5. Regions of high-resolution X-ray powder diffraction pattern shown in Figure 4, illustrating the use of successive zones to index the pattern (square root intensity).
perpendicular to c*. This approach means that in a powder pattern, each peak (hk0) will be the source of a series of closely spaced peaks extending to higher angles.
The first 12 diffraction peaks can be indexed as (001) to (0012). The first peak that could not be indexed as (00l) at 14.43° [Figure 5(a)], provided an estimate for b*, and the correct assignment of any two peaks in that region sets b* and α*. In the present case, assigning indices (012) to the strong peak at 14.63° allowed for indexing of all peaks below 16.3°. Assignment of a* and β* is less immediately obvious because the (100), (101), and (101) peaks are relatively weak but careful examination of the diffraction pattern in the range of 16–20° [Figure 5(b)] found the indexing to be correct. In order to establish γ*, one has to correctly assign one peak in the (11l) series. All of the (11l) peaks are noticeably broader than the other peaks, which makes for some ambiguity in the assignment (this broadening was modeled in the profile fitting and refinement stages by an extra parameter, adding a Lorentzian strain term to peaks with h and k both nonzero). Finally, the most prevalent peak not assigned in the first two zones turns out to be the (113) at 19.26° [Figure 5(c)]. This assignment was subsequently confirmed by the structure solution. A different assignment of γ* did not lead to an acceptable solution of the crystal structure. At each stage of indexing, TOPAS was used to compute a Pawley fit of the pattern to a lattice containing the established zones, and to fit the positions of the unindexed peaks to predict the reciprocal lattice parameters of the next zone to be included. A final Pawley fit was carried out, establishing a set of intensities and correlation coefficients. Using correlated estimates of intensities is known to be important in handling overlapped peaks in powder diffraction patterns (David et al., Reference David, Shankland and Shankland1998). The unit cell obtained from indexing and used as the starting point in structure determination was triclinic, space group P 1, with a = 4.1757(2) Å, b = 4.7213(2) Å, c = 58.341(1) Å, α = 89.435(3)°, β = 89.613(3)°, γ = 75.846(1)°.
The local structure around the Ag atoms of AgBeh was investigated using EXAFS. The Ag K-edge EXAFS real-space spectrum for AgBeh is shown in Figure 6. There are four prominent peaks at small R located at approximately 1.7, 2.3, 2.6, and 3.6 Å. With phase correction these peaks are 2.3, 2.8, 3.1, and 4.1 Å, respectively. Closer examination reveals that the 1.7, 2.6, and 3.6 Å peaks are comprised of at

Figure 6. Ag K-edge EXAFS real-space spectrum for AgBeh, obtained from the Fourier transform of the wavenumber spectrum (without phase shift correction). Solid line is the simulated spectrum from the final refined structure.
least two poorly resolved peaks due to at least two different atom pairs. The 2.3 and 2.8 Å peaks can be assigned to bond distances present in a planar 8-membered dimer ring comprising two silver atoms bridged by two carboxylates, consistent with results reported by Tolochmo et al. (Reference Tolochko, Chernov, Nikitenko and Whitcomb1998) for silver stearate. The 2.3 Å distance is attributed to the shortest Ag-O distance and 2.8 Å is attributed to the Ag-Ag distance in the ring. The 3.1 Å peak is assigned to a Ag-Ag bond in adjacent dimers, forming four-membered rings comprised of two silver and two oxygen atoms, resulting from interaction between neighboring silver carboxylate eight-membered rings that form a sheet or layered structure. Longer atom pair lengths are for the most part attributed to the distances between layers of AgBeh. The 4.1 Å peak is assigned to a Ag-Ag distance along the a-axis unit-cell length for AgBeh determined in this study. The solid line in Figure 6 is computed from the refined AgBeh structure, discussed below.
Additional conformation data were obtained from the infrared (IR) spectrum of AgBeh (Figure 7). Lee and coworkers have described the IR spectra for silver stearate (Lee et al., Reference Lee, Han, Choi and Kim2002) and based on their work Liu et al. (Reference Liu, Lu, Cao and Zhang2006) provided interpretation of the IR spectra for AgBeh. Assignments to the major IR bands are made based on their studies. The band at 717 cm−1 is the CH2 rocking vibration, the bands at 1421 cm−1 and 1518 cm−1 are assigned to the symmetric and antisymmetric stretching vibrations of the carboxylate group. Note the lack of a strong band at 1700 cm−1, indicating the absence of C=O that would be due to COOH. The single band at 1471 cm−1 suggests AgBeh exists in a triclinic cell with a single type of alkyl chain per subcell. The two bands observed at 2849 cm−1 and 2917 cm−1 are assigned to the symmetric (νs(CH2)d+) and asymmetric (νas(CH2)d−) stretching vibrations of the methylene groups, respectively. The small band width of the 1471 cm−1 and the location of the 2848 cm−1 and 2917 cm−1 bands are indicative of a highly ordered all-trans configuration of the alkyl chains.
Based on the above observations, a preliminary structural model comprising an 8-membered dimer ring with an all-trans aliphatic chain for AgBeh was proposed. In this model, the 8-membered dimer rings in neighboring molecules are connected in a polymeric-like network by four-membered rings of Ag and O, referred to as a Type D

Figure 7. IR spectrum of AgBeh.
(Figure 1) dimer structure for silver (I) carboxylate complexes (Wu and Mak, Reference Wu and Mak1995). This starting model was then used in a global optimization algorithm based on Monte Carlo simulated annealing and Monte Carlo parallel tempering to generate trial structures using REFLEX PLUS software (Accelrys, 2002). Although solutions were obtained, we were unable to obtain any chemically satisfactory structure using this approach. Solutions with reasonable refinement values could be achieved; however, upon review, the chemically reasonable structure of the AgBeh molecule was lost.
An initial attempt at structure solution was performed using the simulated annealing program PSSP to obtain an initial structural model (Pagola and Stephens, Reference Pagola and Stephens2010), which was subsequently refined using TOPAS. The behenate molecule was entered as a z-matrix, with carboxyl torsion and C-C bond length and C-C-C angles refined within specified limits. The carboxyl group was forced to be planar, C-O bond lengths fixed at 1.36 Å, and O-C-C bond angles fixed at 120°. All C-C bond lengths and C-C-C angles were held equal. Hydrogen atoms were tethered to the carbon atoms. In order to test the possibility of disorder along the alkane chains, we tried refinements with thermal parameters increasing linearly along its length, but this did not lead to an improvement of the refinement, nor did any refinement favor twisting of the alkane chain. The structure solution yielded a ring-like structure, as expected; however, one of the Ag-O distances was notably too long, 2.70 Å. Additional attempts using either PSSP or TOPAS to solve the structure using simulated annealing also resulted in refined structures with unreasonable ring geometries. Refining the structures led to either Ag-O distances that are greater than 2.5 Å or short Ag-Ag distances of ∼2.6 Å, which disagree with the EXAFS result.
Attempts at structure solution using the charge flipping method did not produce results with sufficient resolution to begin to construct any molecular fragments. Instead, the large electron density of the Ag atoms was smeared across the dimer ring, with a separation of ∼2.5 to 3 Å. In addition, the Ag or O atoms could not be located with sufficient confidence to continue the analysis.
To some degree, lack of uniqueness is a frequent issue with powder diffraction structure determinations, but the range of candidate structures derived and refined from the data in this study was especially broad. Our interpretation is that the usual crystallographic triangulation of atomic positions did not work because the h and k Miller indices were either all 0 or 1 over the range of the data used to solve and refine the model. In any event, the analysis of the powder diffraction data alone cannot be regarded as providing a satisfactory solution of the structure of AgBeh.
The next approach was to optimize the preliminary AgBeh structure model (fixed unit cell) using density functional plane wave pseudopotential techniques as implemented in CASTEP (Clark et al., Reference Clark, Segal, Pickard, Hasnip, Probert, Refson and Payne2005). The Perdew-Wang 91 functional was used, with a 300-eV plane wave basis set cutoff. The Brillouin zone was sampled using 10 k-points. The density functional theory (DFT) calculation results indicate that the charge on the Ag ion is +0.65, and the charges on

Figure 8. (Color online) Comparison of diffraction pattern calculated from the structure solution after Rietveld refinement (blue solid line) overlaid with the experimental pattern (red + tick marks). The difference plot (black) is plotted below.
the oxygen atoms are −0.56 and −0.57. The Mulliken overlap populations are as follows:

The highest energy occupied states (HOMO) consist of mixtures of Ag d and O p orbitals. The lowest energy unoccupied states (LUMO) are Ag d orbitals.
The AgBeh structure obtained from CASTEP calculations was further refined using Rietveld refinement. The entire 2θ range (0.75–54 °2θ, step size of 0.005°, 10651 data points) was used for refinement. Peak profiles were fitted using a pseudo-Voigt function, and an asymmetry correction was applied using a Finger–Cox–Jephcoat function. For preferred orientation the Rietveld–Toraya function was used. Refinement of atomic positions where all atoms were allowed to move resulted in a refinement that would not converge. This result suggests that there could be some disorder in the eight-membered ring, the long aliphatic side chains, or both. Disorder in carboxylates with long side chains is known, e.g., ammonium myristate structure (Yu et al., Reference Yu, Li, Hollander, Snyder and Strauss1999). Such disorder is difficult to model in structures determined using powder X-ray diffraction data. Therefore, it was decided to treat one molecule of the AgBeh dimer (obtained from CASTEP) as a rigid body, while the position of
TABLE I. Crystal data for AgBeh.

TABLE II. Selected bond distances (Å) and bond angles (°) for AgBeh.

a O1 in 8-membered ring.
b O1 in 4-membered ring.
the molecule in the unit cell was refined. This approach allowed the Ag-O bond in the 8-membered ring to refine. The hydrogen atoms were included and located in idealized positions. The final Rietveld refinement of the lattice and pattern parameters resulted in a R wp of 8.66% (Figure 8), R p = 6.31%, and final R wp (without background) = 12.42%.
Details of the refined unit cell data are summarized in Table I, selected geometric parameters are shown in Table II, and atomic coordinates are listed in Tables III and IV. The overall conformation and its atomic numbering scheme are shown in Figure 9(a). As expected from the proposed structural model, Figure 9(b) illustrates an 8-membered ring dimer of Ag atoms and carboxyl groups joined by
TABLE III. Final coordinates and equivalent isotropic displacement.

U(eq) = 1/3 of the trace of the orthogonalized U Tensor.
TABLE IV. Hydrogen atom positions and isotropic displacement parameters for AgBeh.

4-membered Ag-O rings with fully extended zigzag side chains, giving rise to one-dimensional chains along the b-axis. Consistent with other silver carboxylates (Cowdery-Corvan and Whitcomb, Reference Cowdery-Corvan, Whitcomb and Diamond2002) the Ag-O bonding in the 8-membered ring is covalent. The close interaction (2.809 Å) between two Ag atoms in the 8-membered ring dimers is not unusual for silver carboxylate structures (Jaber et al., Reference Jaber, Charbonnier, Petit-Ramel and Faure1996; Chen and Mak, Reference Chen and Mak1991b; Olson et al., Reference Olson, Whitcomb, Rajeswaran and Stwertka2006; Whitcomb and Rajeswaran, Reference Whitcomb and Rajeswaran2006) and consistent with the EXAFS 2.8 Å Ag-Ag distance observed for AgBeh. Figure 6 shows the modeled EXAFS spectra based on the final AgBeh structure model, compared to the measured EXAFS spectra. Overall, there is good agreement between the measured and modeled
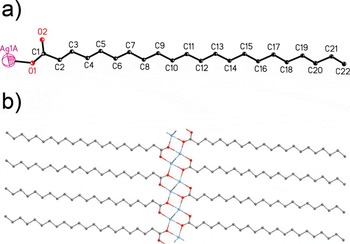
Figure 9. (Color online) (a) Conformation of AgBeh, with the atomic numbering scheme. (b) Unit-cell packing in AgBeh sheets in the b–c plane.
data providing confidence in the refined ring-dimer structure. For refined Ag-O bond lengths in the 8-membered ring, the Ag1-O2 distance (2.288 Å) is reasonable. However, the Ag1-O1 distance of 2.058 Å is shorter than expected. If the Ag-O distances were held fixed at the original CASTEP bond lengths, thermal parameters became unreasonably large, and there was reduced agreement between the observed and refined diffraction patterns at higher 2θ, resulting in an increase in R wp. The shorter Ag1-O1 distance of the refined structure suggests that there is some disorder in the 8-membered ring, consistent with the previously mentioned difficulty in trying to refine the structure model by allowing all atoms to move.
SUMMARY
The crystal structure of silver behenate has been successfully resolved. Unable to use standard single-crystal techniques, a synergistic combination of an optimal AgBeh powder sample, a high-resolution synchrotron radiation powder diffractometer, and density functional optimization was necessary in order to elucidate the correct structure. Two AgBeh molecules form an 8-membered ring dimer comprised of two Ag atoms and two carboxyl groups with the refined structure suggesting there may be disorder in the 8-membered ring. The dimers are joined by four-membered Ag-O rings creating a one-dimensional polymeric network. The aliphatic chains are fully in the trans configuration with no evidence for structural disorder beyond the usual Debye-Waller thermal vibrations. The good R factors, good agreement between calculated and measured density, absence of any unrealistic close contacts as well as an overall chemical reasonableness, and agreement with IR and EXAFS data, and known silver carboxylate structures all support the validity of the structure. This study demonstrates that a combination of techniques can provide a solution to otherwise intractable structures.
ACKNOWLEDGMENTS
The authors thank Syed Kahlid, National Synchrotron Light Source, Brookhaven National Laboratory for collection of EXAFS data, and Sharon Markel, Eastman Kodak Company, for collection of IR data. Use of the National Synchrotron Light Source, Brookhaven National Laboratory, was supported by the U.S. Department of Energy, Office of Science, Office of Basic Energy Sciences, under Contract No. DE-AC02-98CH10886.


