


INTRODUCTION
Cognitive dysfunction is a core and disabling symptom dimension that cuts across the psychoses. Deficits in patients with schizophrenia (SZ) and related disorders, including affective psychosis, have been reported in multiple cognitive domains including attention, verbal processing, working memory, and executive functioning; however, substantial cognitive heterogeneity exists both within and between diagnostic categories, and cognitive profiles characteristic of diagnostic groups have not emerged (Goldstein, Reference Goldstein1990; Seaton, Goldstein, & Allen, Reference Seaton, Goldstein and Allen2001).
A renewed interest in data-driven grouping of participants along the cognitive symptom dimension suggests that across diagnostic groups patients can be classified by cognitive profiles using cluster analysis (Burdick et al., Reference Burdick, Russo, Frangou, Mahon, Braga, Shanahan and Malhotra2014; Lewandowski, Sperry, Cohen, & Ongür, Reference Lewandowski, Sperry, Cohen and Ongür2014; Van Rheenen et al., Reference Van Rheenen, Lewandowski, Tan, Ospina, Ongur, Neill and Burdick2017), and that such groupings may be more closely related to neurobiology than diagnostic categories (Clementz et al., Reference Clementz, Sweeney, Hamm, Ivleva, Ethridge, Pearlson and Tamminga2016). Separable cognitive clusters can be identified by the first episode (Reser, Allott, Killackey, Farhall, & Cotton, Reference Reser, Allott, Killackey, Farhall and Cotton2015), indicating that profiles may reflect underlying illness traits. Broadly, results from these recent studies are consistent with earlier reports in patients with SZ, which tended to find distinct cognitive subgroups of patients including a “neuropsychologically normal” group, a group with significant global deficits, and one to three additional groups with mixed cognitive profiles (Allen, Goldstein, & Warnick, Reference Allen, Goldstein and Warnick2003; Goldstein, Allen, & Seaton, Reference Goldstein, Allen and Seaton1998; Goldstein, Beers, & Shemansky, Reference Goldstein, Beers and Shemansky1996; Goldstein & Shemansky, Reference Goldstein and Shemansky1995; Heinrichs & Awad, Reference Heinrichs and Awad1993; Hill, Ragland, Gur, & Gur, Reference Hill, Ragland, Gur and Gur2002; Palmer et al., Reference Palmer, Heaton, Paulsen, Kuck, Braff, Harris and Jeste1997; Seaton et al., Reference Seaton, Goldstein and Allen2001).
Cognitive clusters are associated with distinct clinical features. Patients with predominantly positive symptom SZ (e.g., paranoia) are more likely to be in the “neuropsychologically normal” cluster (Goldstein, Shemansky, & Allen, Reference Goldstein, Shemansky and Allen2005; Hill et al., Reference Hill, Ragland, Gur and Gur2002), whereas patients with more prominent negative or disorganized features are more likely to fall in cognitively impaired clusters. In terms of functional outcomes, subjects with neuropsychologically normal profiles exhibit increased socialization, fewer hospitalizations, and better overall community functioning than patients in clusters characterized by cognitive impairment (Allen et al., Reference Allen, Goldstein and Warnick2003; Lewandowski et al., Reference Lewandowski, Sperry, Cohen and Ongür2014; Palmer et al., Reference Palmer, Heaton, Paulsen, Kuck, Braff, Harris and Jeste1997).
While data-driven approaches to classification may produce homogeneous groupings along a dimension of interest, the interpretability and validity of findings is open to debate, due in part to potential problems with reproducibility in psychological research generally (Open Science Collaboration, 2015; Pashler & Harris, Reference Pashler and Harris2012; Simmons, Nelson, & Simonsohn, Reference Simmons, Nelson and Simonsohn2011), and based on limitations inherent in data-driven approaches themselves. In cluster analysis, emergent clusters are highly determined by sampling characteristics and the measures used to derive the clusters, making reproducibility critical to establishing the validity and utility of groups. In cognitive cluster analytic studies in SZ, for instance, intermediate clusters in particular vary considerably from study to study, and studies reporting the greatest comparability of emergent clusters tend to be those that use the same measures (Goldstein et al., Reference Goldstein, Allen and Seaton1998; Heinrichs, Ruttan, Zakzanis, & Case, Reference Heinrichs, Ruttan, Zakzanis and Case1997; Seaton, Allen, Goldstein, Kelley, & van Kammen, Reference Seaton, Allen, Goldstein, Kelley and van Kammen1999). Conceptually, replication of cluster solutions in separate samples using different measures that tap the same underlying constructs but may have different psychometric properties may be particularly important for establishing the validity and generalizability of emergent cluster solutions (Stroebe & Strack, Reference Stroebe and Strack2014).
In the present study, we used cluster analysis to examine cognitive clusters in a cross-diagnostic sample of patients with psychosis and the associations among clusters and clinical and functional variables, and to assess the reproducibility of our previous cluster solution (Lewandowski et al., Reference Lewandowski, Sperry, Cohen and Ongür2014) in this new sample using a different (but related) cognitive battery and the same clustering approach. It was hypothesized that (1) a four-cluster solution would provide a good fit to the data, (2) cognitive profiles would map closely to our previous findings, and (3) associations between clusters and clinical and functional variables would replicate our previous findings, including (a) diagnoses distributed across clusters, and (b) greater symptom severity and poorer community functioning associated with greater neuropsychological burden.
METHOD
Participants
Participants with diagnoses of affective or non-affective psychosis (n=120) and healthy controls (n=31) were recruited through the Schizophrenia and Bipolar Disorder Program (SBDP) and via fliers posted at McLean Hospital. Participants were recruited in the context of several separate but related studies: (1) cognitive remediation in SZ or bipolar disorder (BD) (n=42), (2) neuroimaging (n=33), or 3) clinical characterization of psychosis (n=76). For subjects recruited into longitudinal studies, baseline measures were used. Inclusion criteria included a DSM-IV diagnosis of SZ, schizoaffective disorder (SZA), schizophreniform disorder, psychosis not otherwise specified (NOS), BD I with psychosis, or major depressive disorder (MDD) with psychosis, ages 18 to 65. Exclusion criteria for all participants included history of head trauma with loss of consciousness, history of seizure disorder, and current substance abuse or dependence. Healthy controls had no personal or first-degree family history of a psychiatric diagnosis, and no history of substance abuse or dependence. This study and all associated procedures comply with the Helsinki Declaration of 1975, as revised in 2008, and were approved by the McLean Hospital Institutional Review Board.
Materials
Diagnosis was determined using the SCID-IV-TR through patient interview, medical record review, and consultation with the participants’ treatment providers. Clinical assessment included the Young Mania Rating Scale (YMRS; Young, Biggs, Ziegler, & Meyer, Reference Young, Biggs, Ziegler and Meyer1978), the Montgomery-Asberg Depression Rating Scale (MADRS; Montgomery & Asberg, Reference Montgomery and Asberg1979), and the Positive and Negative Syndrome Scale (PANSS; Kay, Fiszbein, & Opler, Reference Kay, Fiszbein and Opler1987). Community functioning was measured using an abbreviated version of the Multnomah Community Ability Scale (MCAS; Barker, Barron, McFarland, Bigelow, & Carnahan, Reference Barker, Barron, McFarland, Bigelow and Carnahan1994) as described in Lewandowski et al. (Lewandowski, Cohen, Keshavan, Sperry, & Ongür, Reference Lewandowski, Cohen, Keshavan, Sperry and Ongür2013). Premorbid IQ was measured with the North American Adult Reading Test (NAART; Uttl, Reference Uttl2002).
Cognition was measured using the MATRICS Consensus Cognitive Battery (MCCB; Nuechterlein et al., Reference Nuechterlein, Green, Kern, Baade, Barch, Cohen and Marder2008). The MCCB is comprised of 10 subtests that make up seven domain scores and a composite. Domains include: Speed of Processing (Trail Making Test A; Brief Assessment of Cognition in Schizophrenia: Symbol Coding; Category Fluency); Attention/Vigilance (Continuous Performance Test: Identical Pairs); Working Memory (Wechsler Memory Scale Spatial Span; Letter Number Span); Visual Learning (Brief Visuospatial Memory Test); Verbal Learning (Hopkins Verbal Learning Test); Reasoning/Problem Solving (Neuropsychological Assessment Battery: Mazes); and Social Cognition (Mayer-Salovey-Caruso Emotional Intelligence Test: Managing Emotions). Subtest, domain, and composite scores are converted to T-scores based on MCCB scoring software using age and gender adjusted norms. The MCCB takes approximately 60–90 min to complete.
Procedure
Neuropsychological and clinical data were collected in one to two sessions. Patient-reported information regarding medication was collected, and chlorpromazine (CPZ) equivalents were calculated using guidelines described by Baldessarini (Reference Baldessarini2012).
Statistical Approach
Cluster analysis was performed in STATA 12.1 (StataCorp LP, USA) first with hierarchical cluster analysis using Ward’s method including patients only to replicate our previous approach. The nine MCCB neuropsychological subtest scores were entered into the cluster analyses; we excluded the Mayer-Salovey-Caruso Emotional Intelligence Test (MSCEIT) test of social cognition because our original cluster analysis did not include a social cognition measure. Age- and gender-adjusted T-scores were reported for all MCCB variables for ease of comparison and so that each variable contributed equally to the distance measure. Cluster fit was determined by visual inspection of the dendrogram and “elbow test,” and acceptability was confirmed using discriminant function analysis to assess classification accuracy. While one of our aims was to replicate our previous findings of a four-cluster solution, hierarchical clustering was undertaken first to evaluate the appropriateness of forcing a four-cluster solution, and to more thoroughly explore whether a different number of clusters clearly offered a better fit to these data.
Next, a K-means cluster analysis was performed entering the above nine MCCB subscale scores, specifying the number of clusters selected based on our previous report and/or the number supported by the hierarchical approach. K-means was added as a second step because it is an iterative cluster approach which creates more stable cluster solutions. Linear discriminant function analysis was performed to evaluate classification accuracy, and the final K-means clusters were used for all subsequent group analyses.
Clusters were compared on demographic and clinical variables, and MCCB cognitive domain and composite scores using analysis of variance (ANOVA) or Chi2 as appropriate. Post hoc paired t tests were conducted for all significant ANOVA effects, with Bonferroni correction. Linear regressions controlling for clinical variables, CPZ equivalents, and diagnosis were conducted predicting cognition by cluster; similar regressions controlling for clinical variables, CPZ equivalents, diagnosis, and education were conducted predicting community functioning.
Finally, to compare the present cluster profiles to those of our previous report (Lewandowski et al., Reference Lewandowski, Sperry, Cohen and Ongür2014), we attempted to create comparable cognitive domains using the same standardization across the two data sets. We combined our previous cognitive subtests into domains comparable to MCCB domains, including Processing Speed (Stroop, Trails A, and Category Fluency), Verbal (Hopkins Verbal Learning Test Total Recall), Visual (Brief Visuospatial Memory Test Total Recall), Executive Functions (Stroop Interference, Trails B), and a Composite (average of all cognitive testing scores). Previously reported Z-scores were converted to T-scores for ease of comparison.
The MCCB Working Memory and Problem Solving Domains from the present data were averaged to create an “Executive Functions” domain, comparable to our previous report. Cognitive data from the combined (previous and current) sample was entered into a K-means cluster analysis with a forced four-cluster solution. Variables entered into the cluster analysis included the domain scores described above: Processing Speed, Verbal, Visual, and Executive Functions. Stability of cluster assignment across the total sample was then evaluated by examining the proportion of the combined sample that was re-classified into the same cluster as their original cluster assignment.
RESULTS
Cluster Solution
MCCB subtest scores were entered into a hierarchical cluster analysis using Ward’s linkage with squared Euclidean distance measure. Visual inspection of the resulting dendrogram provided support for two, three, or four clusters. The two-cluster solution resulted in broadly “intact” and “impaired” groups (composite means (sd): T=54.9 (4.8) and T=34.3 (10.6), respectively). The three-cluster solution included broadly “intact,” “moderately impaired,” and “significantly impaired” groups (composite means (sd): T=54.9 (4.8), T=38.1 (7.0), and T=19.6 (9.2), respectively). The four-cluster solution further divided the “moderately impaired” group into two mixed-profile clusters; the “intact” and “significantly impaired” groups were unchanged. Linear discriminant function analysis showed significant differentiation and a high degree of classification accuracy in the two-, three-, and four-cluster models (95%, 95%, and 93%, respectively). We then conducted an “elbow test,” plotting the percentage of variance explained in the Composite by two to eight clusters (Figure 1), which shows a clear “elbow” at four clusters. Thus, we found adequate support for the specification of a four-cluster solution.
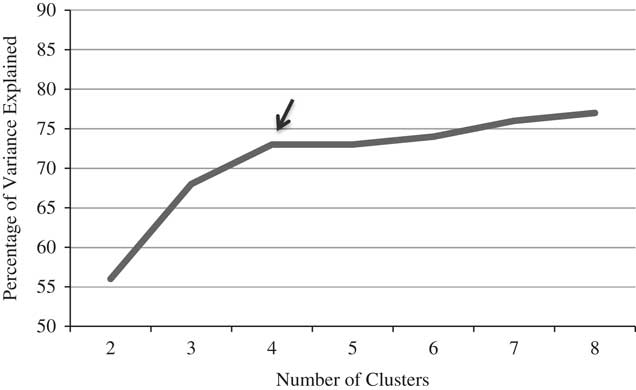
Fig. 1 Hierarchical cluster elbow test. Proportion of variance (between-group variance/total variance) explained as a function of the number of clusters. Using the “elbow method,” a cluster solution is chosen based on the inflection point at which adding additional clusters does not substantially improve modeling of the data.
Next, MCCB subtest scores (excluding MSCEIT) were entered into a K-means cluster analysis specifying a four-cluster solution. Fit of the four-cluster solution using linear discriminant analysis indicated good fit of the model, with 94% classification accuracy (Cluster 1 (n=39): 97%; Cluster 2 (n=42): 91%, Cluster 3 (n=18): 89%, Cluster 4 (n=21): 100%). Cognitive profiles by cluster are described below.
Cognitive Characteristics by Cluster
Neurocognitive profiles by K-means cluster were examined using the seven MCCB domain scores and the composite (Table 1). Profiles included a neuropsychologically normal cluster (Cluster 1; Composite T=55.1) in which all scores were at or slightly above the mean, a globally and significantly impaired cluster (Cluster 4; Composite T=20.9) in which all scores fell between 1 and 3 SDs below the mean, and two clusters with variable cognitive profiles (Clusters 2 and 3). Cluster 2 exhibited mild or no impairment in processing speed, attention, verbal learning, working memory, and problem solving, and selective visual learning and memory impairment in the moderate range; social cognition was intact. The Composite score for this group was mildly impaired (T=40.3). Cluster 3 exhibited intact visual learning and memory, mild or no impairment in working memory, problem solving, verbal learning, and social cognition, and moderate impairment in processing speed and attention; the Composite score for this group was moderately impaired (T=34.2).
Table 1 MCCB Domain Scores by Cluster

^ Clusters 2, 3 and 4 differed from Controls on all measures; Cluster 1 did not differ from controls on any measure. All reported post-hoc group differences were significant after Bonferroni correction.
** p<.01 **** p<.0001
The cognitive composite differed significantly by cluster (F (4,146)=121.86; p<.0001); Bonferroni-corrected pairwise comparisons indicated that all clusters differed from each other (p<.05 to p<.0001); Clusters 2, 3, and 4 differed from Controls (p<.0001). Cluster 1 did not differ from Controls on any MCCB domain or the composite.
Demographic and Clinical Characteristics by Cluster
Participants differed on several demographic and clinical variables, including education and premorbid IQ (Table 2). Patient clusters differed from each other on state mania (4>1,2), positive symptoms (4>1), negative symptoms (4>1), and CPZ equivalents (4>1,2).
Table 2 Demographic and Clinical Characteristics by Cluster
^ NAART: North American Adult Reading Test
** p<.01 **** p<.0001
We conducted a series of linear regressions to examine effects of cluster membership on cognitive outcomes after controlling for the potential effects of state clinical variables and medication (YMRS, PANSS Positive, PANSS Negative, CPZ equivalents) and diagnosis to examine the possibility that differences in cognitive performance by cluster were better accounted for by overall illness severity. Cluster membership remained a significant predictor of all neurocognitive domains and the composite (t=–17.19 to –5.93; p<.001), but not social cognition (t=–1.07; p=.29).
Groups differed on community functioning, with all four patient clusters scoring worse than Controls; Cluster 4 scored worse than clusters 1 and 2. Linear regression showed that cluster remained a significant predictor of community functioning after accounting for clinical variables and CPZ equivalents, diagnosis, and education (β=–1.36; t=–2.26; p=.03).
Diagnostic Distribution by Cluster
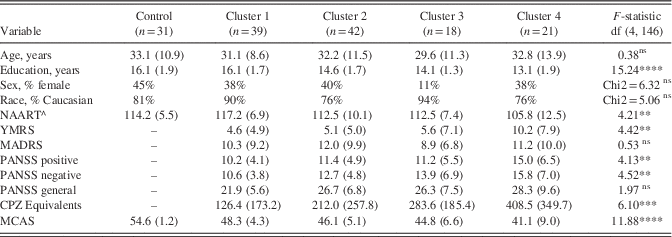
The distribution of diagnoses by cluster was examined by collapsing patients into three main diagnostic groups: mood disorders with psychosis (MDP; BD, n=54; MDD, n=10); SZA (n=28); and SZ (n=21; schizophreniform, n=5; psychosis NOS, n=2) to mirror our previous approach and to avoid cells with five or fewer participants. All diagnoses were represented in each cluster, although not evenly (Table 3). Patients with MDP were overrepresented in Cluster 1 and slightly underrepresented in Cluster 4; patients with SZ were underrepresented in Cluster 1 and overrepresented in Clusters 3 and 4; patients with SZA were overrepresented in Cluster 2 and underrepresented in Cluster 1. A spring-loaded graph depicting the similarity (inverse distance) between each participant in nine-dimensional space based on MCCB subtest scores, then overlaid by diagnoses, demonstrates that diagnoses do not map to the cognitive clusters but rather are distributed throughout the space (Figure 2).
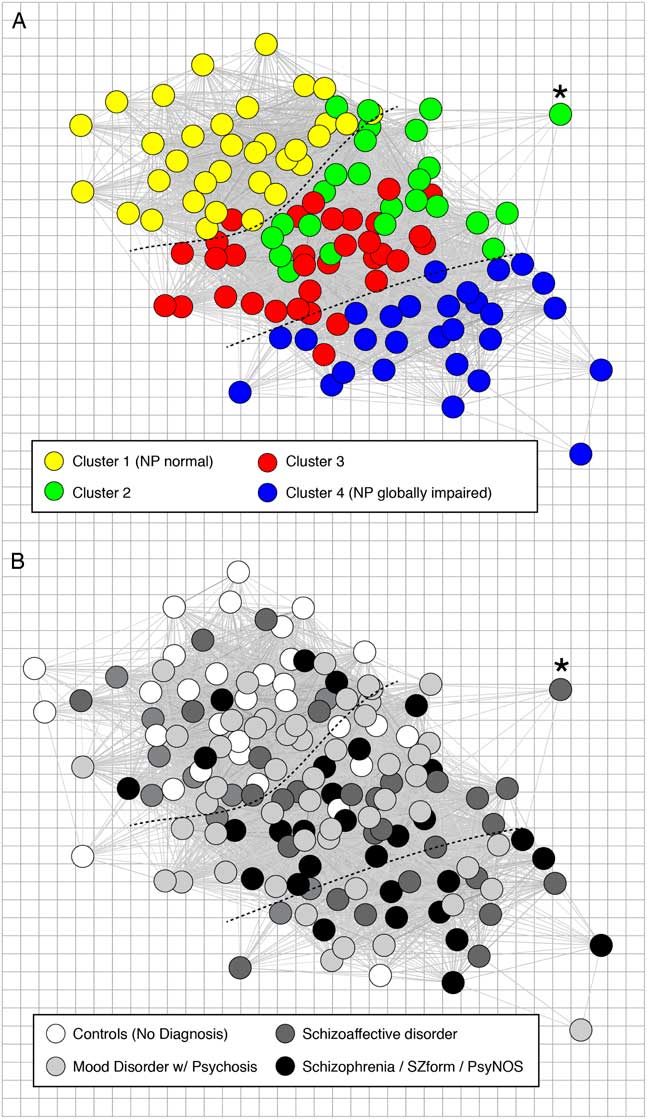
Fig. 2 Community structure of cognition in psychotic illness and relation to diagnostic classification. Each panel shows a spring-loaded graph of the study participants based on the similarity (inverse distance) between each participant in a nine-dimensional space defined by their scores on nine cognitive tasks, with location of patients held constant in the upper and lower panels. The upper panel (A) shows patients only (n=120) with colors assigned based on cognitive cluster assignment, with more neuropsychologically intact individuals on the upper left (Cluster 1) and more globally impaired individuals on the lower right (Cluster 4). The lower panel (B) shows the same patients with colors assigned based on SCID-IV-TR diagnosis, and showing control participants in white (n=31). Asterisks and dotted lines provided for spatial reference between the two panels.
Table 3 Distribution of Diagnoses by Cluster Footnote a

MDP, Mood Disorder with Psychosis; SZ, Schizophrenia; SZA, Schizoaffective Disorder
a Pearson χ2(6)= 13.4 (p<.05)
Post hoc analyses of cognitive domains by diagnosis showed that diagnoses differed significantly on the cognitive composite score, with scores in keeping with the published literature (MDP mean=44.4; SZA mean=38.0; SZ mean=35.4; MDP>SZ) (Hill et al., Reference Hill, Reilly, Keefe, Gold, Bishop, Gershon and Sweeney2013; Sperry et al., Reference Sperry, O’Connor, Öngür, Cohen, Keshavan and Lewandowski2015). Multinomial logistic regression entering all MCCB domain scores as predictors of either cluster membership or diagnosis revealed that both models were statistically significant (p<.0001); however, cognition explained considerably more variance in the cluster groupings (Pseudo R2=0.74) than in diagnosis (Pseudo R2=0.22).
Reproducibility of Cognitive Clusters
Figure 3 depicts cognitive profiles by cluster from our previous study and the current data presenting the modified domain scores described above. To compare the stability of the cluster assignments, the previous and new data were combined and K-means cluster analysis conducted. Not surprisingly, the new cluster profiles mirrored those of the two original samples. Original cluster assignments were then compared to the newly generated clusters. The proportion of the sample that was re-classified into the same cluster as their original cluster assignment was highest for Cluster 1 (93%), followed by Cluster 4 (89%), Cluster 3 (82%), and Cluster 2 (64%).
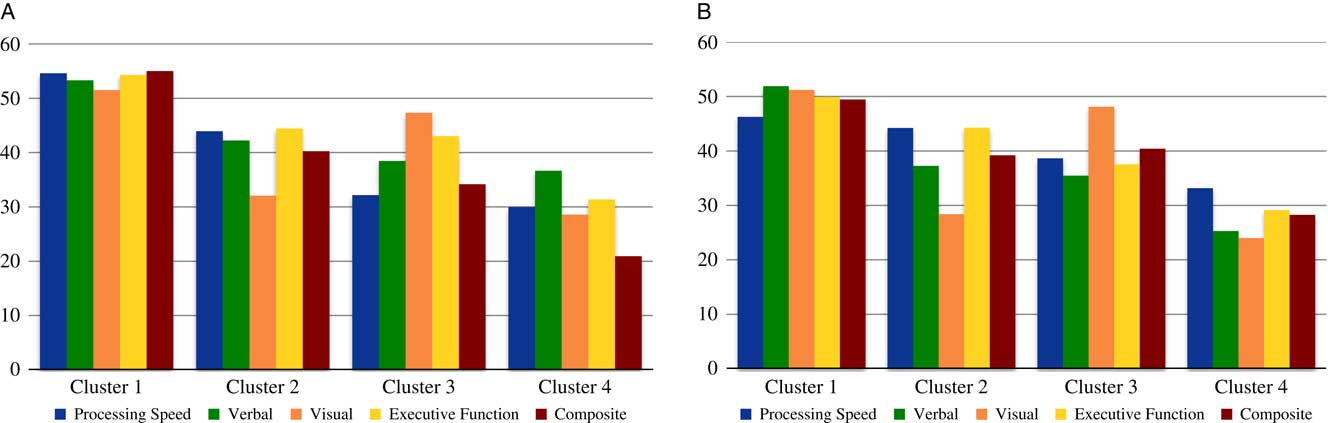
Fig. 3 New and previous cognitive profiles by cluster. Cognitive domain and composite scores from the present cluster analysis (Panel 3a) and our previous cluster analysis (Lewandowski et al., Reference Lewandowski, Sperry, Cohen and Ongür2014; Panel 3b). Panel 3a: MCCB domain scores were combine to reflect the domains available from our previous analysis (Panel 3b) by averaging the Working Memory and Problem Solving Domains in to an “Executive Functions” domain. Panel 3b: previous data (Lewandowski et al., Reference Lewandowski, Sperry, Cohen and Ongür2014) were combined into domains comparable to MCCB domains for more direct comparison between the original data set and the present data. Domains included Processing Speed (Stroop, Trails A, and Category Fluency), Verbal (HVLT Total Recall), Visual (BVMT Total Recall), Executive Functions (Stroop Interference, Trails B), and a Composite (average of all cognitive testing scores). Previously-reported Z-scores were converted to T-scores for ease of comparison.
DISCUSSION
The present study examined cognitive profiles in a cross-diagnostic sample of patients with psychosis using the MCCB, and the validity and interpretability of cluster analysis-derived cognitive groupings as compared to our previous report. We found support for a four-cluster solution with cognitive profiles that map closely to those produced in our previous work. As in our previous study (and others), we found evidence for a cognitively intact cluster that did not differ from our control sample or normative means, and a globally impaired cluster. We also found two clusters with mixed cognitive profiles: a cluster characterized by intact social cognition, mild impairments in processing speed, attention, verbal learning, and executive functions, and moderate selective impairment in visual learning (Cluster 2), and a cluster characterized by intact visual learning, mild impairment in executive functions and social cognition, and moderate impairments in processing speed and attention (Cluster 3). These findings are strikingly similar to the profiles from our previous report (Figure 3), with a high degree of classification stability from the original cluster assignment to the new cluster assignment based on the combined sample.
The finding of an intact patient group and a globally impaired patient group is among the most commonly-reported findings using cluster analytic techniques (Heinrichs & Awad, Reference Heinrichs and Awad1993; Lewandowski et al., Reference Lewandowski, Sperry, Cohen and Ongür2014; Palmer et al., Reference Palmer, Heaton, Paulsen, Kuck, Braff, Harris and Jeste1997; Van Rheenen et al., Reference Van Rheenen, Lewandowski, Tan, Ospina, Ongur, Neill and Burdick2017). In terms of globally impaired patients, widespread cognitive impairment has been described in schizophrenia for over a century. The term “dementia praecox” reflects the centrality of global cognitive impairment to early conceptualizations of schizophrenia (Bleuler, Reference Bleuler1911; Kraepelin, Reference Kraepelin1919), and classifications such as “dementia subtype” (Heinrichs & Awad, Reference Heinrichs and Awad1993) have been used specifically for cluster-derived groups of patients with SZ with widespread severe cognitive disturbance. This cognitive profile may be reflective of some of the more impressive neurobiological findings in the literature, including widespread reductions in gray matter volume, enlarged ventricles, and evidence of early developmental brain abnormalities (Keefe et al., Reference Keefe, Mohs, Losonczy, Davidson, Silverman, Kendler and Davis1987; Woodward & Heckers, Reference Woodward and Heckers2015).
Findings of “neuropsychologically normal” patients with psychosis have been intriguing, suggesting that some patients are relatively spared the cognitive effects of illness and subsequent poor outcomes (although it should be noted that patients with intact cognition may also have experienced neuroprogressive effects, but starting from a higher baseline). As would be hypothesized, several recent reports suggest that patients with schizophrenia without cognitive impairment evidence fewer structural brain abnormalities than patients with cognitive impairment (e.g., Woodward & Heckers, Reference Woodward and Heckers2015).
It is also well-recognized that some patients exhibit more selective impairments both in terms of cognition and neurobiological abnormalities. Cognitive profiles in Clusters 2 and 3 may reflect selective abnormalities, which map to commonly identified neurobiological findings in psychosis. Cluster 2 showed specific, selective impairment in visuospatial learning and memory, which may be associated with hippocampal abnormalities commonly described in patients with psychosis (e.g., Lawrie & Abukmeil, Reference Lawrie and Abukmeil1998; Nelson, Saykin, Flashman, & Riordan, Reference Nelson, Saykin, Flashman and Riordan1998). Indeed, a recent report found that BVMT performance was associated with hippocampal volume (Bonner-Jackson, Mahmoud, Miller, & Banks, Reference Bonner-Jackson, Mahmoud, Miller and Banks2015) in a memory clinic population. Alternatively, poor performance on this task may be related to visual perception impairments, which are also well described in SZ (Butler, Silverstein, & Dakin, Reference Butler, Silverstein and Dakin2008).
Cluster 3, on the other hand, showed more pronounced deficits in processing speed and attention, with milder impairment in executive functions and intact visuospatial processing. EEG and diffusion weighted imaging studies have found white matter abnormalities in fronto-striatal connectivity associated specifically with measures of processing speed and attention in psychosis (Kochunov et al., Reference Kochunov, Rowland, Fieremans, Veraart, Jahanshad, Eskandar and Hong2016; Morales-Munoz et al., Reference Morales-Muñoz, Jurado-Barba, Fernández-Guinea, Álvarez-Alonso, Rodríguez-Jiménez, Jiménez-Arriero and Rubio2017; Seitz et al., Reference Seitz, Zuo, Lyall, Makris, Kikinis, Bouix and Kubicki2016), suggesting that Cluster 3 may reflect specific white matter abnormalities along these tracts. Use of cluster analysis may reveal groups of patients who share cognitive performance profiles reflective of underlying neurobiological abnormalities. Explicit tests of the specificity of these clusters to neurobiological findings should be undertaken.
Consistent with our previous findings, all diagnoses were represented in all clusters, although not equally. Diagnoses did not map well to the cognitive clusters (Figure 2), and post hoc analyses showed that, while diagnostic groups did differ by cognitive performance, clusters do not simply reflect cognitive differences amongst disorders. These findings support the conceptualization of a cognitive dimension that cuts across diagnostic boundaries, although diagnostic groups may be differentially affected. Also consistent with our previous report, clinical symptom severity was worst in the globally impaired cluster; however, linear regression analyses suggested that differences in cluster membership were not best accounted for by clinical severity.
All four patient clusters were functioning more poorly than controls. The neuropsychologically normal cluster showed better functioning than the three neuropsychologically impaired clusters, consistent with our previous work. However, we previously reported no differences in community functioning amongst the clusters characterized by cognitive impairment, whereas the present findings suggest a “stepwise” association, with the globally impaired cluster showing the most pronounced functional deficits. Again, linear regressions suggested that differences in community outcomes were not better accounted for by illness severity or educational attainment. The present findings suggest that increasing cognitive burden is associated with poorer community functioning.
Social cognition did not follow the pattern of overall neurocognitive performance by cluster that might be expected based on MCCB Composite scores. In fact, only Clusters 3 and 4 differed significantly from controls, and within patient groups only Clusters 1 and 4 differed significantly from each other. These findings suggest that social and neurocognition may rely on at least partially separate mechanisms.
Lack of reproducibility of findings and concerning rates of replication failure (Open Science Collaboration, 2015; Pashler & Harris, Reference Pashler and Harris2012) speak to the need for studies examining the reproducibility of findings. This may be particularly true in data-driven approaches, as relatively small samples and techniques that are highly influenced by study characteristics may generate findings that do not generalize outside of the details of the study design. Thus, this “conceptual replication” (Stroebe & Strack, Reference Stroebe and Strack2014) was undertaken both to examine the reproducibility of our findings and to attempt to overcome an inherent limitation of cluster analysis techniques. We contend that multiple studies of reproducibility are critical to our ability to evaluate true effects (Maxwell, Lau, & Howard, Reference Maxwell, Lau and Howard2015), and that conceptual replication offers the advantage of emphasizing the underlying constructs rather than simply demonstrating reproducibility of findings bound by identical operationalization of the original variables (Stroebe & Strack, Reference Stroebe and Strack2014).
The present study has several limitations. First, data were assembled from several separate but related studies, with slightly different study criteria. Additionally, because of the distribution of participants amongst the clusters, groups were not equal in size, with our smallest cluster containing fewer than 20 participants. We were, therefore, limited in terms of power. However, our findings support our hypotheses even with conservative multiple comparisons corrections, supporting continued exploration of data-driven grouping strategies and their associations with clinical and functional correlates in psychosis.
Additionally, while we were able to include CPZ equivalents as a covariate in our analyses, we did not have adequate data on lithium or other mood stabilizers to allow investigation of the potential effects of these medications. The cross-sectional nature of these data limits our ability to draw conclusions about the meaning of these cognitive profiles in terms of the course of illness or prognosis. Longitudinal studies are needed to assess these important questions. Lastly, general cognitive functioning based on the NAART suggested that our sample was higher-functioning than would be expected in patients with psychosis. Thus, these findings may not generalize to a more typical sample of patients with psychosis.
In summary, we found groups with remarkably similar cognitive profiles using cluster analysis, suggesting that this technique produces reliable groupings across diagnoses that are not secondary to unique sampling characteristics or the measures used to derive them. Clusters accounted for considerably more variance in cognition than did diagnosis, suggesting that grouping patients along dimensions of interest may yield greater group homogeneity, which may be more likely to map to specific clinical trajectories or neurobiological mechanisms (Clementz et al., Reference Clementz, Sweeney, Hamm, Ivleva, Ethridge, Pearlson and Tamminga2016). Validation of our cluster solution based on reproducibility and associations with clinical and community functioning variables supports the interpretation of these groups as meaningfully distinct, reflective of underlying pathophysiology, and predictive of key outcomes. Data-driven grouping approaches may be particularly effective in facilitating the study of neurobiological mechanisms or etiological processes, and for building predictive models.
Acknowledgments
All authors K.E.L., J.T.B., J.M.M., L.A.N., and D.O. declare that they have no conflicts of interest to report in relation to this work. This work was supported by the National Institute of Mental Health (K.E.L., grant number K23MH91210), (D.O., grant number K24MH104449), (J.T.B., grant number K23MH104515); and the National Institute on Drug Abuse (J.M.M., grant number T32DA015036-15).


