


Obesity is a serious energy metabolism disorder characterised by the accumulation of excess body fat leading to several diseases like type 2 diabetes and cardiovascular disorders. In the last decades, the prevalence of childhood obesity has increased, and it became a major public health problem. Reference Gungor1,Reference Bereket and Atay2 Orthopaedic problems, insulin resistance, metabolic syndrome, and cardiovascular diseases are the most prevalent complications of childhood obesity respectively. Reference Maggio, Martin and Saunders Gasser3
Obesity in children is a high-risk factor for the development of atherosclerosis and cardiovascular complications in adulthood. Reference Bereket and Atay2 The onset of structural changes observed in the cardiovascular system is earlier in children diagnosed with metabolic syndrome compared to non-metabolic syndrome obese children and the onset of diastolic dysfunction is prior to systolic dysfunction. Reference Poirier, Giles and Bray4
Although many factors may lead to sudden unexpected cardiac death in adult obese individuals, the recent studies highlight ventricular repolarisation changes as an important etiologic factor for mortality. Tachyarrhythmias secondary to ventricular repolarisation changes may also occur in obese patients with no previous heart diseases. Electrocardiogram monitorisation may detect ventricular repolarisation changes like QT interval prolongation which may lead to Torsade’s de Pointes; a fatal ventricular tachyarrhythmia. Reference Omran, Firwana, Koerber, Bostick and Alpert5 Various factors such as heart failure, myocardial ischemia, hypertension, diabetes mellitus, hyperthyroidism, obesity, hypercholesterolemia, bradycardia, electrolyte imbalance (hypokalemia or hypomagnesemia), and drugs may also prolong QT interval. Reference van Noord, Eijgelsheim and Stricker6
The number of studies investigating ventricular repolarisation changes in obese children is limited. Reference Gungor1,Reference Nigro, Russo and Di Salvo7 In this study, we aimed to investigate the ventricular repolarisation changes (QT dispersion, QTc dispersion) in obese children and to compare QT dispersion and QTc dispersion between obese children with metabolic syndrome and without metabolic syndrome.
Materials and methods
Study population
The study included 81 obese (relative body mass index exceeded 95th percentiles for sex and age according to the reference values) children and 82 age and sex-matched normal weight children as control group. A total of 163 participants, who were between the ages of 8 and 18 years and admitted between the dates of June 2013 and June 2016, were enrolled in this study. Eighty-one obese children were recruited from our institution’s paediatric endocrinology and adolescent polyclinics that are specialised in the management of obesity. Participants with chronic systemic diseases, history of familial dyslipidemia, long QT syndrome, heart failure, congenital or acquired heart disease, electrolyte imbalance, any syndromic or endocrinologic problem leading to obesity, type 1 diabetes, obstructive sleep apnea or snoring, and those with a history of QT-prolonging drug usage were excluded from this study. Patients with a family history of long QTc syndrome and/or sudden cardiac death were also excluded from the study. The study was approved by the ethics committee of our institution (Date: 24.06.2013, No:10-373-13) and informed consent was obtained from all participants’ parents.
Obese children were subdivided into two groups as metabolic syndrome (n = 25) and non-metabolic syndrome obese (n = 56) groups. The diagnosis of metabolic syndrome was performed according to the International Diabetes Federation criteria. Reference Zimmet, Alberti and Kaufman8
International Diabetes Federation criteria for metabolic syndrome in children:
-
Obesity: waist circumference ≥ 90th percentile or body mass index z score ≥ 2 (<10 years), and waist circumference ≥ 90th percentile or adult cut-off if lower (10-<16 years), waist circumference ≥ 94 cm for Europid males and ≥ 80 cm for Europid females, with ethnic-specific values. Dyslipidemia: Serum triglyceride levels ≥ 150 mg/dl or high-density lipoprotein ≤ 40 mg/dl
-
Blood pressure: Systolic ≥ 130 mmHg/Diastolic ≥ 85 mmHg
-
Serum fasting glucose > 100 mg/dl or history of type 2 diabetes mellitus
The control group (N = 82) was recruited from non-obese healthy children referred to our paediatric cardiology department with a diagnosis of an innocent murmur. None of the subjects had structural or functional cardiovascular disease and the exclusion criteria were the same as the study group.
Clinical assessment
A detailed physical examination was performed to exclude endocrine and cardiac anomalies. Anthropometric measures were performed by standard measurements in all subjects.
Body mass index was calculated as the weight (kg) /height2 (m²). Relative body mass index was calculated as body mass index /predicted body mass index according to age × 100. Obesity was defined when relative body mass index exceeded 95th percentile for sex and age according to the reference values. Reference Denis Geary9 Measurements were evaluated according to hip and waist circumference standards of Turkish children between the ages of 7 and 17 years. Reference Neyzi, Furman, Bundak, Gunoz, Darendeliler and Bas10-Reference Hatipoglu, Mazicioglu, Poyrazoglu, Borlu, Horoz and Kurtoglu12 The presence of acanthosis nigricans and Taner–Marshal staging for puberty was recorded during physical examination.
Ambulatory blood pressure measurements were performed in the 08.00–10.00 a.m. time interval, at resting state. Appropriate blood pressure measurement cuffs for age, circumferising the upper 2/3 of the arm, were used. Blood pressure measurements were evaluated according to Schafer parameters. Reference Denis Geary9
Biochemical assessment was performed in all obese patients after 12 hours of overnight fasting and blood samples were obtained from participants between 08.00–10.00 a.m. Serum fasting glucose, fasting plasma insulin, total cholesterol, triglyceride, high-density lipoprotein, low-density lipoprotein, and very-low-density lipoprotein were measured in all obese patients. For assessment of the insulin resistance, fasting serum insulin level and homeostasis model assessment of insulin resistance were used. Homeostasis model assessment of insulin resistance = Fasting serum insulin level (mIU/ml) × Fasting serum glucose level* (mmol/lt)/ 22.5
 $${*Fasting\ serum\ glucose\ level\ mg/dl/18 = mmol/lt$$
A homeostasis model assessment of insulin resistance >2.22 in prepubertal girls, >2.67 in prepubertal boys, >3.82 in pubertal girls, and >5.22 in pubertal boys was accepted as insulin resistance. Reference Kurtoglu, Hatipoglu, Mazicioglu, Kendirici, Keskin and Kondolot13
Cardiologic assessment
Two highly experienced paediatric cardiologists blindly performed the electrocardiographic and echocardiographic measurements. One evaluated the electrocardiogram and the other performed the echocardiographic measurements blindly. All of the electrocardiographic and echocardiographic measurements were performed three times, and the mean of three measurements was recorded to avoid intraobserver variability.
Electrocardiographic measurements
Simultaneous 12 lead surface electrocardiogram recordings were made by Cardiocure Model ECG 2000 device at a paper speed of 25 mm/sn. To avoid diurnal variation, all recordings were obtained between 10.00 and 12.00 a.m.
In each electrocardiogram lead, all heart cycles were included for calculation. Leads with indistinguishable T waves or poor signal quality were excluded from the study. Heart rate, QRS interval, QT interval, min–max QT and QTc intervals, QT and QTc dispersions were calculated. Heart rate was calculated by the mean of all respiratory rate measurements. QRS interval was measured from the start of Q wave or in the absence of Q wave, from the start of the R wave to the end of S wave. QT interval was calculated as the distance between the first deflection of the QRS and the end of the T wave on the surface electrocardiogram. In subjects with sinus arrhythmia, QT interval after the shortest respiratory rate interval was measured. QTc was calculated by Bazett’s Formula. Reference Bazett14 Bazett’s Formula: (QTc = QT/√respiratory rate)
QT dispersion, which was the difference between the maximal and minimal values of QT, was also calculated in all leads. QTc dispersion was calculated as the difference between the longest and shortest QTc interval, measured in each of the 12 electrocardiographic leads. Reference Tutar, Ocal, Imamoglu and Atalay15
Echocardiography
All of the obese and control subjects underwent a detailed echocardiographic examination. The systolic and diastolic functions of the left ventricle were examined in the supine and left lateral decubitus positions. Echocardiographic assessments were performed with simultaneous electrocardiographic recordings using Philips iE33 X MATRIX echocardiography device with 2.5 and 3.5 MHz transducers.
Echocardiographic images were obtained from parasternal long and short axes together with apical four- and two-chamber views. All echocardiographic measurements were performed based on American Echocardiography Society standards. Reference Devereux and Reichek16 Left ventricular systolic function was assessed by M-mode echocardiography in the parasternal long-axis view. The left ventricular internal diameter at end-systole and end-diastole, interventricular septal thickness at end-systole and end-diastole, and left ventricular posterior wall thickness at end-systole and end-diastole were measured. Fractional shortening and the ejection fraction of the left ventricle were calculated. Mitral peak early diastolic flow velocity (mitral E), peak atrial flow velocity (mitral A), and the ratio of E/A (mitral E/A) were measured. Tissue doppler imaging of the left ventricle was performed in apical 4 chamber view. Systolic myocardial velocity, early diastolic myocardial velocity, and late diastolic myocardial velocity were measured at the lateral mitral annulus.
Left ventricular mass was calculated with Devereaux formula loaded to echocardiography device and the left ventricular mass index was calculated with left ventricular mass/height Reference Bereket and Atay2,Reference Nigro, Russo and Di Salvo7 formula. Reference Devereux, Alonso and Lutas17
Statistical analysis
Statistical analyses were performed using the statistical package program SPSS for Windows 20.0. When comparing means between two groups, for unpaired data Student t-test was used, and Mann–Whitney test was preferred when appropriate. Chi-square test was used for comparison of percentages between groups. Student t-test, chi-square, and Pearson correlation analysis were used for comparison of independent variables. Multivariate regression analysis was performed to evaluate the role of confounding factors. The confidence interval was given as 95% with an odds ratio for independent risk factors and statistical significance was set at p <0.05.
Results
Clinical characteristics
Baseline characteristics such as anthropometric measurements, clinical features, biochemical and hormonal parameters of obese (metabolic syndrome + non-metabolic syndrome obese groups), and control groups are shown in Table 1. Sex and age distribution of the two groups were similar. The ratio of female to male children was 26/30, 11/14, and 41/41 in non-metabolic syndrome obese, metabolic syndrome, and control group respectively. All anthropometric measures were significantly higher in the obese group than the control group as expected. All parameters except systolic and diastolic blood pressure were significantly higher in the non-metabolic syndrome obese group in comparison to the control group. Weight, body mass index, relative body mass index, systolic blood pressure, and duration of obesity were higher/longer in the metabolic syndrome group in comparison to the non-metabolic syndrome obese group (Table 1).
Table 1. Anthropometric, clinical features, biochemical and hormonal parameters of obese (MS + NMSO groups) and control group
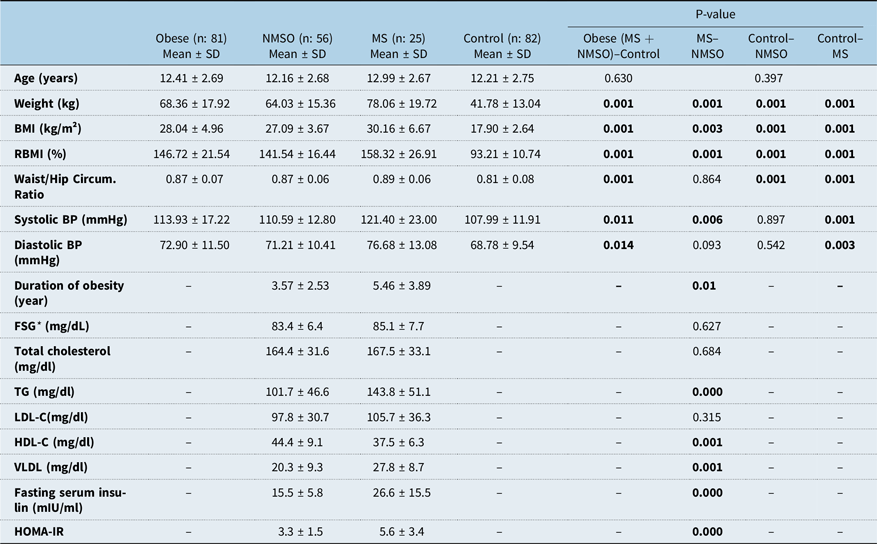
* BMI = body mass index; BP = blood pressure; FSG = fasting serum glucose; HDL-C = High-density lipoprotein; LDL-C = Low-density lipoprotein; MS = Metabolic syndrome; NMSO = Non-metabolic syndrome obese; RBMI = relative body mass index; TG = triglyceride; VLDL = Very low-density lipoprotein, Student t-test, p < 0.05
Biochemical analysis
As expected children with metabolic syndrome had higher fasting serum insulin, triglyceride and very low-density lipoprotein levels, glucose/insulin ratio, homeostasis model assessment of insulin resistance, and lower high-density lipoprotein levels than the non-metabolic syndrome obese group, but fasting serum glucose, total cholesterol, and low-density lipoprotein levels were similar (Table 1).
Evaluation of electrocardiogram parameters
There was not any significant difference between the obese and control group in means of heart rate, QRS interval, mean QT interval, mean RR interval, mean QTc interval. The mean of max QT and QTc, QT, and QTc dispersion was significantly higher in obese, non-metabolic syndrome obese, and metabolic syndrome children compared to healthy controls (Table 2, Figs 1 and 2). Although the mean QT and QTc dispersion of the metabolic syndrome group were significantly higher than the non-metabolic syndrome obese group, other results were similar between the two groups (Table 2).
Table 2. Comparison of ECG and echocardiography findings between subgroups (Control/Obese/NMSO/MS)
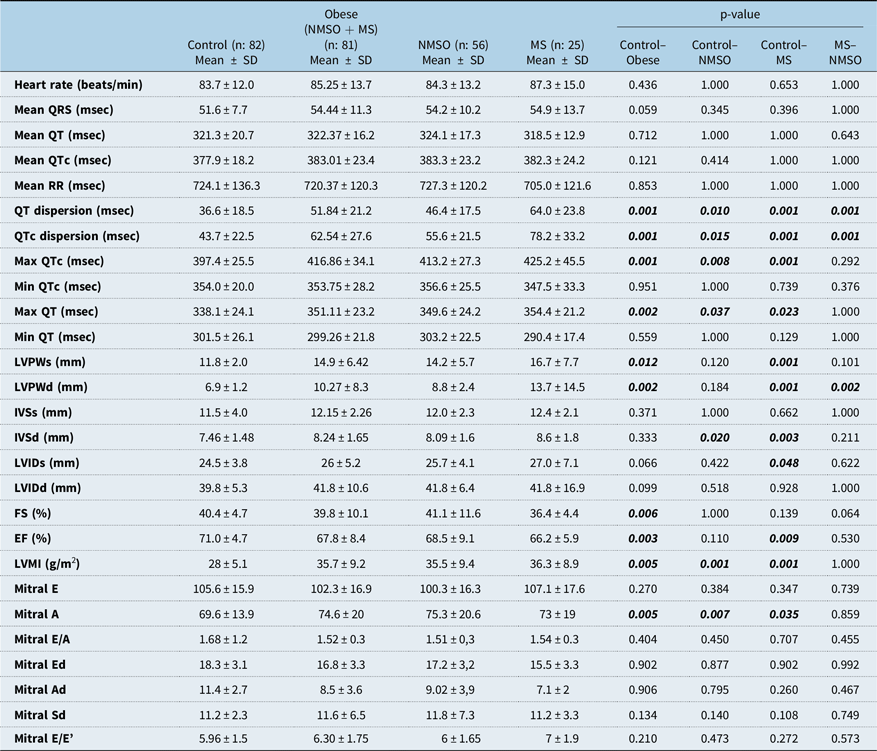
* Ad = late diastolic myocardial velocity; Ed = Early diastolic myocardial velocity; EF = Ejection fraction; FS = shortening fraction; IVSd = Interventricular septal thickness at end-diastole; IVSs = Interventricular septal thickness at end-systole; LVIDd = Left ventricular internal diameter at end-diastole; LVIDs = Left ventricular internal diameter at end-systole; LVPWd = Left ventricular posterior wall thickness at end-diastole; LVPWs = Left ventricular posterior wall thickness at end-systole; Mitral A=Mitral peak atrial flow velocity; Mitral E = Mitral peak early diastolic flow velocity; MS = Metabolic syndrome; NMSO = Non-metabolic syndrome obese; Sd = Systolic myocardial velocity. Student t-test, p < 0.05

Figure 1. Comparison of QTc dispersion between two groups by a Box-and-Whisker Blot.
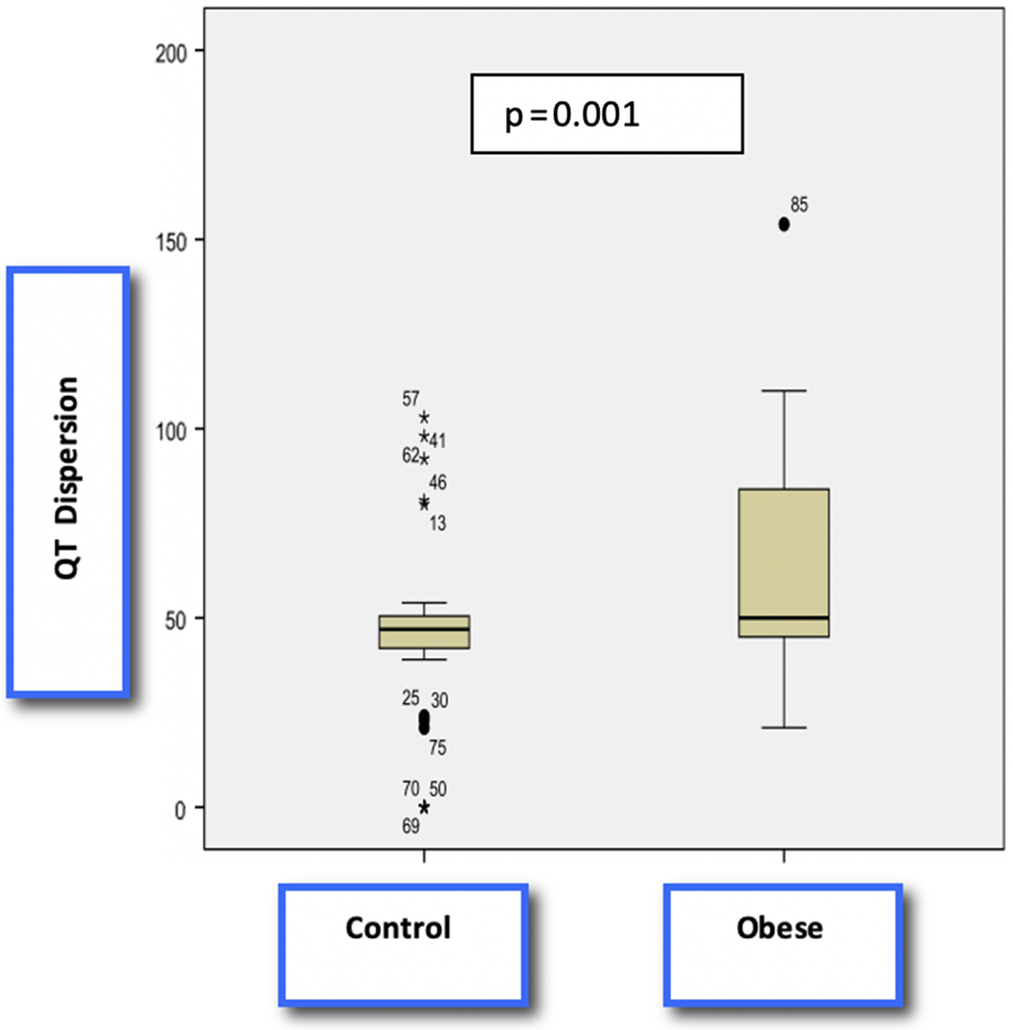
Figure 2. Comparison of QT dispersion between two groups by a Box-and-Whisker Blot
Evaluation of echocardiographic parameters
Although left ventricular posterior wall thickness at end-systole, left ventricular posterior wall thickness at end-diastole, interventricular septal thickness at end-diastole, and left ventricular mass index were significantly higher and ejection fraction was significantly lower in the metabolic syndrome group in comparison to the control group, there wasn’t any significant difference in means of interventricular septal thickness at end-systole, left ventricular internal diameter at end-systole, and left ventricular internal diameter at end-diastole parameters. Left ventricular mass index was significantly higher and ejection fraction was significantly lower in the obese group in comparison to the control group. Mitral peak atrial flow velocity was significantly higher in metabolic syndrome and non-metabolic syndrome obese groups compared to the control group. Mitral peak atrial flow velocity was the only diastolic parameter significantly different between groups and it was higher in metabolic syndrome and non-metabolic syndrome obese group compared to the control group. Comparison of echocardiographic parameters between all groups is shown in Table 2.
The correlation of echocardiographic parameters with electrocardiogram parameters is shown in Table 3. Interventricular septal thickness at end-diastole and left ventricular internal diameter at end-systole were positively correlated with QT dispersion, whereas left ventricular mass index and Mitral E/e’ were positively correlated with both QT dispersion and QTc dispersion. Mitral Ad was negatively correlated with QT dispersion and QTc dispersion. There wasn’t any correlation between ejection fraction and QT dispersion/QTc dispersion.
Table 3. Correlation of echocardiography and electrocardiography findings
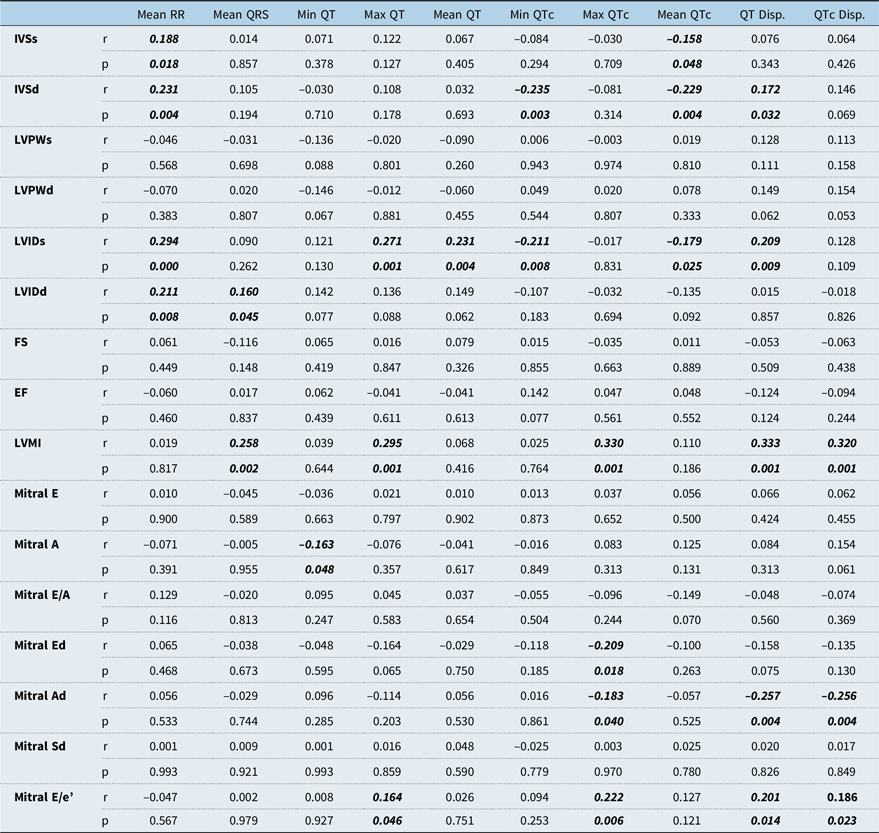
Ad = Late diastolic myocardial velocity; Ed = Early diastolic myocardial velocity; EF = Ejection fraction; FS = shortening fraction; IVSd = Interventricular septal thickness at end-diastole; IVSs = Interventricular septal thickness at end-systole; LVIDd = Left ventricular internal diameter at end-diastole; LVIDs = Left ventricular internal diameter at end-systole; LVPWd = Left ventricular posterior wall thickness at end-diastole; LVPWs = Left ventricular posterior wall thickness at end-systole; Mitral A = Mitral peak atrial flow velocity; Mitral E = Mitral peak early diastolic flow velocity; Sd = Systolic myocardial velocity. Pearson correlation, p < 0.05
Correlation of all electrocardiographic and echocardiographic parameters with anthropometric parameters that show the severity of obesity (body mass index, relative body mass index, Waist/Hip Circumference Ratio) are shown in Table 4. Body mass index, relative body mass index, and duration of obesity were significantly correlated with left ventricular mass index, QT dispersion, and QTc dispersion positively, but the waist/hip ratio was only correlated with QT dispersion. Ejection fraction was negatively correlated with body mass index, relative body mass index, and duration of obesity. There was no correlation between laboratory tests of children with metabolic syndrome and QT dispersion, QTc dispersion, and left ventricular mass index. Multivariate analysis showed that among all anthropometric and echocardiographic parameters relative body mass index and Mitral E/A ratio were the independent predictors of QT dispersion (relative body mass index R2: 0.127, β: 0.357, p = 0.006; Mitral E/A: R2: 0.176, β: 0.279 p = 0.024). Relative body mass index was the only independent predictor of QTc dispersion (R2: 0.129, β: 0.359 p = 0.006)
Table 4. Correlation of echocardiography and electrocardiography findings with body mass index, relative body mass index, waist/hip ratio, and duration of obesity
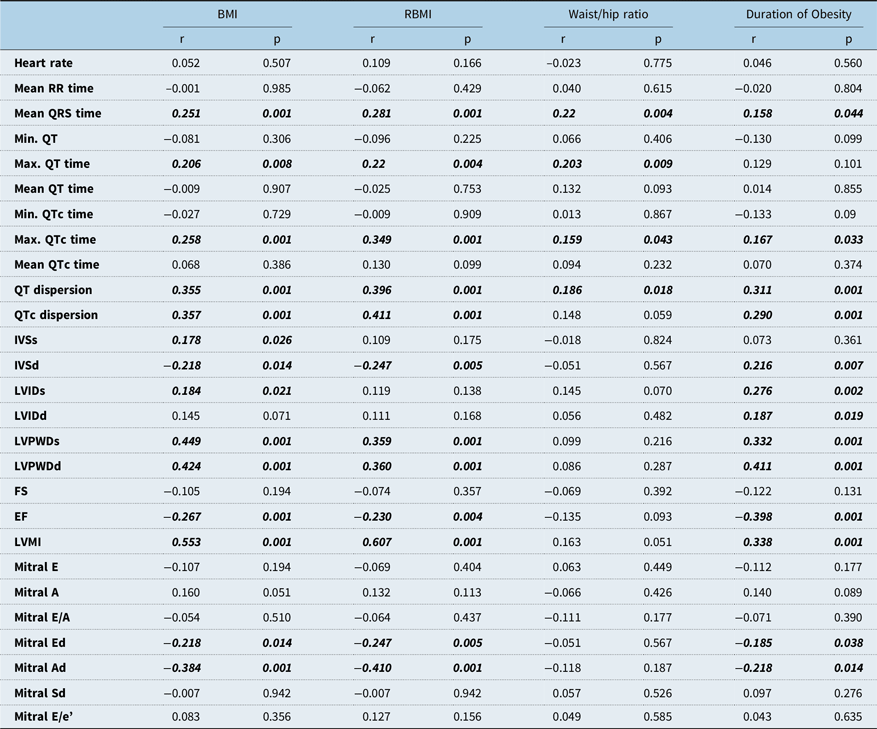
Ad = Late diastolic myocardial velocity; BMI = Body mass index; Ed = Early diastolic myocardial velocity; EF = Ejection fraction; FS = shortening fraction; IVSd = Interventricular septal thickness at end-diastole; IVSs = Interventricular septal thickness at end-systole; LVIDd = Left ventricular internal diameter at end-diastole; LVIDs = Left ventricular internal diameter at end-systole; LVPWd = Left ventricular posterior wall thickness at end-diastole; LVPWs = Left ventricular posterior wall thickness at end-systole; Mitral A = Mitral peak atrial flow velocity; Mitral E = Mitral peak early diastolic flow velocity; RBMI = Relative body mass index; Sd = Systolic myocardial velocity. Pearson correlation, p < 0.05
Discussion
Obesity is a major public health problem in developed countries and the prevalence of obesity has started to increase in children in recent years. Obesity is a well-known risk factor for cardiovascular diseases in all age groups and a strong predictor of sudden cardiac death. QT variables such as QT–QTc interval and QT–QTc dispersion have been used as a marker for abnormal ventricular repolarisation. Ventricular repolarisation changes were claimed as an important aetiologic factor for unexpected sudden cardiac death in adult obese individuals without any structural heart diseases and the recent studies showed that ventricular repolarisation changes such as QT prolongation and increased QTc dispersion may lead to lethal ventricular tachyarrhythmias such as Torsade’s de Pointes. Reference Omran, Firwana, Koerber, Bostick and Alpert5,Reference Malik and Batchvarov18
Multiple studies in the adult population showed prolonged QT and QTc and increased QTc dispersion in obese and overweight individuals. Reference Poirier, Giles and Bray4,Reference Omran, Firwana, Koerber, Bostick and Alpert5,Reference Omran, Bostick, Chan and Alpert19 Prolongation of QTc is caused by the lengthening of action potentials of ventricular myocytes. QT dispersion has been suggested as the physiological variability of regional ventricular repolarisation. Hyperinsulinemia and glucose intolerance have been associated with QT prolongation in obesity. Durante et al highlighted the impact of ventricular repolarisation as a leading factor of unexpected sudden cardiac death. Reference Durante, Laforgia and Aurelio20 Omran et al reported that obesity and being overweight were associated with significant prolongation of QT and QTc dispersion. Reference Omran, Firwana, Koerber, Bostick and Alpert5,Reference Omran, Bostick, Chan and Alpert19 Furthermore, they showed that weight loss with diet, exercise, and bariatric surgery led to a reduction in insulin levels, insulin resistance, hypertension, and consequently recovery in ventricular repolarisation changes in obese subjects.
Epicardial fat is a unique fat that is cardioprotective under normal physiological conditions. However, studies have shown that accumulation of excess fat is associated with increased propensity for atrial and ventricular arrhythmias, atherosclerosis, and decreased left ventricular functions. Obesity is a common reason for increased epicardial and intramyocardial fat. When normal storages of fat are saturated, excessive fat starts to accumulate in the heart in obese individuals. Reference Samanta, Pouliopoulos, Thiagalingam and Kovoor21,Reference Hua, Chen and Phinikaridou22 Changes in PR interval and P wave duration, interatrial conduction blocks, ventricular premature beats, and ventricular arrhythmias have been reported in individuals with increased epicardial fat. Reference Omran, Bostick, Chan and Alpert19,Reference Jhuo, Hsieh and Tang23,Reference Tam, Lin and Chan24 Some studies have also shown a negative correlation between epicardial fat and left ventricular functions. Reference Hua, Chen and Phinikaridou22
It has been demonstrated that during exercise the heart undergoes adaptive remodelling Exercise and myocardial scarring can lead to an increase in the size of cardiac chambers, elevated left ventricular mass, and pro-arrhythmic right ventricular modelling. The increased frequency of ventricular arrhythmia and sudden cardiac death in these patients is attributed to these changes. Reference Yilmaz and Kayancicek25-Reference D’Andrea, Morello and Iacono27 D’ Andrea et al reported that acute myocardial injury on the right heart during exercise may lead to chronic myocardial scar and so-called “exercise-induced cardiomyopathy”. Reference D’Andrea, Morello and Iacono27 Yılmaz et al reported significantly higher Tp–Te interval, Tp–Te/QT ratio, Tp–Te/QTc ratio, Tp–Te(d), and left ventricular mass index in athletes in comparison to the control group. Reference Yilmaz and Kayancicek25 Omiya et al reported that gender and the varying types of sport training should be considered when evaluating QT variables and that vigorous static exercise training may independently prolong QT variables. Reference Omiya, Sekizuka and Kida28
There are a limited number of studies investigating QT and QTc dispersion in obese and normal-weight children and adolescents. To the best of our knowledge, this is the first study to compare children with metabolic syndrome, children with non-metabolic syndrome obese, and normal-weight healthy children in means of electrocardiogram findings which reveals ventricular repolarisation changes. In our study, the mean maximum QT and QTc intervals and QT and QTc dispersions were significantly higher in obese children. Although the mean maximum QT and QTc were similar between metabolic syndrome and non-metabolic syndrome obese group, QT and QTc dispersion was significantly higher in the metabolic syndrome group compared to the non-metabolic syndrome obese group. Nigro et al reported QTc and JTc prolongation, and increased JTc dispersion in non-hypertensive obese children. Reference Nigro, Russo and Di Salvo7 In a recent study, QT interval prolongation and increased QTc dispersion were reported in obese children with obstructive sleep apnea. Reference Khositseth, Nantarakchaikul, Kuptanon and Preutthipan29 Akyüz et al reported minimum and maximum QT interval prolongation in overweight children but there was not any difference in means of QT dispersion between the two groups. Also, atrial depolarisation changes were evaluated but no significant difference was reported. Reference Akyuz, Alpsoy and Akkoyun30
In our study interventricular septal thickness at end-diastole and left ventricular mass index were significantly higher in both metabolic syndrome and non-metabolic syndrome obese groups, whereas left ventricular posterior wall thickness at end-diastole and left ventricular internal diameter at end-diastole were higher only in the obese group with metabolic syndrome compared to the control group. Magner’s et al also reported that interventricular septal thickness at end-diastole, left ventricular posterior wall thickness at end-diastole, left ventricular internal diameter at end-diastole, and left ventricular mass index were higher in obese children compared to control group. Reference Mangner, Scheuermann and Winzer31 Nigro et al reported significantly higher left ventricular mass index and left ventricular internal diameter at end-diastole in obese children but there was not any significant difference in ejection fraction, left ventricular internal diameter at end-systole, left ventricular posterior wall thickness at end-diastole, and interventricular septal thickness at end-diastole parameters between the two groups. Reference Nigro, Russo and Di Salvo7 In our study, ejection fraction was significantly lower in the metabolic syndrome group and an increase in left ventricular mass index and a decrease in ejection fraction were more commonly observed as the severity of obesity increased. This data also supports the hypothesis that the severity of obesity has a negative impact on systolic functions. Similarly, Patel et al reported that left ventricular geometry disorders and systolic dysfunction were more common in adult women with obesity. Reference Patel, Lavie, Artham, Milani, Cardenas and Ventura32 In contrast to this, Pascual M et.al reported normal systolic left ventricular functions in children with isolated obesity. Reference Pascual, Pascual and Soria33 In another study, left ventricular wall diameter was similar but diameters of left ventricle were increased and the strain of left ventricle was diminished in obese adult women regarding healthy controls. In the same study subclinical diastolic dysfunction was reported and the importance of early echocardiographic control was emphasised. Reference Pascual, Pascual and Soria33 In our study, mitral peak atrial flow velocity was the only diastolic parameter significantly higher in metabolic syndrome and non-metabolic syndrome obese group compared to the control group.
Our study showed that as the body mass index and relative body mass index increases, mean QRS, maximum QTc, maximum QT intervals, left ventricular mass index, dispersion of QT and QTc increases synchronously similar to Sanchez et al’s study. Reference Sanchez, Levy and Sekarski34 Furthermore, multivariate analysis showed that relative body mass index was the most important predictor of QT dispersion and QTc dispersion. We failed to show any correlation between laboratory parameters of metabolic syndrome, and QT/QTc dispersion, and left ventricular mass index. In contrast to our study, Akyüz et al reported no correlation between body mass index and QT dispersion and also reported a positive correlation between serum insulin levels and QT dispersion, homeostasis model assessment of insulin resistance, and QTc dispersion. Reference Akyuz, Alpsoy and Akkoyun30 Similar to Akyüz et al’s study, Magner et al Reference Mangner, Scheuermann and Winzer31 reported a correlation between homeostasis model assessment of insulin resistance and longitudinal/circumferential left ventricular strength. In our study interventricular septal thickness at end-diastole and left ventricular internal diameter at end-systole were positively correlated with QT dispersion, whereas left ventricular mass index and Mitral E/e’ were positively correlated with both QT dispersion and QTc dispersion. Mitral Ad was negatively correlated with QT dispersion and QTc dispersion.
Study limitations
The existence of myocardial scarring and the degree of physical activity which are both known to cause ventricular repolarisation changes were not considered. Because of the cross-sectional nature of this study, we could not investigate the long-term effects of weight reduction on ventricular repolarisation changes or left ventricular structure. Although mostly relative body mass index correlates with epicardial fat thickness, direct measurement of epicardial fat was not performed.
Conclusion
Our study demonstrated that QT/QTc interval prolongation and increase in QT and QTc dispersion on electrocardiogram may be found at an early age in obese children. Further studies showing the effects of weight reduction on repolarisation changes in obese children would provide better data about the effect of obesity on ventricular repolarisation changes.
Acknowledgments
None.
Financial Support
None.
Conflict of Interests
None.
Ethical Standards
The authors assert that all procedures contributing to this work comply with the ethical standards of the relevant national guidelines on human experimentation and with the Helsinki Declaration of 1975, as revised in 2008, and has been approved by the ethics committee of Ankara University.


