


Healthcare–associated infections (HAIs) are by far the most common complications affecting hospitalized patients throughout the world today.Reference Burke 1 The reduction of HAIs has become a major focus of attention in healthcare systems worldwide over the last decade, and monitoring rates of HAIs has become an important quality-improvement measure.Reference O’Grady, Alexander and Burns 2 In Greece in particular, HAIs have become a widespread and urgent problem. One of the most common HAIs, not only in Greece but worldwide, is central-line–associated bloodstream infection (CLABSI).Reference Fridkin and Olmsted 3 , Reference Gikas, Pediaditis and Papadakis 4 CLABSIs are associated with considerable morbidity and mortality, as well as high expenditure for national healthcare systems.Reference Siempos, Kopterides, Tsangaris, Dimopoulou and Armaganidis 5 , Reference Goudie, Dynan, Brady and Rettiganti 6 Surveillance is a necessary tool for monitoring CLABSI rates as well as for making progress toward preventing CLABSIs both within hospitals and at the national level.
The Centers for Disease Control and Prevention (CDC) states that for the collection of CLABSI denominator data, a daily count of the number of patients and of the number of patients with 1 or more central lines in place (ie, central-line days, CLDs) in each unit under surveillance is required.Reference Dudeck, Edwards and Allen-Bridson 7 Unfortunately, active daily surveillance of CLDs in the assessment of CLABSI rates is time-consuming and burdensome for healthcare workers,Reference Burke 1 which can lead to gaps in the collection of data, especially in resource-limited healthcare systems (as in Greece). Sampling of denominator data is a method that could reduce the time necessary to conduct active surveillance. Furthermore, the introduction of such a technique could enhance the interest of unit personnel in monitoring CLABSI rates. Previous studies have assessed the use of sampling to collect CLDs and suggest that it is applicable mostly in adult intensive care units (ICUs).Reference Hammami, Mertens, Overholser, Goetghebeur, Catry and Lambert 8 – Reference Shelly, Concannon and Dumyati 12
The primary objective of this study was to evaluate the accuracy of various sampling strategies in the estimation of CLABSI rates compared to actual CLABSI rates, based on the daily collection of denominator data not only in adults units but also in pediatric units in Greece. The secondary objective was to assess the impact of sampling on other measures related to HAIs, such as central-line utilization (CLU) ratios and CLDs.
Methods
Sampling of denominator data
Daily denominator data were collected for 6 consecutive months in 33 units from 14 hospitals across Greece that participate voluntarily in a initative called “Prevention of Hospital-Acquired Infections in Greece” (PHIG). One of the ultimate goals of this initiative is the reduction of CLABSI rates nationally. More specifically, 12 neonatal intensive care units (NICUs), 6 pediatric oncology units (Ped-ONCs), 4 pediatric intensive care units (PICUs,) and 11 adult units provided these data. In addition, 7 of these were hospitals with academic medical units. CLDs and patient days (PTDs) were collected manually on a daily basis at the same time of the day in every unit. The number of CLABSIs was also reported by all participating units, corresponding to the period during which the denominator data were collected. CLABSI rates and CLU ratios were calculated based on the CDC 2014 criteria.Reference Dudeck, Edwards and Allen-Bridson 7 From the original set of daily denominator data, 3 sampling strategies with 32 possible permutations were evaluated as follows: (1) 1 fixed day per week (7 permutations), (2) 2 fixed days per week (21 permutations), (3) 1 week per month (4 permutations). CLDs and PTDs for each month were estimated for each sampling permutation as follows:
 $$Estimated\,CLDs{\equals}{{Number\,of\,CLDs\,in\,the\,sample} \over {Number\,of\,sampled\,days\,per\,month}}{\times}30$$
 $$Estimated\,PTDs{\equals}{{Number\,of\,PTDs\,in\,the\,sample} \over {Number\,of\,sampled\,days\,per\,month}}{\times}30$$
The estimated CLDs and PTDs were used to calculate monthly CLABSI rates and monthly CLU ratios for each sampling permutation as follows:
 $$Estimated\,CLABSI\,rate{\equals}{{Number\,of\,CLABSIs} \over {Number\,of\,estimated\,CLDs}}{\times}1,000$$
 $$Estimated\,CLU\,ratio{\equals}{{Number\,of\,estimated\,CLDs} \over {Number\,of\,estimated\,PTDs}}$$
Statistical analysis
The accuracy of the estimated monthly CLABSI rates, CLDs, and CLU ratios was assessed by calculating the percentage error (PE) as follows:
 $$PE\,of\,estimated\,monthly\,CLABSI\,rates{\equals}{{Actual\,CLABSI\,rate{\minus}estimated\,CLABSI\,rate} \over {Actual\,CLABSI\,rate}}{\times}100$$
The distribution of PE of monthly CLABSI rates is presented with medians and percentile range (5%–95%). The absolute and relative frequencies (%) of months with PE ≤5% are also presented. Furthermore, intraclass correlation coefficients (ICCs), Bland-Altman plots, and percentages of months that are outside the limits of agreement were also calculated to assess the agreement between estimated and actual CLABSI rates.
Sampling permutations that most frequently provided months with PE ≤5% were selected and further examined. Linear mixed-regression models were used to compare the CLABSI rate PEs between these selected sampling permutations, taking into account that months were nested within units. Sensitivity analysis was conducted to detect differences in estimation between months with low and high CLDs. We used 75 CLDs as a cutoff, as proposed by the CDC.Reference O’Leary, van Santen, Webb, Pollock, Edwards and Srinivasan 13 All statistical analyses were stratified by type of unit: NICU, PICU, Ped-ONC, Adult. All analyses were conducted using STATA version 13 software.
Results
The original denominator dataset included information from 71 months from NICUs, 34 months from Ped-ONCs, 24 months from PICUs, and 66 months from adult units. An overview of descriptive characteristics of the types of participating units is presented in Table 1.
Table 1 Descriptive Characteristics of Types of Units Participating From the 14 Hospitals

Note. PTDs, patient days; CLDs, central-line days; CLABSIs, central-line–associated bloodstream infections; CLU, central-line utilization; NICUs, neonatal intensive care units; Ped-ONCs, pediatric oncology untis; PICUs, pediatric intensive care units.
Estimation of CLABSI Rates
The distribution of monthly CLABSI rate PEs and the number of months with CLABSI rate PEs ≤±5% by sampling permutation are provided in Figure 1 and Table 2. Sampling over 7 consecutive days, ie, 1 week per month (either the first, second, third, or fourth week of each month; permutations: weeks 1–4 in Fig. 1) provided the least accurate estimates of CLABSI rates (ie, the distribution of PE was very wide). Day-pair samples provided the most accurate estimates across all types of units. More specifically, in NICUs the proportion of months with CLABSI rate PE ≤5% was highest in the following pairs: Monday–Friday (85.9%), Tuesday–Wednesday (85.9%), Wednesday–Saturday (85.9%), Wednesday–Sunday (88.7%), and Thursday–Sunday (88.7%). In Ped-ONCs, the highest proportions were noted in the following pairs: Monday–Thursday (91.2%), Tuesday–Saturday (91.2%), Thursday–Saturday (91.2%), Friday–Saturday (91.2%), Friday–Sunday (91.2%), Monday–Tuesday (94.1%), and Monday–Friday (97.1%). In PICUs, the highest proportions were noted in the following pairs: Thursday–Friday (91.7%) and Friday–Saturday (87.5%). Lastly, in adult units, the highest proportions were noted in the following pairs: Wednesday–Sunday (86.4%), Tuesday–Sunday (87.9%), Thursday–Sunday (87.9%), Tuesday–Friday (92.4%), and Tuesday–Saturday (92.4%).
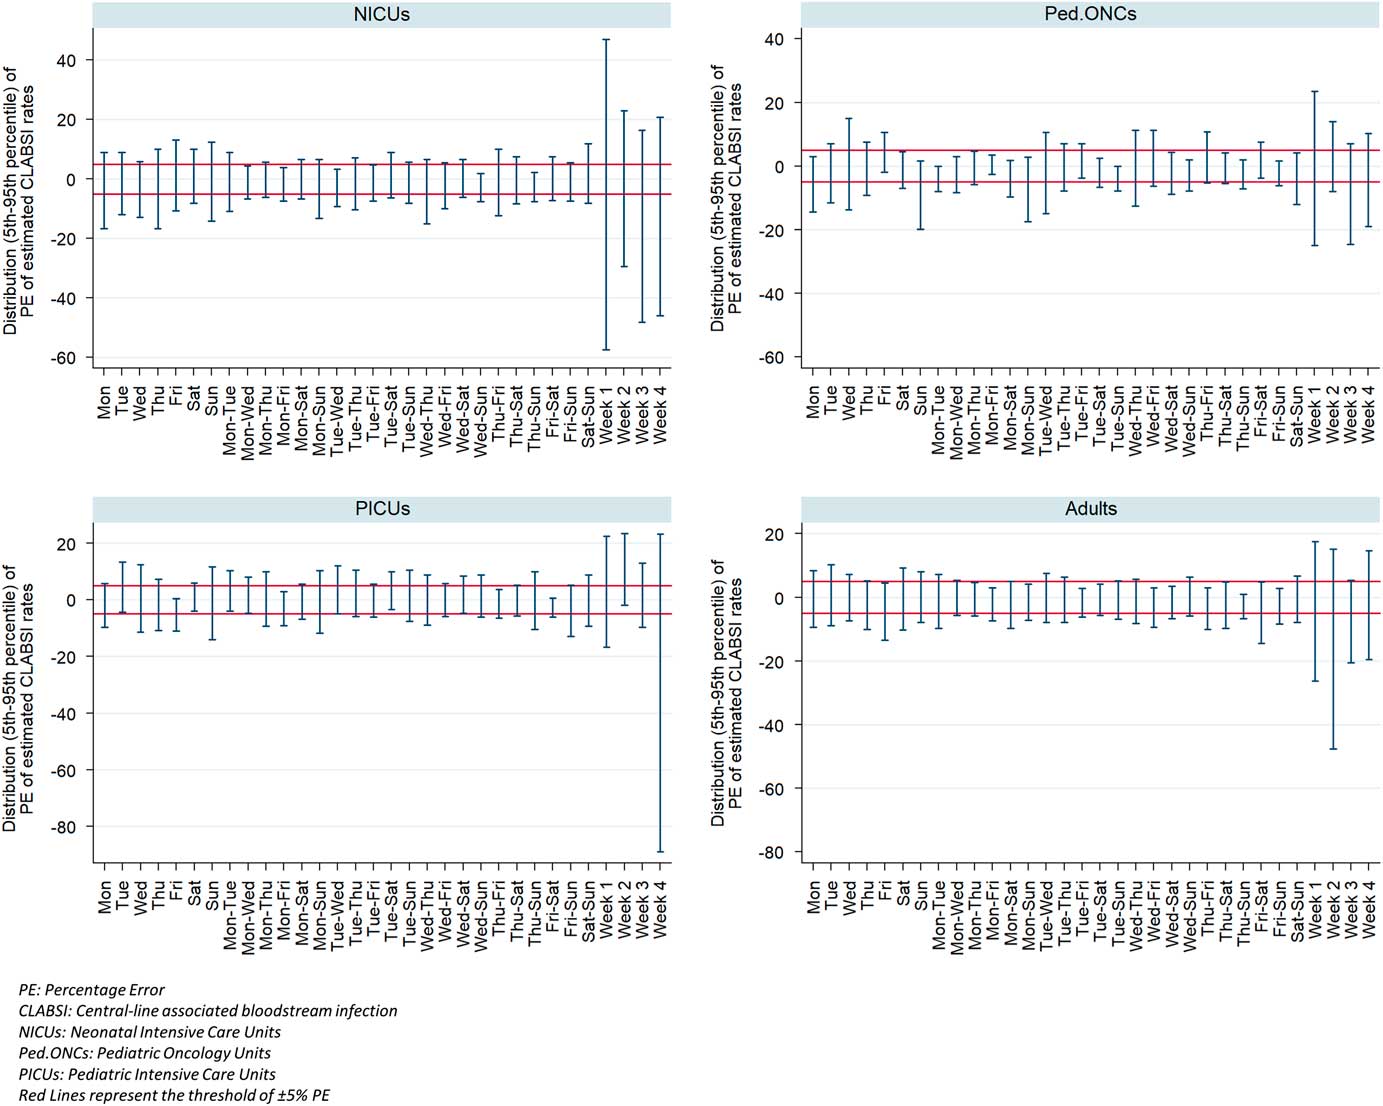
Fig. 1 Percentile distribution (5th–95th percentile) of the percentage εrror of the estimated CLABSI rates by each sampling permutation and type of unit.
Table 2 Number of Months With CLABSI Rate Percentage Error ≤±5% by Sampling Permutation
Note. CLABSI, central-line–associated bloodstream infection; NICUs, neonatal intensive care units; Ped-ONCs, pediatric oncology units; PICUs, pediatric intensive care units.
Linear mixed models were performed to determine which of these day-pair samples provided the most accurate estimation of CLABSI rates, and no statistically significant differences were detected between pairs (data not shown); hence these permutations may be used interchangeably. The ICC values for all of the above strategies were >0.9, indicating that the estimated CLABSI rates strongly resemble the actual rates (Table 2). Likewise, Bland-Altman percentages of months with estimated rates outside the limits of agreement were very low (<10% for almost all selected permutations) (Table 3). Figure 2 represents the Bland-Altman plot for a specific sampling permutation in NICUs. Bland-Altman plots for the rest of the selected sampling permutations were very similar to the one presented.
Table 3 Bland-Altman Percentage Out of Limits of Agreement and ICC Between Estimated and Actual CLABSI Rates by Selected Sampling PermutationsFootnote a

Note. BA, Bland-Altman; NICUs, neonatal intensive care units; Ped-ONCs, pediatric oncology untis; PICUs, pediatric intensive care units.
a That most frequently provided months with PE ≤±5%.
Assessment of CLDs and CLU ratio
The impact of sampling on estimating CLDs and CLU ratio was also estimated. The number of months with PE of estimated CLDs and CLU ratio ≤±5% by the above selected sampling permutations is presented in Table 4. The number of months with PE ≤±5% regarding estimated CLDs and CLU ratio was lower compared to estimated CLABSI rates, but still at a satisfactory level, especially in Ped-ONCs and adult units. Further analysis was conducted to investigate the reason behind the lower number of months with PE ≤±5% in NICUs. Because most of the participating NICUs have low CLDs, the proposed cutoff from the CDC of 75 central-line days was used. Analysis showed that the distribution of PE in the estimated CLDs and CLU ratio for every sampling permutation was much wider for months with ≤75 CLDs, indicating that using fewer CLDs leads to less accurate estimates. Figure 3 represents the discrimination of PE distribution between months with low and high CLDs for a specific sampling permutation in NICUs. Similar discrimination was observed for the other types of units.
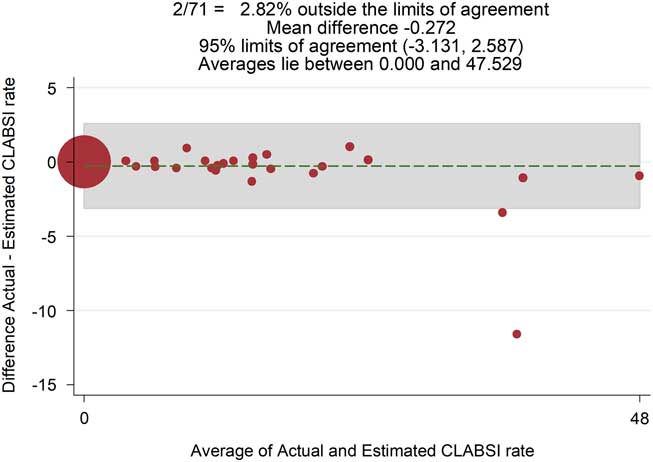
Fig. 2 Bland-Altman plot of agreement between estimated and actual CLABSI rates for the day-pair permutation Wednesday–Sunday in NICUs.
Table 4 Number of Months (%) With Percentage Error of Estimated CLDs and CLU Ratio ≤±5% by Selected Sampling Permutations

Note. NICUs, neonatal intensive care units; Ped-ONCs, pediatric oncology untis; PICUs, pediatric intensive care units; CLDs, central-line days; CLU, central-line utilization.

Fig. 3 Distribution of percentage error of the estimated CLU ratio using the cutoff of 75 central-line (cl) days for the day-pair permutation Monday–Friday in NICUs.
Discussion
Proper monitoring of CLABSI rates is critical to efforts to preventing CLABSIs. The economic recession that began a decade ago in many European countries, most notably in Greece, led to austerity measures and public sector cutbacks that also affected infection prevention programs.Reference O’Riordan and Fitzpatrick 14 The reallocation of available resources given these new circumstances could be an alternate approach for infection prevention in hospitals.Reference Vandijck, Cleemput, Hellings and Vogelaers 15 Elimination of the burden of the daily surveillance for monitoring CLABSI rates could be one such adjustment. The purpose of this study was to evaluate different sampling strategies in the estimation of CLABSI rates to reduce the time-consuming daily collection of denominator data needed to calculate such rates.
Overall, 32 permutations were evaluated, including 1 fixed day per week, fixed day-pairs per week, and 1 fixed week per month. Our results show that sampling over 2 fixed days per week provides the most accurate estimates of CLABSI rates. The percentage of monthly estimated CLABSI rates with PE ≤5% using the sampling strategy of 2 fixed days per week ranged from 74.6% to 88.7% in NICUs, from 79.4% to 94.1% in Ped-ONCs, from 62.5% to 91.7% in PICUs, and from 80.3% to 92.4% in adult units. These percentages were lower with respect to sampling over 1 fixed day per week and even lower when sampling 1 fixed week per month. Further evaluation with ICCs and Bland-Altman plots indicated that the estimated CLABSI rates by selected day-pair permutations are reliable.
Day-pair permutations with more accurate estimates varied across different types of units, mostly related to patterns of patient admission and discharge throughout the week for each type. Some of the selected strategies included weekend days, whereas the NHSN does not recommend sampling these days. 16 In our setting, patient movement in units was high during weekends; hence, excluding these days could lead to less accurate estimates. If denominator collection is not feasible for these days, then these strategies should not be preferred. Once a sampling strategy is selected, the person who collects the data must adhere to this strategy throughout the surveillance period; strategies with random selections of day-pairs were not evaluated in this study. Our hope is that someday, as electronic methords of record-keeping and documentation mature, manual sampling will not be necessary. In resource-limited healthcare systems, such as exists in Greece, no such system has been introduced yet. The recording of denominator data is and will be done by hand for the foreseeable future; this is why sampling is important.
Our study focused on the accuracy of the estimated CLABSI rates as a primary outcome and not on the estimated CLDs, since the latter impacts the prior. The method we used for the estimation of CLDs to calculate CLABSI rates was the same as that proposed by Hammami et al.Reference Hammami, Mertens, Overholser, Goetghebeur, Catry and Lambert 8 Although this study does not assess the impact of sampling on CLABSI rates, their findings suggest that sampling over 2 days per week provides more accurate estimated CLDs than sampling over 1 day. Our proposal with respect to CLABSI rates is similar. Other studies have also assessed the impact of sampling in CLDs and CLABSI rates.Reference Klevens, Tokars, Edwards and Horan 9 – Reference Shelly, Concannon and Dumyati 12 These studies did not use the same method for the estimation of CLDs; instead, they used the sample’s CLU ratio and the total number of actual patient days to estimate CLDs. This method of estimation was not evaluated in our study because it is more time-consuming to request the total number of patient days each month from the statistics offices of each unit. Despite the different methodology in the estimated CLDs, results of these studies were similar to ours. The impact of sampling on CLABSI rates was minimal. Furthermore, the cutoff of 75 CLDs was further examined, and our findings were similar to those of Thompson et al.Reference Thompson, Edwards and Bamberg 11 The estimated CLDs and CLU ratios were more accurate when the number of actual monthly CLDs was above 75.
Our study has some limitations. We examined only the accuracy of the estimation of CLABSI rates, CLU ratios, and CLDs. There are other metrics within the area of active surveillance of CLABSIs. For example, the accuracy of the estimation of antibiotic use ratio was not evaluated. Further research is also needed to assess possible factors that might influence the precision of the estimates of CLABSI rates, such as the length of hospital stay and the number of admissions. In addition, more sampling strategies should be considered, such as sampling on random days, sampling over 3 days per week, or sampling over several months. Our study was limited to the evaluated strategies because these were the most feasible in our setting. The available dataset consisted of 6 consecutive months of daily denominator data from each unit. This period may have been rather short to evaluate accuracy; more months may be needed to obtain reliable results. Especially with regard to PICUs in our dataset, there were 24 months of data compared to other types of units that had more. Moreover, further sensitivity analysis should be conducted to examine whether zero CLABSIs would influence the precision.
Notwithstanding the limitations described above, our findings further support existing evidence that sampling is a valid alternative to daily active surveillance and can provide reliable rates. More specifically, sampling over 2 fixed days per week seems to provide a more accurate alternative to the daily collection of CLABSI denominator data. Adoption of such monitoring methods in resource-limited healthcare systems, such as in Greece, could be an important step toward better and less burdensome infection control and prevention. These findings should also be evaluated for the surveillance of other healthcare-associated infections.
Acknowledgments
No sponsor was involved in the work reported.
Financial support
No financial support was provided relevant to this article.
Conflicts of interest
All authors report no conflicts of interest relevant to this article.
PHIG investigators:
General Hospital “Evaggelismos,” Athens, Greece: Maria Filippa, Sofia Kostourou, Athanasios Skoutelis, and Fani Veini; University General Hospital of Athens “Attikon,” Athens, Greece: Christina Logotheti, Vana Papaevangelou, and Pinelopi Triantafyllidou; Children’s Hospital of Athens “Agia Sofia,” University of Athens, Greece: Eleni Fanaraki, Katerina Kaisari, Panagiotis Kalabalikis, Korina Karachristou, Katerina Katsibardi, Antonis Kattamis, Maria Kazantzi, Vasiliki Kitra, Athanasia Lourida, Eleni Mpouza, Stamatia Papadopoulou, Loizos Petrikkos, Sofia Polychronopoulou, and Kirikas Zannikos; Second Department of Pediatrics, School of Medicine, Aristotle University of Thessaloniki, University General Hospital of Thessaloniki AHEPA, Thessaloniki, Greece: Andreas Giannopoulos, Emmanouel Hatzipantelis, and Athanasios Tragiannidis; Hippokration Hospital, Thessaloniki, Greece: Elisavet Chorafa and Elias Iosifidis; Second Department of Pediatrics, General Children’s Hospital of Athens “P. & A. Kyriakou,” University of Athens, Greece: Margarita Baka, Chrysanthi Dimolitsa, Dimitrios Doganis, Ioannis Kapetanakis, Georgios Mavrogeorgos, Aggeliki Nika, Smaragda Papachristidou, Ioannis Papadatos, Nikos Spyridis, and Mariza Tsolia; University General Hospital of Patras, Rio, Greece: Gabriel Dimitriou, Despina Gkentzi, and Asimina Tsintoni; Neonatal Intensive Care Unit, University General Hospital of Larissa, Greece: Caterina Gaitana, Ioanna Grivea, Aikaterini Kaffe, and George Syrogiannopoulos; Neonatal Intensive Care Unit, University Hospital of Ioannina, Ioannina, Greece: Vasileios Giapros, Theodoros Gouvias, and Aikaterini Drougia; Neonatal Intensive Care Unit, General Hospital of Nikaia and Piraeus “Aghios Panteleimon,” Athens, Greece: Georgia Karavana and Martha Theodoraki; Neonatal Intensive Care Unit, Venizelio General Hospital, Heraklion, Greece: Marina Koropouli and Christina Thomou; Neonatal Intensive Care Unit, General - Maternity District Hospital “Helena Venizelou”, Athens, Greece: Anastasia Kapetanaki and Margarita Tzaki; 2nd Neonatal Intensive Care Unit, G.P.N. Papageorgiou Hospital, Aristotle University Faculty of Medicine, Thessaloniki, Greece: Maria Lithoxopoulou and Vasiliki Soubasi; Penteli Children’s Hospital, Athens, Greece: Lida Sianidou and Foteini Zafeiropoulou; Center for Clinical Epidemiology and Outcomes Research (CLEO), Non-Profit Civil Partenrship, Athens, Greece: Polyxeni Karakosta, Sofia Kouni, and Stefania Maistreli.


