Introduction
Invasive alien species of plants and animals are an important driver of global environmental change and a major threat to biodiversity (Vitousek et al. Reference Vitousek, Mooney, Lubchenco and Melillo1997, Bellard et al. Reference Bellard, Cassey and Blackburn2016, IPBES 2019). They have already caused tremendous economic losses in agriculture, forestry, pasture, and fisheries across different geographical scales (Diagne et al. Reference Diagne, Leroy and Vaissière2021). These threats are ever-growing due to the development of transportation networks and increased mobility of people and commodities (Simberloff et al. Reference Simberloff, Martin and Genovesi2013, Sardain et al. Reference Sardain, Sardain and Leung2019). Invasive alien species compete with native biota, alter and homogenize forest composition, change ecosystem functions, compromise ecosystem services, and reduce native species diversity (Bellingham et al. Reference Bellingham, Tanner and Martin2018). They also degrade habitat quality for wildlife (Murphy et al. Reference Murphy, Subedi and Jnawali2013), and potentially impact across all types of ecosystems as well as individual species. Nevertheless, impacts are contingent on the traits of the invading species and the types of ecosystem exposed to the invasion (Martin et al. Reference Martin, Canham and Marks2009, Pyšek et al. Reference Pyšek, Jarošík and Hulme2012, Liebhold et al. Reference Liebhold, Brockerhoff and Kalisz2017).
Distribution and abundance of Invasive Alien Plant Species (IAPS) varies across spatial scales (Foxcroft et al. Reference Foxcroft, Richardson, Rouget and MacFadyen2009). At larger geographical scales, the impact of IAPS is the result of an interplay between social, ecological, and economic variables, including national gross domestic production and population density (Liu et al. Reference Liu, Liang and Liu2005, Hulme Reference Hulme2009, Niemiec et al. Reference Niemiec, Asner and Brodrick2018, Sardain et al. Reference Sardain, Sardain and Leung2019). Road networks and mobility of people not only transport IAPS propagules from one place to another, but also create locally disturbed areas which are suitable for propagule establishment (González-Moreno et al. Reference González-Moreno, Diez and Ibáñez2014, Fuentes-Lillo et al. Reference Fuentes-Lillo, Lembrechts and Cavieres2021). These factors are fundamental to the early stage of invasion. However, further augmentation of IAPS at the local scale is determined by local environmental factors including habitat disturbance, species invasiveness, habitat invasibility, and propagule pressure (Stohlgren et al. Reference Stohlgren, Barnett and Flather2006). Newly arrived propagules have to pass climatic, edaphic, and biological filters for successful invasion (Davis Reference Davis2009).
Resident ecological communities naturally tend to resist the establishment and spread of incoming species, a phenomenon explained as ‘biotic resistance hypothesis’ (Levine et al. Reference Levine, Adler and Yelenik2004, Nunez-Mir et al. Reference Nunez-Mir, Liebhold and Guo2017). This hypothesis predicts that species-rich communities have a lower vulnerability to invasion at the local scale (Levine et al. Reference Levine, Adler and Yelenik2004). An analysis of native and invasive plant species richness has found a negative relationship across communities and ecoregions in continental United Sates (Beaury et al. Reference Beaury, Finn and Corbin2020). However, the diversity resistance hypothesis is not always supported by empirical studies (Byun & Lee Reference Byun and Lee2018, Smith & Côté Reference Smith and Côté2019). Rather there are instances of congruence of higher native diversity and higher invasion, particularly at larger spatial scales (Stohlgren et al. Reference Stohlgren, Barnett and Flather2006). Similarly, it is also found that the native-invasive plant species richness relationship is contingent on human disturbance, which mediates the relationship (Fuentes-Lillo et al. Reference Fuentes-Lillo, Lembrechts and Cavieres2021).
The main mechanism behind biotic resistance is competition (Nunez-Mir et al. Reference Nunez-Mir, Liebhold and Guo2017). Competition for key resources—for example, light, water, and nutrients, and space between incoming species and the recipient community—may be the main mode of the interactions. The attributes of resident communities that curtail the availability of key resources required for incoming species may vary across resident communities and incoming species. Nevertheless, the higher species richness of a native community does not necessarily make the community more competitive and invasion resistant (Levine Reference Levine2000, Fridley et al. Reference Fridley, Stachowicz and Naeem2007). Besides species richness, other attributes of communities, for example, density, crowding, and biomass, potentially make communities more competitive and resistant to invasion (Kennedy et al. Reference Kennedy, Naeem and Howe2002, Luo et al. Reference Luo, Chen, Xia and Chen2018, MacLaren et al. Reference MacLaren, Swanepoel and Bennett2019). In forest stands, native species richness, tree density, canopy cover, and the shrub/sapling layer are important community attributes for invasion resistance (Gómez et al. Reference Gómez, Murúa and San Martín2019). Indeed, these attributes determine the availability of empty niches for successful invasions. Forest stand attributes, therefore, may be relatively more important than other local factors for invasion success on the forest floor by limiting the amount of light reaching the surface of the ground (Charbonneau & Fahrig Reference Charbonneau and Fahrig2004, Fajardo & Gundale Reference Fajardo and Gundale2018, Bustamante et al. Reference Bustamante, Gómez and San Martín2019). Shrub/saplings and ground vegetation layers potentially reinforce the impacts of canopy cover by preventing intercepted light reaching on the ground. Nevertheless, the impact of canopy may also be dependent on the nature of invading species, as many shade-tolerant invasive species are favoured in dense and undisturbed forest (Martin et al. Reference Martin, Canham and Marks2009).
Distribution patterns generated from coarse-scale spatial data, and models based on climatic suitability, may not depict the local-scale distribution and abundance of IAPS. Some areas of forests, for example, canopy gaps and forest margins, provide more conducive environments than forest interiors for invasion success (Driscoll et al. Reference Driscoll, Angeli and Gorchov2016, Arellano-Cataldo & Smith-Ramírez Reference Arellano-Cataldo and Smith-Ramírez2016, Khaniya & Shrestha Reference Khaniya and Shrestha2020). Therefore, understanding the drivers of local-scale patterns of IAPS abundance is crucial for their management at the site (forest stand) level (Foxcroft et al. Reference Foxcroft, Richardson, Rouget and MacFadyen2009). However, how the abundance of IAPS are correlated with stand attributes, and how native species richness is related to IAPS richness for specific forest types, is not well understood.
In this context, we assessed the abundance of the invasive plant species Chromolaena odorata (L.) R.M.King & H.Rob. in Sal (Shorea robusta Gaertn.) forest. Sal forest is a major forest type in the tropical and subtropical parts of the Indian subcontinent and has been widely invaded by C. odorata. The few studies that have analysed invasive species in forests have shown a positive correlation between forest disturbances and light intensity (Joshi et al. Reference Joshi, De Leeuw and van Andel2006) and lower species richness in invaded plots compared to non-invaded plots (Thapa et al. Reference Thapa, Kaewchumnong, Sinkkonen and Sridith2016, Bhatta et al. Reference Bhatta, Joshi and Shrestha2020). Nevertheless, this inference was either drawn from studies conducted on large-sized plot (Joshi et al. Reference Joshi, De Leeuw and van Andel2006) or from a small sample size (Thapa et al. Reference Thapa, Kaewchumnong, Sinkkonen and Sridith2016), and these studies did not analyse the relationship between stand attributes and invasive species abundance. Therefore, this study sets out to analyse how forest stands attributes, including local disturbance, influence C. odorata coverage in Sal forest using small-sized plots across a canopy cover gradient. We also test the hypothesis that native species-rich plots are more resistant to invasion.
Methodology
Study area
This study was conducted in four community-managed forests (Community Forests) of central Nepal; two in each of Makawanpur and Nawalparasi districts. All the sampled forests were similar in terms of geography, climate, vegetation, and management regime; however, the forests in Nawalparasi were more fragmented than in Makawanpur (Table 1, Figure 1). Community forests are the forest categories that are managed by local users formed into legally recognised organizations. Nepal has exemplary success in the sustainable management of forest commons through its Community Forestry program, with over 22,000 Community Forest User Groups (CFUGs) formed and registered (Niraula et al. Reference Niraula, Gilani, Pokharel and Qamer2013, Pandey & Pokhrel Reference Pandey and Pokhrel2021).
Table 1. Information on the four sampled community forest
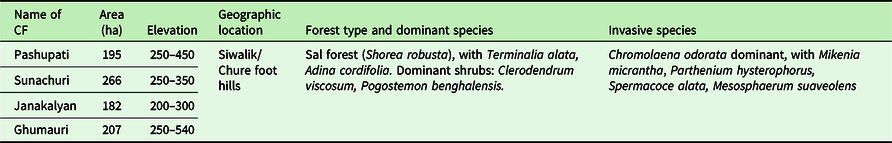
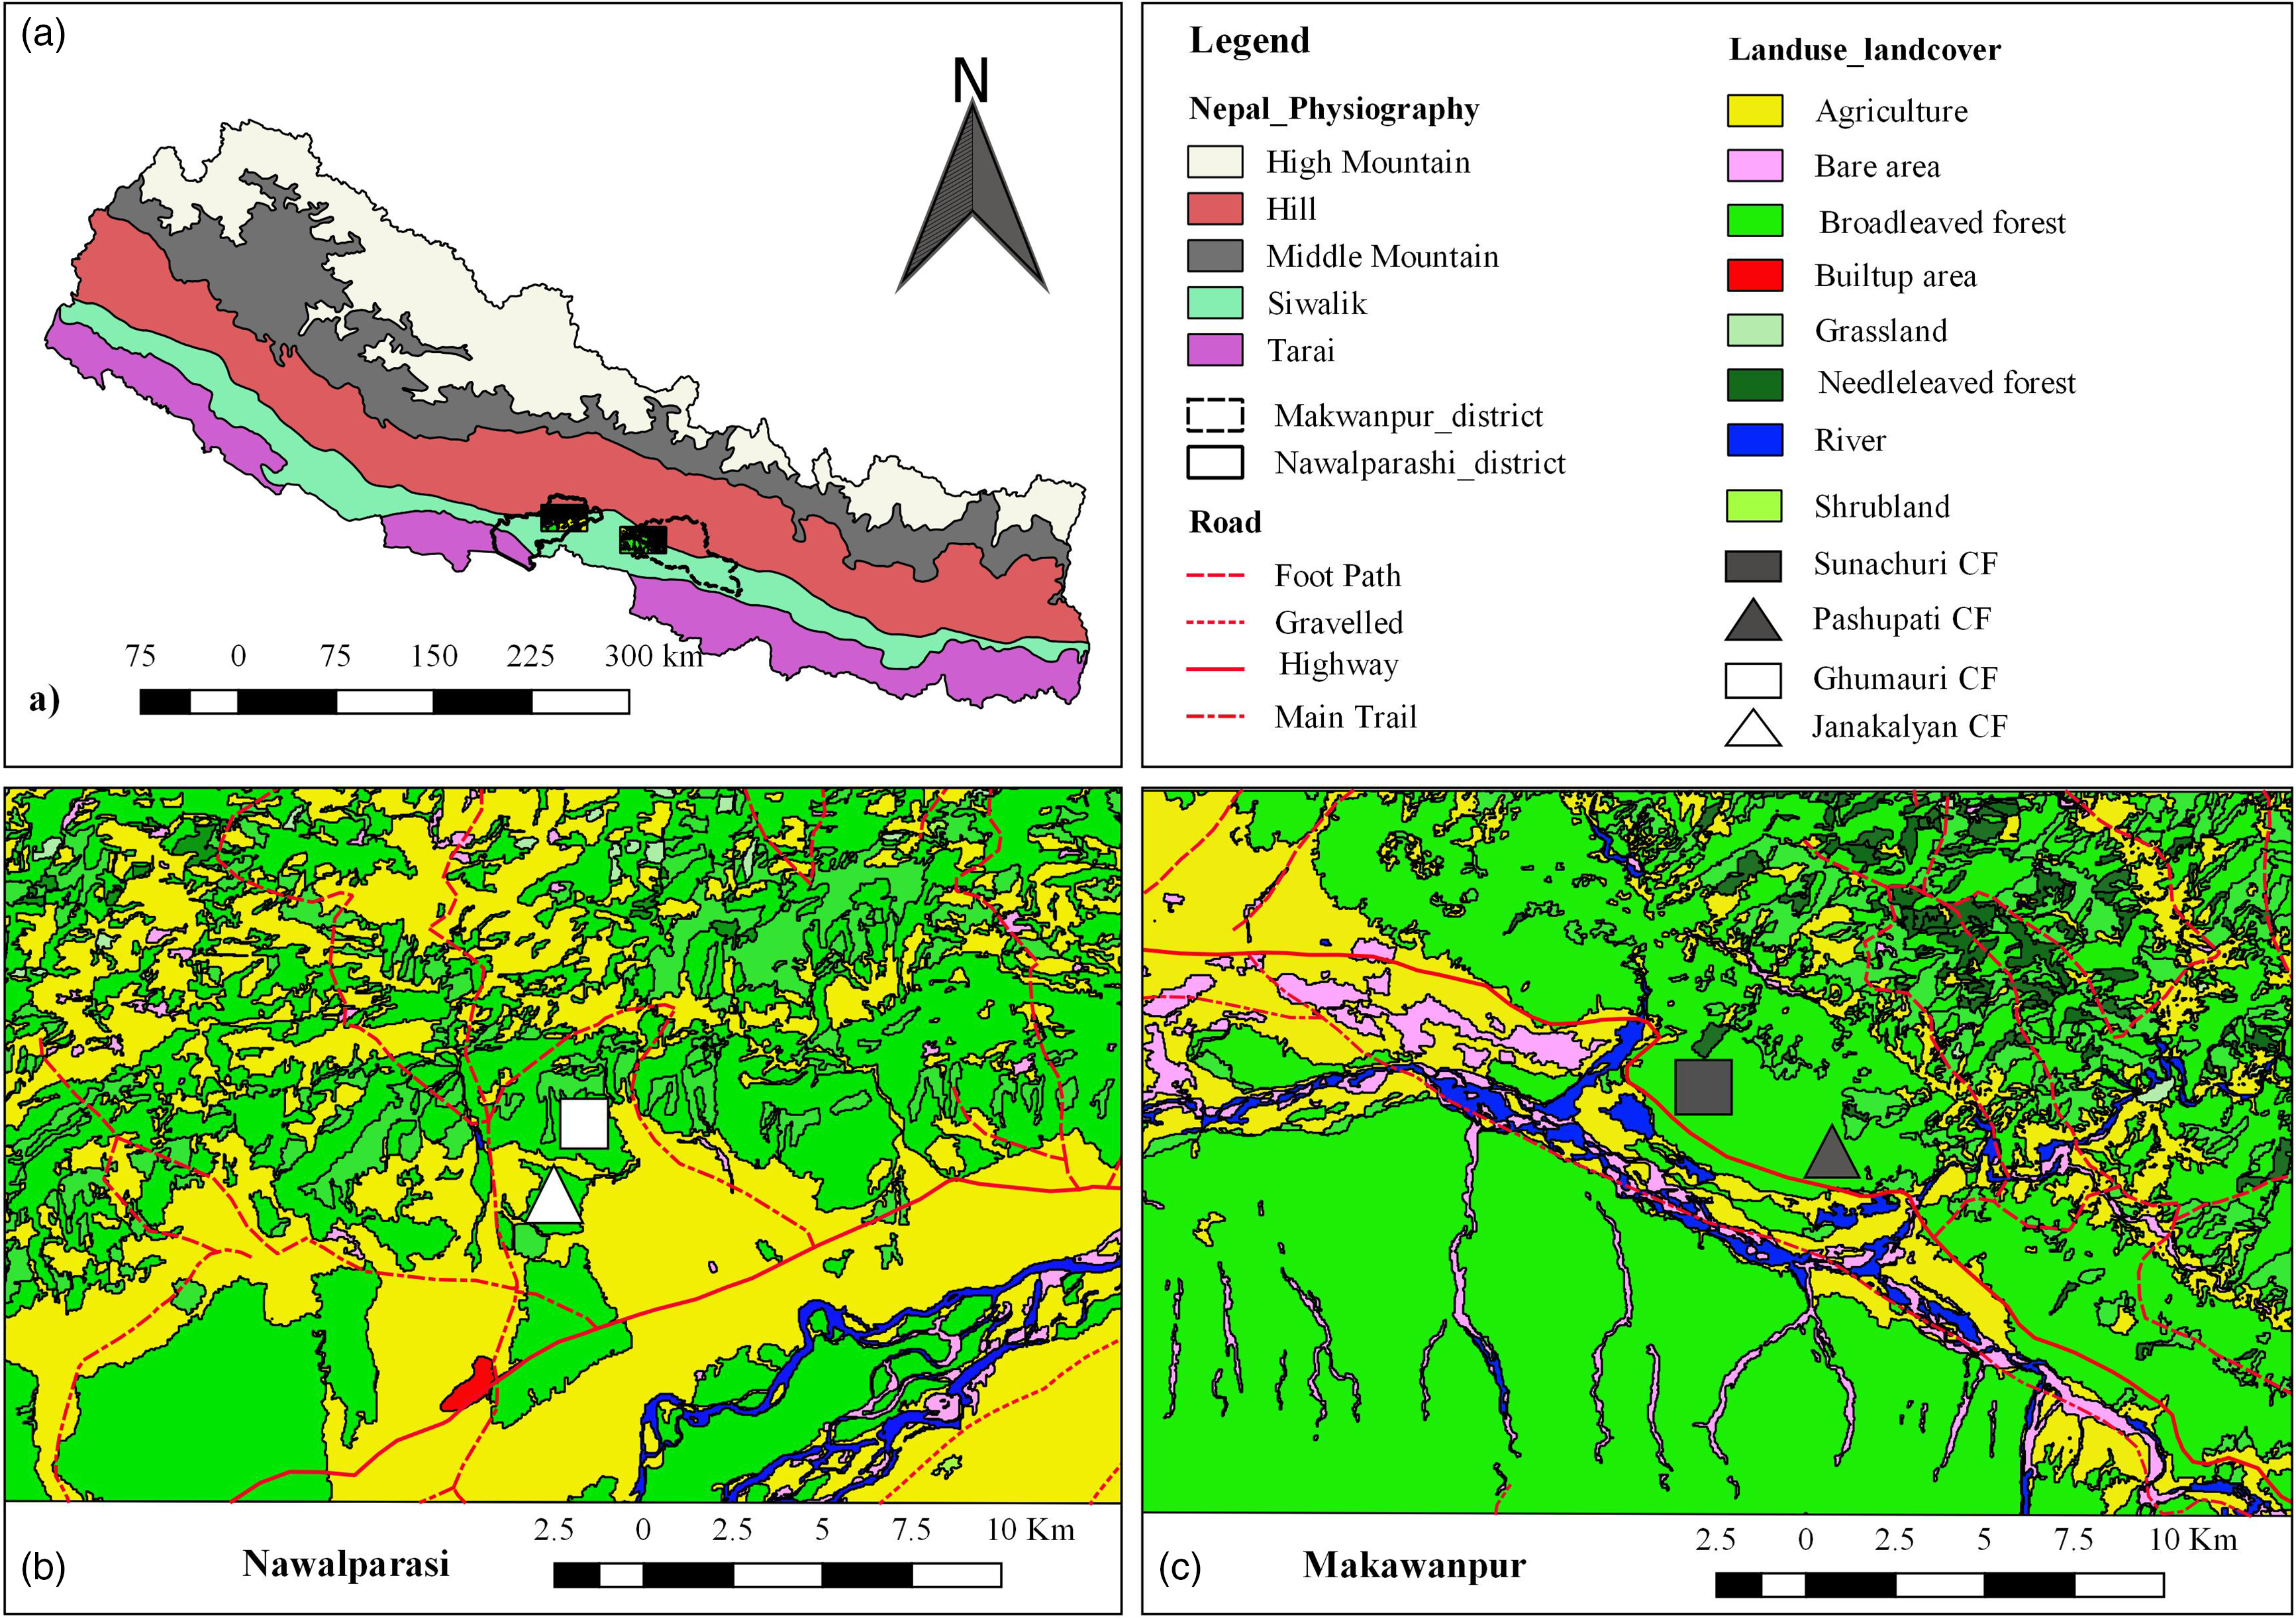
Figure 1. Maps showing the study areas: (a) Location of Nawalparasi and Makawanpur district in the physiographic regions of Nepal, (b) land cover of Nawalparasi site, (c) land cover of Makawanpur site.
All four forests in this study are located in the foot hills of the Siwalik (Churiya) range. The Siwalik range is geologically young, forming an east-west band of unconsolidated hills that runs parallel to the south of the main Himalayan ranges. Two forests (Sunachuri and Manakamana) faced southwest, while other two (Janakalyan and Ghumauri) faced south. Sampled forests contained some slopes and some flat land, with a maximum slope of 40 degrees.
The sampled forests are located between 200 and 550 m elevation (Table 1). The climate is subtropical and monsoonal, with hot and humid summers and cool dry winters. Average annual rainfall is 2,200 mm (recorded between 1971 and 2010) of which 80% falls during the monsoon (June–August), with an average annual temperature of 24.6°C recorded between 2000 and 2010 (CBS 2011). The forests in all four sites are dominated by Sal (Shorea robusta). Sal is a member of Dipterocarpaceae, a tropical family mainly distributed in the Indo-Malayan region. It forms extensive mono-dominant or mixed forests in the southern part of the Himalayas and in the tropical to subtropical areas of the Indian subcontinent (Gautam & Devoe Reference Gautam and Devoe2006). Sal is a robust, gregarious, semi-deciduous tree species, and an important high-value timber species extensively used in construction and furnishing. Dillenia pentagyna Roxb., Buchanania latifolia Roxb., and Mallotus philippensis (Lam.) Müll.Arg. are the main sub-canopy species in Sal forests. Clerodendrum viscosum Vent. is the most common native species of the shrub layer (Wesche Reference Wesche and K1997).
Focal invasive species
Chromolaena odorata (Commonly called Siam weed, Nepali name Seto Banmara ‘white forest killer’, family Asteraceae), is among the 100 worst invasive alien species of the world (Lowe et al. Reference Lowe, Browne, Boudjelas and De Poorter2000). It now occurs in more than 100 countries in Asia, Oceania, Africa, and America, and has been reported as a problematic invasive weed in more than 35 countries (https://www.cabi.org/isc/datasheet/23248#todistribution). It is a light-demanding species, flourishing in disturbed forests, roadsides, fallow, and abandoned lands. Its biological and morphological attributes (such as long tap root, production of large quantities of wind dispersed seeds, and relatively high specific leaf area) are shared by other IAPS, giving it a competitive advantage over native species (Joshi et al. Reference Joshi, De Leeuw and van Andel2006, Pyšek & Richardson Reference Pyšek and Richardson2008, Malahlela et al. Reference Malahlela, Cho and Mutanga2015, Rindyastuti et al. Reference Rindyastuti, Hapsari and Byun2021). C. odorata can grow to 3 m in height and forms a dense layer above the ground (Figure 2). This plant has already severely invaded the lowland districts of central and eastern Nepal at elevations below 1000 m and is now spreading into the western lowlands (Tiwari et al. Reference Tiwari, Siwakoti, Adhikari and Subedi2005).
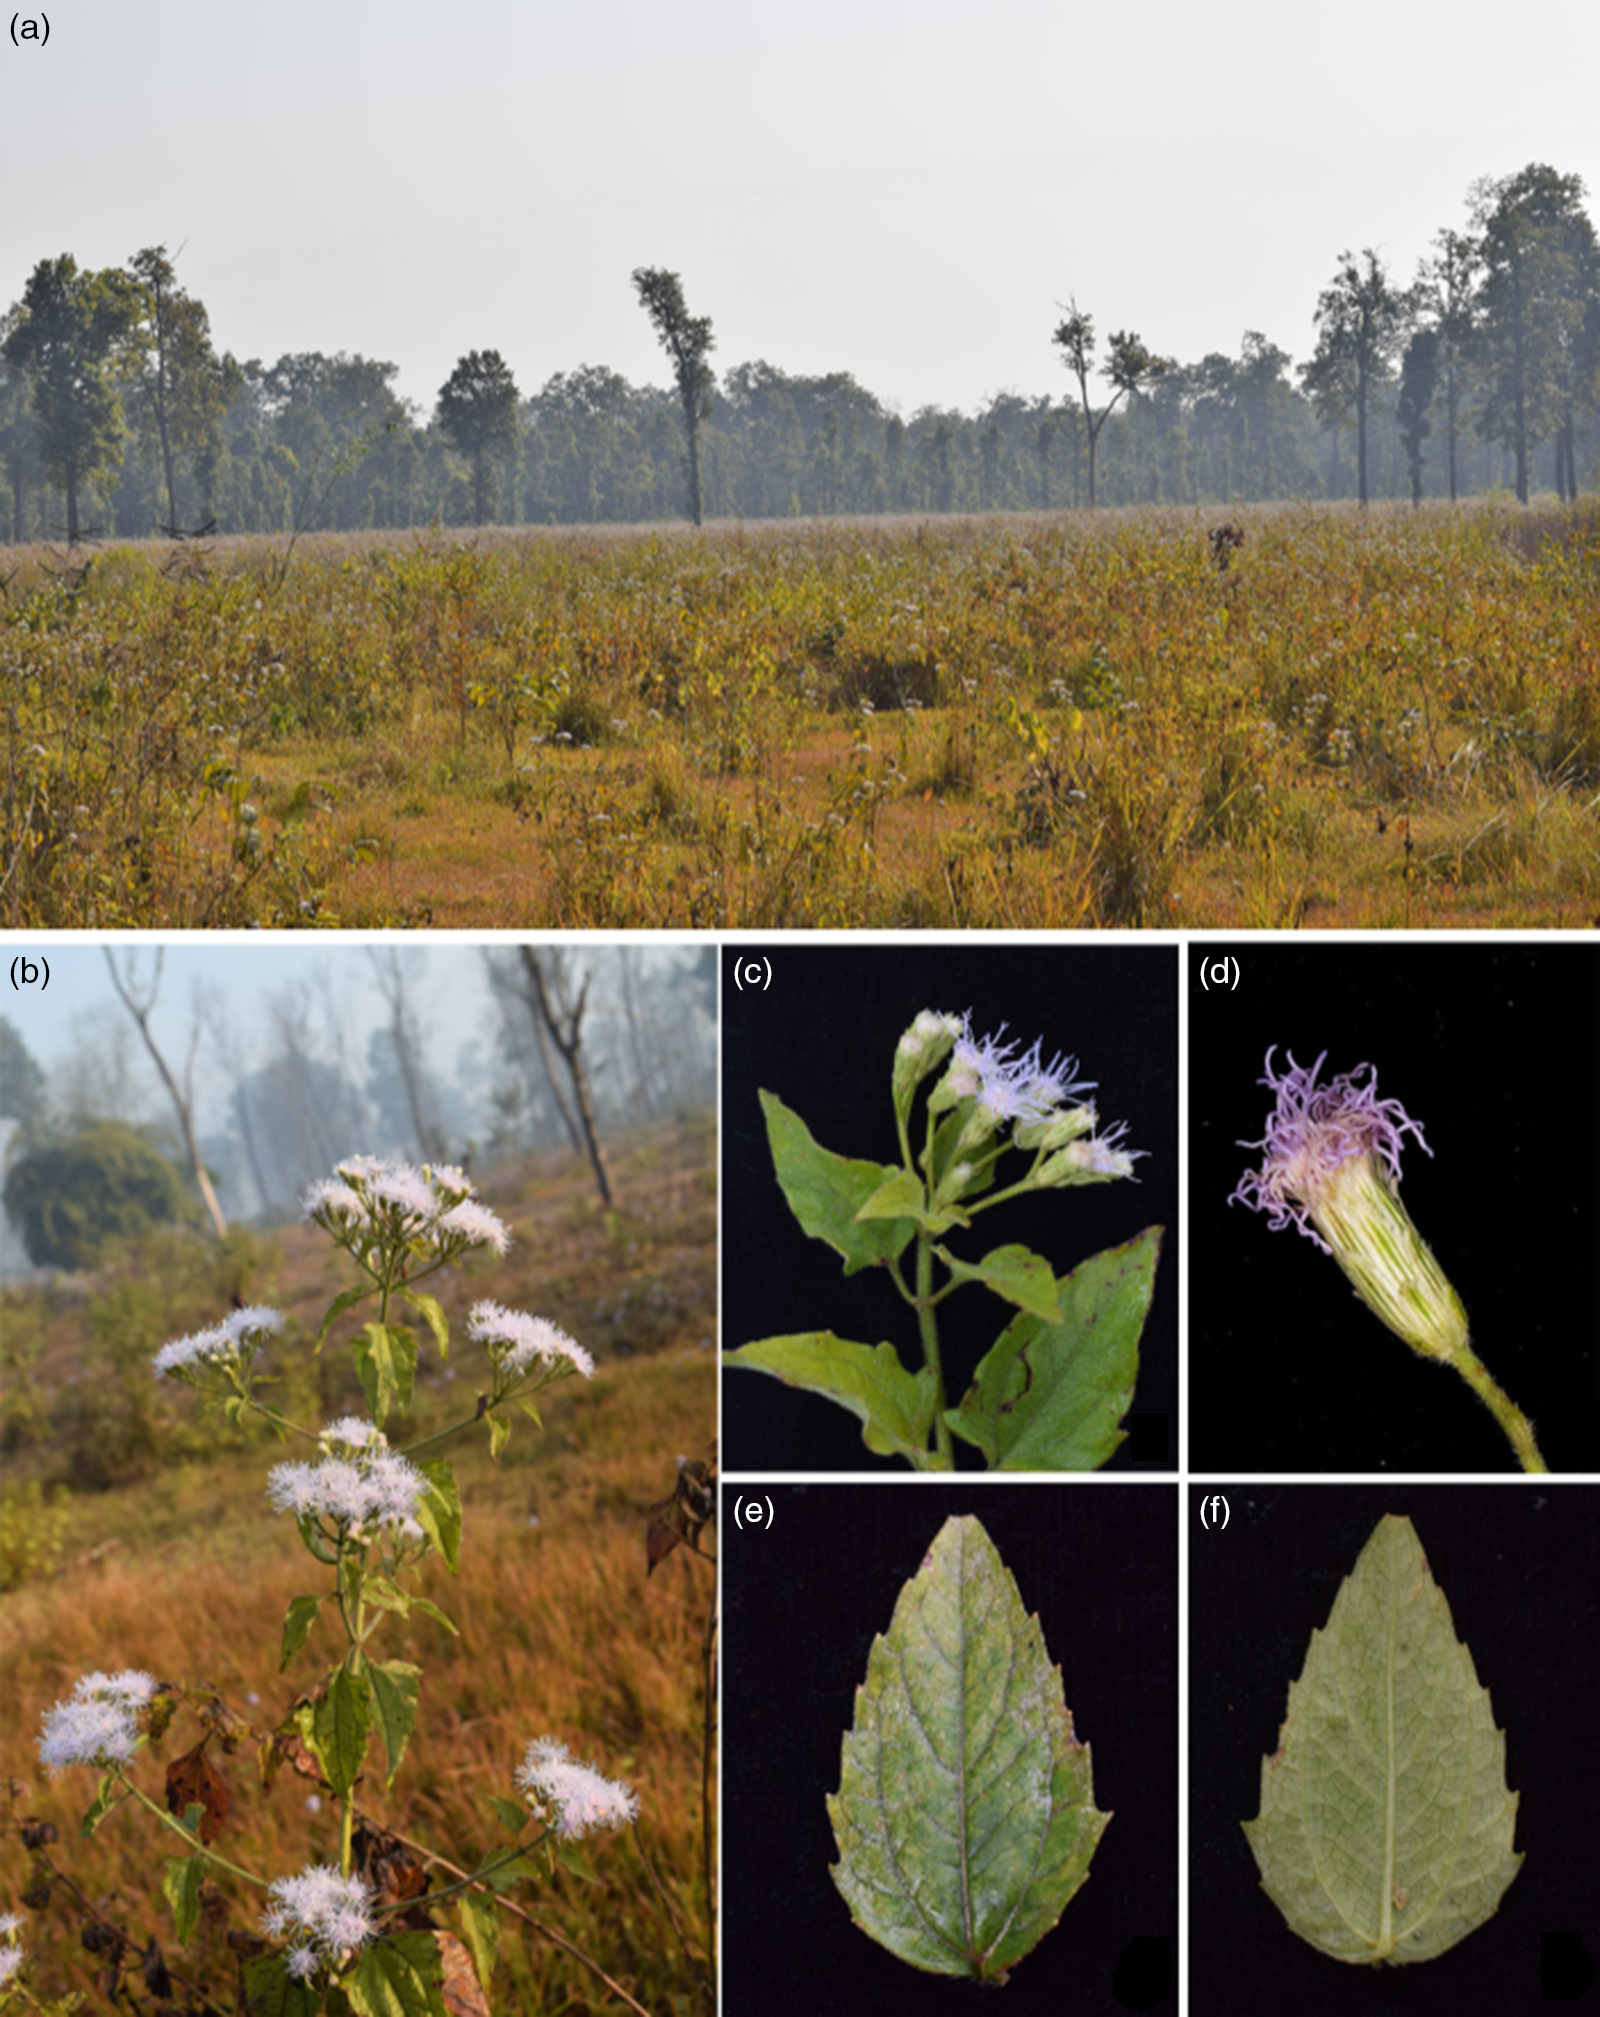
Figure 2. Chromoleana odorata morphology: (a) an open area invaded by the species; (b) flowerhead on stem; (c) inflorescence detail; (d) single flower head detail; (e, f) leaf dorsal and ventral surface showing margin and venation. Pictures are taken in Janakalyan community forest Nawalparasi.
Vegetation sampling
Vegetation sampling was conducted in November and December 2018. All the forests sampled were linked to a disturbance source, i.e. roads or human settlement. We sampled the vegetation along a belt transect from the disturbance source into the forest interior. In each forest, two transects were made. Before laying out the plot, the length of the transect and the number of plots were identified. The distance between plots was between 100 and 200 m, depending on forest size, and in each forest 28–30 plots were sampled.
Vegetation data were collected for plots of 10 × 10 m. Each plot was divided into four subplots of 5 × 5 m. Diameter at breast height (DBH) of all tree individuals greater than 5 cm DBH were measured within the plots. DBH was used to calculate the basal area (area = πr2) of trees in the plot; basal area of individual trees was summed up to get plot level basal area. Canopy cover above the plot was measured using a spherical densitometer, with four readings taken at each plot following the standard protocol (Lemmon Reference Lemmon1956).
C. odorata cover was estimated from the centre of each subplot. The cover of subplots was combined to estimate cover for the 100 m2 plot. The same method was used to estimate shrub and herb cover.
In each plot, two quadrats of 1 m2 were sampled randomly to record species richness. All herbaceous plants, shrubs, and tree seedlings were recorded in each quadrat.
In each plot, ground disturbance (grazing, tree/saplings lopping, and trampling) was recorded on a scale of 0 to 3, where 0 represents the absence of disturbance and 3 being severely disturbed. Plots lying between these two extremes were scored 1 and 2. Distance of the plot from the nearest road was measured using Google Earth Pro.
To evaluate how community forest user groups are managing C. odorata in the study sites, we interviewed community forest user group leaders (n=8, Chairman and Secretary in each Community Forest) and one local knowledgeable person as indicated by the Community Forest chairman (n = 4, one in each Community Forest). Similarly, we also interviewed community forest user group leaders (Chairman or Secretary) in 15 other community forest user groups in other parts of the country (Tanahu, Chitwan, Gorkha, Sindhuli, and Jhapa district) which had Sal forest with C. odorata invasion. Some informal discussions with local people were also conducted for each community forest visited in public areas where people gather to explore the general understanding of invasive species and their management.
Data analysis
For data analysis, rather than comparing individual forest, we pooled plot data together and analysed plot level data. Ground disturbance was calculated combining three variables i.e. grazing, lopping, and trampling, using principal component analysis (PCA). PCA first axis score was used to represent the ground disturbance complex. The predictor variables were checked for collinearity and only one of the collinear variables was selected for further analysis. C. odorata cover was the response variable. We used zero inflated beta regression to evaluate the impact of forest attributes on C. odorata cover as the response variable is a proportion and contains many zeros (Bürkner Reference Bürkner2017). Zero inflated beta regression is suitable when the response variable is vegetation cover and consists of proportion data between zero and one (Keim et al. Reference Keim, DeWitt, Fitzpatrick and Jenni2017). C. odorata cover was modelled against each covariate individually and significant covariates were chosen. A full model was run with C. odorata cover as response and with all the non-collinear independent variables (canopy cover, shrub cover, native richness, herb cover, disturbance complex, and distance) as predictors. Predictor variables that did not explain any variation in the model were subsequently dropped in the final model. Forest types (four community forests) were included as the random variable in the model. The final model included canopy cover, shrub cover, distance, and slope as predictor variables. The R package BRMS (Bayesian Regression Model using ‘Stan’) (Bürkner Reference Bürkner2017) was used for the regression analysis. The R2 for each model was calculated using add_criterion function of BRMS (Bürkner Reference Bürkner2017). Each predictor variable was centered and scaled by subtracting its mean and dividing by its standard deviation prior to regression analysis so as to facilitate model convergence as well as to make relative effect size of predictor variables directly comparable (Muscarella et al. Reference Muscarella, Emilio and Phillips2020).
We compared the differences in (i) C. odorata cover among canopy cover classes, and (ii) native species richness between invaded and non-invaded plots. Canopy cover was categorized as low, medium, and high. Values below the first quartile were considered low and those above third quartile were considered high. Values lying around the median were considered as medium. C. odorata cover among canopy cover class was visualized in box plots and compared using Kruskal–Wallis test.
All analyses were performed in R version 3.5.3 (R Core Team 2019).
Results
Shorea robusta was the most dominant canopy-forming tree species in all the community forests studied. A total of 120 native plant species were recorded from those four forests. Native species richness ranged from 1 to 20 species per plot with a mean of 11.41±3.48. In addition to C. odorata, six other invasive species, namely Spermacoce alata Aubl., Mesosphaerum suaveolens (L.) Kuntze, Ageratum conyzoides L., Mimosa pudica L., Senna tora (L.) Roxb., and Mikania micrantha Kunth) were also recorded. C. odorata was present in 60% of the plots with cover ranging from 0 to 95%.
Relationship between stand attributes and C. odorata cover
C. odorata cover was negatively correlated with canopy cover, shrub cover, basal area, and tree density. The strongest correlation was with forest canopy cover (r = −0.59) followed by basal area and tree density (Supplementary Table 1). Forest canopy cover was positively correlated with basal areas and tree density. Native species richness had a weak negative correlation with C. odorata cover. Native species richness had weak correlations with the measured stand attributes (Supplementary Table 1). Similarly, native species richness was not different between invaded and non-invaded plots (mean richness in invaded = 11.58 and non-invaded = 11.18), nevertheless the spread was higher in invaded plots (Supplementary Figure 1).
Environmental covariates affecting C. odorata cover
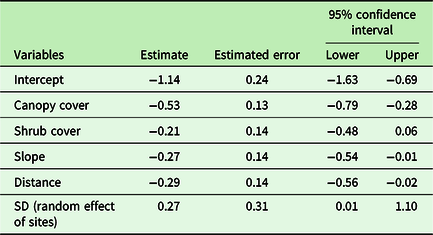
Regression models containing canopy cover, distance from a road, shrub cover, and slope had the highest mean r2 value. C. odorata cover declined linearly along the canopy cover gradient (Figure 3). Similarly, C. odorata cover declined linearly away from a road, with increasing shrub cover and slope (Supplementary Figures 2, 3, and 4). Canopy cover had the largest effect size on C. odorata cover, −0.53 (CI: −0.79, −0.28) while it has relatively lower error for the regression estimates (Table 2). Distance from a road had the second largest effect on C. odorata cover, i.e. −0.29 (−0.56, −0.02). Slope and shrub cover had relatively smaller effects (Table 2). Canopy cover, the most important stand attribute affecting C. odorata cover, in turn increased with increasing distance from the nearest road (Figure 4).
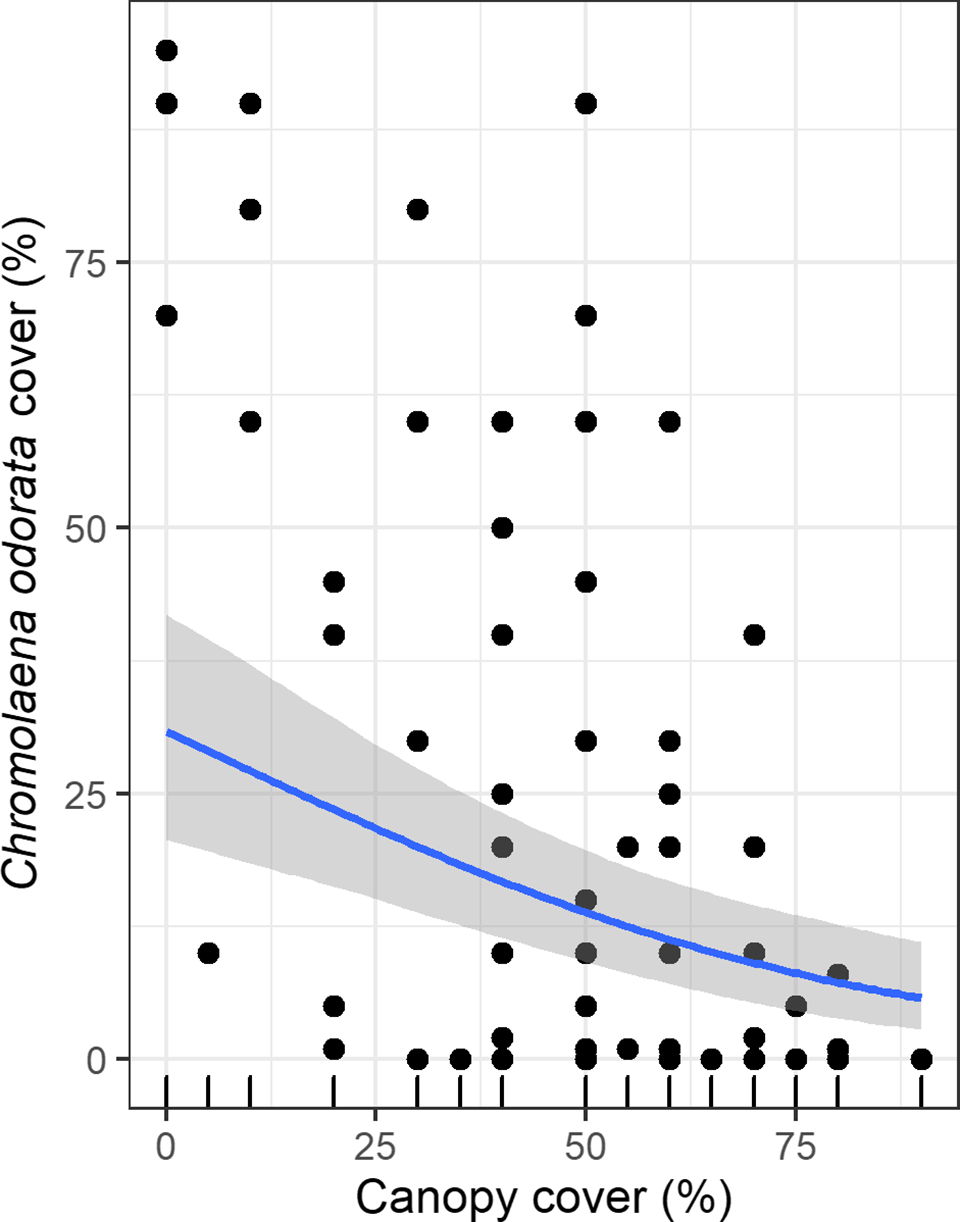
Figure 3. The relationship between C. odorata cover and canopy cover (%) showing the fitted line based on Bayesian regression analysis and its 95% confidence intervals around the fitted line.
Table 2. Model summary of Bayesian regression analysis where C. odorata cover is response and other forest attributes are predictors.

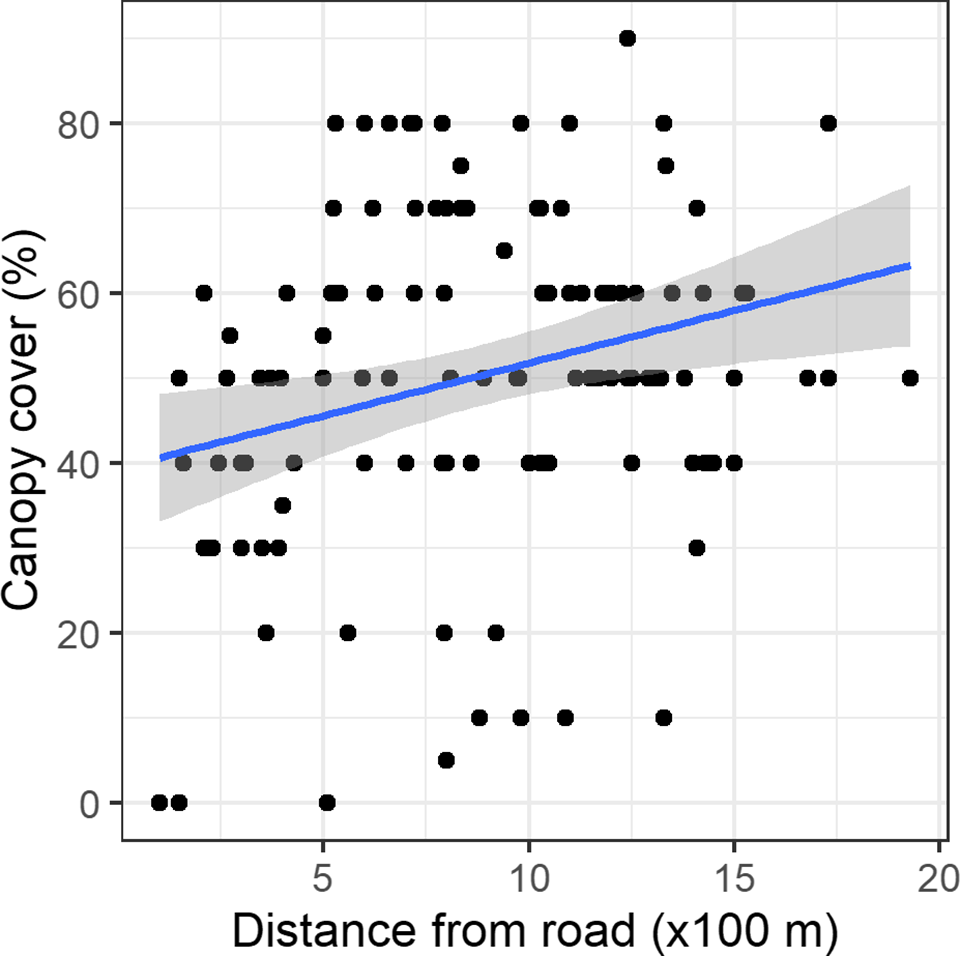
Figure 4. Relationship between canopy cover and distance to the nearest road along with the fitted linear regression line and its 95% confidence intervals around the fitted line.
C. odorata cover did not show any trends with native species richness, herb cover, and ground disturbance complex.
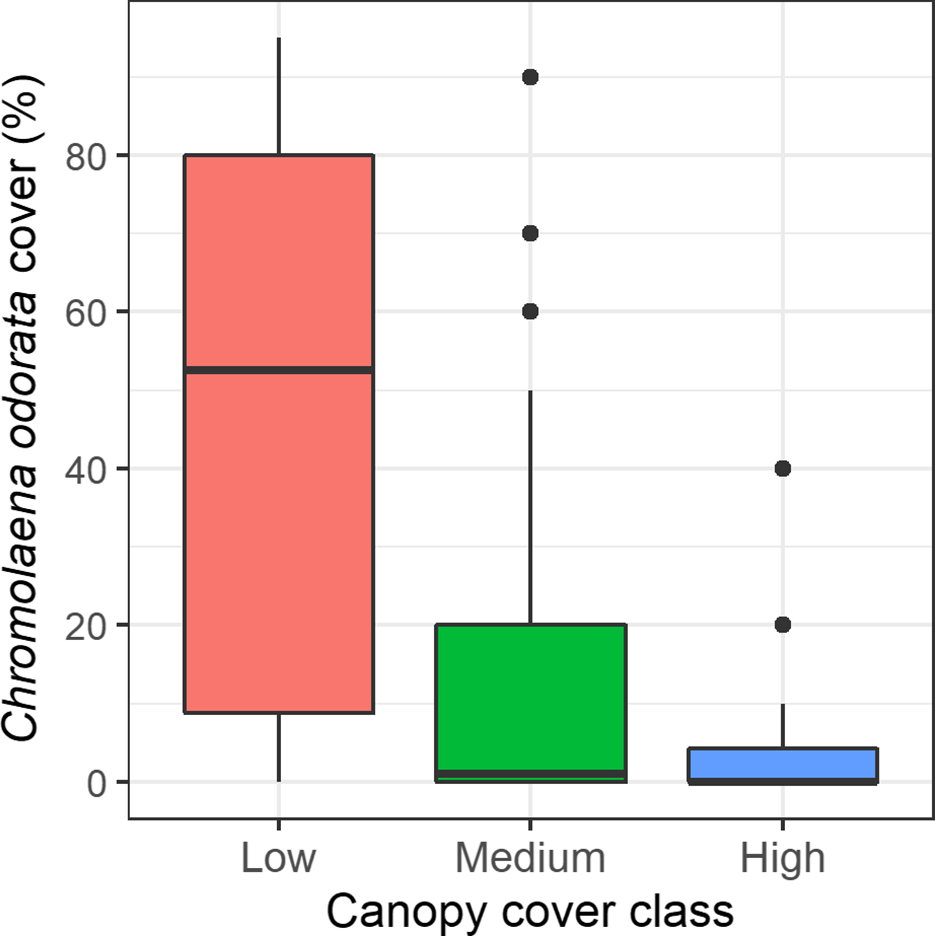
C. odorata cover was different among the canopy cover classes (Figure 5). Its cover was highest (mean±SE, 34.03±5.22) in forests with low canopy cover, and lowest (4.08±1.74) when canopy cover was higher. Its mean cover was 12.98±3.13 when canopy cover was moderate. The Kruskal–Wallis test showed that C. odorata cover was different between the canopy cover classes (H,2 = 18.806, p<0.001).

Figure 5. Box and Whisker plot showing C. odorata cover in different canopy classes. The medians (horizontal line), whiskers (vertical line), and outliers (points) above the maximum value and interquartile range are indicated in the plot.
Invasive species in forest management
We recorded that community forest user groups are organizing regular bush clearing (jhadi safai) of understory plants in their forests. However, these activities generally occur in forested areas and rarely occur in open parts invaded by Chromolaena odorata. Community forest user groups did not have any specific programs targeting C. odorata or other invasive plants, and their forest management plans did not recognize invasive species as a problem.
Discussion
The results demonstrate that forest stand attributes and other environmental variables affect the cover of C. odorata in the Sal forests of Nepal. We discuss how attributes of Sal forests determine the cover of invasive species and highlight the practical relevance of these findings to the management of community and other fragmented or otherwise disturbed forests.
Canopy cover is the overriding covariate affecting C. odorata cover
We have demonstrated that canopy cover, shrub cover, slope, and distance from a road all have some effect on C. odorata cover in Sal forest. C. odorata cover declines gradually away from the roadside which is probably due to high propagule pressure along roads. Roadsides in turn have lower canopy cover and more open areas, and are important driver of invasion from local to the regional level (Flory & Clay Reference Flory and Clay2006, Follak et al. Reference Follak, Schleicher and Schwarz2018). Roads bring propagules as well as create disturbances and open spaces (vacant niches), which consequently favour invasion. Roads provide corridors for invasive species, connecting them with suitable habitats, therefore, roadsides and forest edges often have a high density of invasive species (Benedetti & Morelli Reference Benedetti and Morelli2017, Follak et al. Reference Follak, Schleicher and Schwarz2018).
Accessible parts of Sal forests are subjected to anthropogenic disturbances involving lopping trees, cutting saplings, and trampling of the ground during firewood and fodder collection (Sharma et al. Reference Sharma, Grytnes, Måren and Vetaas2016). Anthropogenic disturbance has been shown to be an important variable affecting invasive species in ecosystems including forests (Fuentes-Lillo et al. Reference Fuentes-Lillo, Lembrechts and Cavieres2021, Mungi et al. Reference Mungi, Qureshi and Jhala2021). Counterintuitively, we found that ground disturbance had a very weak correlation with C. odorata cover, and it did not improve the regression model, which indicates that ground disturbance is not a major factor governing the cover of C. odorata in forests in this study.
Canopy cover showed a negative relationship with C. odorata cover in Sal forest. In the composite model containing disturbance, and distance to disturbance sources, forest stand level canopy cover was the overriding factor in determining C. odorata cover. C. odorata cover declined linearly with increasing canopy cover. In general, this negative relationship supports previous studies reporting C. odorata as a light-demanding species preferring to grow in well-illuminated areas (Joshi et al. Reference Joshi, De Leeuw and van Andel2006). In addition, as C. odorata is an understory shrub, it cannot compete with trees for light, consequently the canopy trees limit this crucial resource for C. odorata. Joshi et al. (Reference Joshi, De Leeuw and van Andel2006) also found that seed production of C. odorata is suppressed with low light intensity. Similarly, lower light intensity also retards the germination of C. odorata seeds (Chauhan & Johnson Reference Chauhan and Johnson2008). Higher canopy cover implies lower level of light availability below the forest canopy. Many IAPS prefer to grow in open areas in forests and forest ecotones (Mavimbela et al. Reference Mavimbela, Sieben and Procheş2018). Open areas in forests provide sites for regeneration and growth of IAPS and have higher proportion of IAPS density and coverage compared to closed-canopy areas (Charbonneau & Fahrig Reference Charbonneau and Fahrig2004, Driscoll et al. Reference Driscoll, Angeli and Gorchov2016). Nevertheless, the impact of canopy density may also be dependent on the nature of invading species, as shade-tolerant invasive species may be favoured where there is a dense canopy (Martin et al. Reference Martin, Canham and Marks2009).
Native species richness and C. odorata cover
Conventional diversity resistance hypothesis asserts that sites with higher species richness have lower susceptibility to exotic invasions, mainly at local scale (Fridley et al. Reference Fridley, Stachowicz and Naeem2007). However, this hypothesis is not always supported by empirical studies (Peng et al. Reference Peng, Kinlock, Gurevitch and Peng2019); some studies corroborate the hypothesis (Kennedy et al. Reference Kennedy, Naeem and Howe2002, Beaury et al. Reference Beaury, Finn and Corbin2020) while others refute it (Wiser et al. Reference Wiser, Allen, Clinton and Platt1998). Alternatively, it is also argued that native species may even facilitate invasion (Fischer et al. Reference Fischer, Von Der Lippe and Kowarik2009). Our study in the Sal forests showed that C. odorata cover is not correlated with the higher levels of native biodiversity-species richness. Our results are contrary to those of a prior study (Thapa et al. Reference Thapa, Kaewchumnong, Sinkkonen and Sridith2016) in similar forest from the region who reported non-invaded plots to be richer than invaded plots, however, we differ in our sampling approach and richness of the study system. Most of the published analyses of the effect of native richness on invasion comes from studies on grasslands (Kennedy et al. Reference Kennedy, Naeem and Howe2002, Peng et al. Reference Peng, Kinlock, Gurevitch and Peng2019), and diversity-resistance experiments in forest systems are scarce. The main mechanism for invasion resistance is thought to be competition. It has been suggested that richness alone may not resists invasion, rather there may be a role of other factors co-varying with diversity which may contribute to the invasion resistance of communities. In our case, forest canopy cover appears to be a more important factor than species richness with respect to community competitiveness to invasion resistance.
Management implication
C. odorata is one of the world’s worst IAPS (Lowe et al. Reference Lowe, Browne, Boudjelas and De Poorter2000). National policy documents categorize its impacts as ‘massive’ in Nepal and its distribution in the Himalayas is expected to expand with climate change (Shrestha & Shrestha Reference Shrestha and Shrestha2019). This species, along with other invasive species, demand immediate action so that their expansion to new location can be curtailed. The existing biomass needs to be controlled so that ecological and biodiversity loss can be prevented.
The Community Forestry Program in Nepal is exemplary in restoring degraded forests and has played a key role in increasing forest cover and averting deforestation in Nepal (Niraula et al. Reference Niraula, Gilani, Pokharel and Qamer2013). Local people have also observed that C. odorata abundance is suppressed with forest protection and canopy closure (Personal communication). Although community forests do not have specific plans and activities to control C. odorata, it appears that they have unwittingly played an important role in controlling C. odorata in forests by protecting forest and increasing forest canopy. Control of invasive species through increased forest cover could be an ‘undocumented contribution’ of community forestry program of Nepal. However, additional data are needed from different physiographic regions and socio-economic settings to evaluate this hypothesis.
Our findings have immediate practical relevance in forest management. Community forests are mostly small patches of forest interspersed with settlement and agriculture. These forest patches are subjected to disturbance associated with biomass extraction, grazing, and forest silviculture, and many community forests are potentially vulnerable to invasion by C. odorata. Community forests should consider enhancing forest canopy cover to suppress the growth of C. odorata (Khaniya & Shrestha Reference Khaniya and Shrestha2020). Currently, Nepal has adopted intensive silvicultural practices in Sal forests. Tree felled and canopy opened areas are highly susceptible to invasion by C. odorata, therefore, such patches within forests should be monitored regularly to control potential invasion by the species.
The results of this study showed that forest areas along roadsides have a higher cover of C. odorata. Intact forest margins along roads potentially buffer propagule dispersal towards forest interiors (Cadenasso & Pickett Reference Cadenasso and Pickett2001). Therefore, increasing tree density and forest crown along roadsides could be a strategy to control the cover and control the spread of C. odorata in fragmented forests. Restoring degraded forests and increasing tree crown along roadsides and open areas can suppress C. odorata and other IAPS while also gaining other forest ecosystem services.
Conclusion
Our study clearly indicated that forest canopy cover can resist the invasion of C. odorata in Sal forests. The resistance mechanism could be related to resource limitation, primarily light, to the invading species. Disturbance of the ground or undergrowth is probably not a primary driver facilitating invasion in forest when the invading species is light-demanding, as is C. odorata. Our results provide practical insights for the management of Sal forests and degraded areas to avert invasion by invasive species, and they may apply to other forest types and other light-demanding IAPS.
Supplementary material
To view supplementary material for this article, please visit https://doi.org/10.1017/S0266467421000456
Acknowledgements
We would like to thank Laxman Paudel, Chandra Bahadur KC, Ram Chandra, and Raju Bhandari for their help during the fieldwork. This study was supported by the Darwin Initiative UK (Project 23-031).