


Introduction
Over the last forty years, considerable research has been devoted to polar ecosystems, which are generally considered to be the last pristine environments on Earth. Antarctica is the coldest, driest, highest, windiest and most isolated continent and therefore is nearly unaffected by anthropogenic influence. Because of this, Antarctica is scientifically fascinating and it is a unique natural laboratory.
The study of marine sediments represents an important tool to reconstruct past conditions in the ocean. Sediments are also studied for their role in controlling the chemical composition of seawater. They constitute reservoirs of bioavailable trace elements which act as micronutrients, but can also have toxic effects and cause perturbations to the ecosystem (Gleyzes et al. Reference Gleyzes, Tellier and Astruc2002). For this reason, metal accumulation in sediments poses an environmental problem because metals may transfer from these samples to aquatic media (Filgueiras et al. Reference Filgueiras, Lavilla and Bendicho2002).
The determination of total metal concentration in sediments gives information about overall pollution levels, but it is inadequate as a measure of their potential mobility and their bioavailability to living organisms. Indeed, it is widely recognized that bioavailability and mobility of pollutants strongly depend on their specific chemical binding, on their affinity for either organic or inorganic compounds and on redox potential and pH changes of the surrounding area (Lietz & Galling Reference Lietz and Galling1989, El Bilali et al. Reference El Bilali, Rasmussen, Hall and Fortin2002, Eggleton & Thomas Reference Eggleton and Thomas2004). In environmental studies, many sequential extraction techniques have been developed to estimate metal bioavailability and mobility. Sequential extraction procedures consist of subjecting a given sediment sample to a series of increasingly strong reagents under specified conditions. In general, different reagents or extractants leach the precipitated, adsorbed or complexed metal portions step by step in order to simulate the various possible natural and anthropogenic modifications of environmental conditions (Gleyzes et al. Reference Gleyzes, Tellier and Astruc2002). The results obtained mainly depend on the extractants and operative conditions in which the extraction is accomplished and therefore they are operationally defined (Nirel & Morel Reference Nirel and Morel1990, Gupta et al. Reference Gupta, Vollmer and Krebs1996, Sahuquillo et al. Reference Sahuquillo, López-Sánchez, Rubio, Rauret, Thomas, Davidson and Ure1999). In many cases, the following classes of extractants are sequentially used: salts of strong acids and bases or salts of weak acids and bases (e.g. MgCl2 or CH3COONH4), to release exchangeable metals; dilute acids or acetate buffer, which extract the acid-soluble portion; reducing agents (commonly hydroxylamine at acidic pH, but also oxalate or sodium dithionite), able to give rise to the dissolution of iron and manganese oxides, and consequently of the metal ions associated with them; oxidising agents (commonly hydrogen peroxide with HNO3, but also sodium hypochlorite or sodium pyrophosphate) to obtain the decomposition of sulphides and of organic matter and the release of metals sorbed into it; and strong concentrated acids at high temperature, to extract metals strongly bound to the matrix including silicate-bound metals, if HF is used (Gleyzes et al. Reference Gleyzes, Tellier and Astruc2002). Some extraction schemes do not involve all these kinds of reagents, whereas others add further steps, e.g. solubilisation with water or use of two or more reducing agents in sequence, in an attempt to distinguish between iron and manganese oxides. For a critical study of the comparison between different sequential extraction schemes with widespread use, including remarks on the reagents used and their selectivity, see the review by Filgueiras et al. (Reference Filgueiras, Lavilla and Bendicho2002). Although these schemes have been criticized for the complexity of the procedure and the problems connected, they remain and represent an essential tool in environmental research (Bacon & Davidson Reference Bacon and Davidson2008). Previous studies in East Antarctica have confirmed the importance of sequential procedure as methods to better understand the metal contamination and therefore the impact on the marine ecosystem (Larner et al. Reference Larner, Seen, Palmer and Snape2007).
This paper reports on the results of a geochemical investigation performed on a sediment core called H2, collected from the Ross Sea, Antarctica. In the first part, the total concentrations of Al, As, Ba, Ca, Cd, Co, Cr, Cu, Fe, K, La, Mg, Mn, Na, Ni, P, Pb, Sr, Ti, V and Zn have been determined in all of the samples. Then, the modified Community Bureau of Reference (BCR) three-step sequential extraction procedure has been applied to obtain the fractionation of Cu, Cr, Fe, Mn, Ni, Pb and Zn. In the last part, this protocol has been compared with the well-known five-step Tessier's protocol (Tessier et al. Reference Tessier, Campbell and Bisson1979) to evaluate the efficiency, the advantages and disadvantages of both procedures. The experimental results have been interpreted with the aid of chemometric techniques.
Experimental procedure
Sample description and pretreatment
This study was carried out on a marine sediment core named H2, sampled on 23 January 2004, during the Italian expedition 2003–04 to Antarctica. The cruise was part of the activities of the Italian National Program for Research in Antarctica (PNRA). H2 was sampled in Terra Nova Bay (in the Ross Sea) with a box core. It comes from a site called H at 75°10′S and 176°16.6′W, at a depth of 739 m (Frignani et al. Reference Frignani, Giglio, Accornero, Langone and Ravaioli2003). H2 is 11 cm long and characterized by the presence of tiny exoskeletons of marine organisms and several reddish fragments of coral. To our knowledge, this is the first sediment core from that area in which corals were found. The box corer was designed to collect samples up to 50 cm long. The short length of core H2 is due to the fact that the box corer could not penetrate further in the sediment bed, presumably because of the presence of resistant coral fragments. Core dating has not been calculated yet, but in general the sediment accumulation rates in the Ross Sea are very low. In 2003 a value of the order of 1.7 cm ky-1 associated with a flux of 18.80 g m-2 y-1 for sediments from the same area of this study was estimated (Frignani et al. Reference Frignani, Giglio, Accornero, Langone and Ravaioli2003).
Following sampling, the core was stored in a poly(methyl methacrylate) tube at -25°C during transportation, then subsampled in 11 one-centimetre thick sections using a nylon string. The sections, hereafter called H2-0 to H2-10, were stored in precleaned polycarbonate bags. Before analysis, samples were left to thaw out and air-dry. Visible marine organisms and corals were removed by plastic tweezers, and corals were collected separately. Sediment samples were ground using a ceramic mortar with two different size pestles in order to get a well-powdered sample. The particle size ranged between 200 and 53 μm for more than 70% of the powder (for particle size distribution see Table S1, which can be found at http://dx.doi.org/10.1017/S0954102012000685). After that, each section was collected and stored in polycarbonate bags, previously washed with sub-boiling 0.01 M HCl, and rinsed several times with ultrapure water. In order to avoid contamination, all these steps were accomplished in a controlled atmosphere laboratory under a Class-100 laminar flow bench-hood.
Apparatus and reagents
A Varian Liberty 100 Inductively Coupled Plasma-Atomic Emission Spectrometer (ICP-AES) equipped with a V-groove nebulizer was used to determine the concentrations of Al, Ba, Ca, Cr, Cu, Fe, K, La, Mg, Mn, Na, P, Sr, Ti, V and Zn in all the samples, Co only in the H2-2, H2-3 and H2-7 samples, and Ni in all the samples with exception of the H2-0 and H2-9 samples.
Element concentrations close to or lower than the detection limits for ICP-AES, namely As and Cd in all the samples, Co in all the samples with the exception of H2-2, H2-3 and H2-7, and Ni in the H2-0 and H2-9 samples, were determined with a Perkin Elmer Analyst 600 or a Perkin Elmer 5100 Graphite Furnace Absorption Spectrometer (GF-AAS) equipped respectively with THGA (transverse heated graphite atomizer) and HGA (heated graphite atomizer) graphite platform-integrated tubes and Zeeman-effect background correction.
Pb was measured with Anodic Stripping Voltammetry (ASV) using a Metrohm 746 VA Processor voltammeter equipped with a hanging mercury drop electrode, a platinum counter electrode and an Ag/AgCl reference electrode. The samples were driven to the electrochemical cell by an autosampler and standard additions were performed with Dosino dispensers. All the reagents used were analytical grade. Acids were purified by sub-boiling distillation in a quartz still (K. Kurner) and Milli-Q high-purity water (HPW) was used throughout. Metal standard solutions were prepared from concentrated stock solutions (Merck Titrisol).
Procedures
First, the moisture content of the sediment was determined by drying a subsample at 105°C for 24 h until constant mass was attained. Moisture contents (Table S2, which can be found at http://dx.doi.org/10.1017/S0954102012000685) were used to calculate all sediment characteristics on a dry mass basis. Subsequently, total metal concentrations were determined in all the samples. After that, two sequential extraction procedures were carried out.
Determination of total metal concentrations
Before the measuring step, an acid digestion in a microwave oven was chosen as dissolution procedure (Milestone MLS-1200 Mega). Sample aliquots of 100 mg were treated with a mixture of 5 ml of aqua regia and 2 ml of hydrofluoric acid in polytetrafluoroethylene (PTFE) bombs. Four heating steps of 5 min each (250, 400, 600, 250 W power respectively), followed by a ventilation step of 25 min, were applied. Then 0.7 g of boric acid was added, the bombs were further heated for 5 min at 250 W and again cooled by a ventilation step of 15 min. At the end of the full treatment, the samples appeared completely dissolved. Finally the resulting solutions were diluted to 50 ml with HPW (Malandrino et al. Reference Malandrino, Abollino, Buoso, Casalino, Gasparon, Giacomino, La Gioia and Mentasti2009). The same procedure was carried out to prepare the blank solutions. The values of the blanks are reported in Table S3, which can be found at http://dx.doi.org/10.1017/S0954102012000685.
Depending on the concentration level, metal determinations were performed by different techniques: ICP-AES, GF-AAS or ASV (Table Ia). External calibration was used for ICP-AES and GF-AAS, whereas the standard additions method was adopted for ASV. The standard solutions for the calibrations were prepared in aliquots of blanks. All experiments were executed in triplicate and blanks were run simultaneously. The relative standard deviations of the results were generally within 5%. The analytical trueness of the procedure was evaluated through the analysis of standard reference materials (NIST SRM 2702 Marine sediment, Table S4a, which can be found at http://dx.doi.org/10.1017/S0954102012000685). All the data for core H2 have also been normalized using Al as a terrigenous reference in order to correct the concentrations for the natural variability. Indeed Al has a conservative behaviour and it is also inert during diagenesis (Malandrino et al. Reference Malandrino, Mentasti, Giacomino, Abollino, Dinelli, Sandrini and Tositti2010).
Table I Analytical instrumental techniques used to determine a. the total element concentrations, and b. the metal concentration for each fraction of Community Bureau of Reference (BCR) and Tessier's sequential extraction procedures.
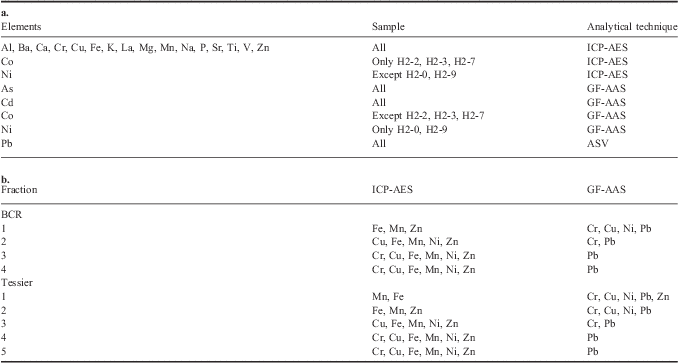
ICP-AES = Inductively Coupled Plasma-Atomic Emission Spectrometer, GF-AAS = Graphite Furnace Absorption Spectrometer, ASV = Anodic Stripping Voltammetry.
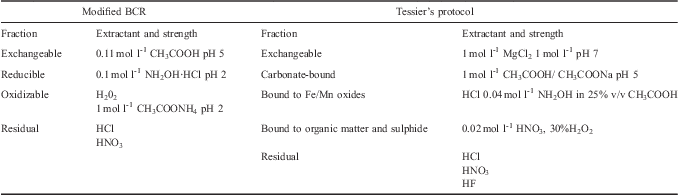
Sequential extractions: modified BCR three-step sequential extraction procedure
The sequential extraction protocol proposed by the BCR was applied in its revised form (Quevauviller Reference Quevauviller2002) to fractionate the total contents of eight elements, namely Cd, Cr, Cu, Fe, Mn, Ni, Pb and Zn. This protocol consists of the following four steps (Fig. 1a):

Fig. 1 Flowcharts of the sequential extraction procedures. a. Modified Community Bureau of Reference (BCR), and b. Tessier's scheme.
1) Exchangeable, water and acid-soluble fraction: this is released by varying the pH of the sample with acetic acid (0.11 M). After a shaking step, the supernatant is stabilized by addition of 100 μl of concentrated HNO3.
2) Reducible fraction: it is labilised in reducing conditions adding hydroxylammonium chloride to the residue obtained in step 1.
3) Oxidizable fraction: released by treating the residue of step 2, twice, with hydrogen peroxide (8.8 M). The resulting solution is then reduced to a few millilitres and ammonium acetate is added.
4) Aqua regia-soluble fraction: 10 ml of aqua regia are added to the remaining residue and the whole suspension is transferred into PTFE bombs. The same heating programme applied for the determination of the total concentration is performed and, at the end of the treatment, the resulting solutions are filtered with a cellulose acetate filter (Whatman 401) and diluted to 50 ml with HPW.
Extracts were analysed by ICP-AES or GF-AAS (Table Ib) using standard solutions prepared in aliquots of sample blanks. To determine Cd and Pb in the extracts of the third fraction, it was necessary to use the standard additions method. Matrix modifiers were employed to determine Cd, Cr, Cu and Pb by GF-AAS.
The relative standard deviations of the results were generally within 10% (n = 3). Higher uncertainties were observed, in some cases, when low concentrations were extracted. The analytical trueness of the data was confirmed by applying the sequential extraction procedure to a standard reference material BCR 701, Lake sediment (see Table S4b). Quality assurance of the BCR technique was measured by comparison of the sum of the four BCR steps to the independent aqua regia extraction of the standard reference material used, with the four steps of the BCR procedure extracting 88–101% of the elements recovered by aqua regia digestion.
The extraction procedure was applied to eight samples chosen from H2 according to the results of the chemometric data treatment for total concentrations (see Multivariate techniques section and Total metal contents: results and chemometric investigation section). We chose the sections representative of the groups identified by chemometrics, namely H2-0, H2-1, H2-3, H2-4, H2-6, H2-8, H2-9 and H2-10. In particular, H2-0, H2-1, H2-4 and H2-10 have been chosen for their distinctive behaviour compared with the others, whereas H2-8 and H2-9 have been selected in order to investigate the biogeochemical aspect, i.e. the unique presence of the coral in this core. Although the names given to the fractions in the protocol were intentionally unrelated to geochemical phases, since sequential extraction results are operationally defined, the partitioning of elements in the BCR scheme is interpreted by several authors (Bacon & Davidson Reference Bacon and Davidson2008, Rao et al. Reference Rao, Sahuquillo and Lopez Sanchez2008), as follows: first fraction: water-soluble, exchangeable and carbonate-bound elements; second fraction: elements bound to Fe-Mn oxides; third fraction: elements bound to organic matter or sulphides; and fourth fraction: elements strongly bound to the soil matrix but not to silicates, the latter can be leached only by HF. These definitions are in agreement with those commonly given in other sequential extraction procedures (Gleyzes et al. Reference Gleyzes, Tellier and Astruc2002, Abollino et al. Reference Abollino, Malandrino, Giacomino and Mentasti2009).
Sequential extractions: Tessier's protocol
In order to compare the two extraction procedures, Tessier's protocol has been applied to sample H2-10 (last centimetre of the core). Extractions were carried out on 1.0 g aliquots of sediment and involved the four following steps (Fig. 1b):
1) Exchangeable fraction: the sample was placed in contact with a high ionic strength solution, 1 M MgCl2, in order to release the so-called exchangeable fraction of metal traces by altering the sorption–desorption superficial processes.
2) Fraction bound to carbonates: the fraction of metal traces bound to carbonates, present in the sample, may be labilised by varying the pH of the sample itself with a slightly acidic extraction solution. CH3COONa and CH3COOH (final pH 5) were added to the residue obtained from the first extraction.
3) Fraction bound to Fe and Mn oxides: labilised in reducing conditions using NH2OH·HCl in 25% CH3COOH4.
4) Fraction bound to organic matter and to sulphides: released in oxidising conditions, HNO3 and H2O2 were added to the residue obtained from the third extraction, the suspension was shaken and then treated with CH3COONH4.
After each extraction the suspension was centrifuged for 10 min at 4500 rpm. The solution was separated, then the precipitate was washed with 5 ml of HPW and centrifuged again for 5 min. The washing water then was added to the supernatant, while the solid residue was used for the subsequent extractions. The extracts were diluted to 25 ml (first fraction), 50 ml (second fraction) and 100 ml (next two fractions), stabilized by addition of 25, 50 or 100 μl of concentrated nitric acid, respectively, and analysed.
The metal fraction associated with the residue is mainly disseminated through the crystal lattices of the rocks and minerals that constitute the soil (Tessier et al. Reference Tessier, Campbell and Bisson1979, Davidson et al. Reference Davidson, Duncan, Littlejohn, Ure and Garden1998). It was calculated from the difference between the total metal concentration and the sum of the first four fractions: as it happens, previous works in this laboratory showed that the total metal contents corresponded with the sum of the metal percentages extracted into the five fractions after digestion (HF/aqua regia) (Abollino et al. Reference Abollino, Giacomino, Malandrino, Mentasti, Aceto and Barberis2006).
Table Ib shows the analytical techniques chosen for each fraction in order to measure the same elements as determined for the BCR procedure. Table II summarizes the steps carried out in the two protocols, in order to better understand the differences between them and obtain an easy overview.
Table II Comparision between modified Community Bureau of Reference (BCR) and Tessier sequential extraction schemes.
Since the two protocols have different fractionation patterns, for the interpretation of the results we assumed the following equivalences: the sum of Tessier's fractions 1 and 2 can be considered analogous to the “acid-extractable” BCR fraction, and the third and fourth Tessier's fractions correspond to the “reducible” and “oxidizable” BCR fractions respectively (Sutherland & Tack Reference Sutherland and Tack2003).
Multivariate techniques
Chemometric treatments were accomplished on the analytical data in order to obtain a visual representation of the metal distribution and to detect similarities and differences among samples and correlations among variables which would be more difficult to identify only by numbers in the tables (Abollino et al. Reference Abollino, Giacomino, Malandrino and Mentasti2011a, Reference Abollino, Malandrino, Giacomino and Mentasti2011b). Thus, the experimental results were processed employing the principal component analysis (PCA) and hierarchical cluster analysis (HCA) multivariate techniques. Only significant correlations (tested at significance level = 0.05) were considered. As to HCA, the classification was run applying Ward's method of agglomeration and squared Euclidean distance as similarities measure (Leiterer et al. Reference Leiterer, Einax, Löser and Vetter1997, Massart et al. Reference Massart, Vandenginste, Buydens, De Jono, Leqy and Smeyers-Verbeke1997a, Reference Massart, Vandenginste, Buydens, De Jono, Leqy and Smeyers-Verbeke1997b). Chemometric treatment was carried out with XLStat, an add-in package of Microsoft Excel.
Results
Total metal contents: results and chemometric investigation
Table III reports on the total concentrations of major and minor metals, As and P measured in all 11 sections of core H2 by ICP-AES, GF-AAS and ASV. In general, Ca is the element present with the highest concentration. It is followed by Al, Fe, Na, Mg, K, Ti, Sr, Mn, P, Ba, Zn, Cu, V, Cr, Ni, La, Co, Pb, As, and Cd. A decrease of concentration has been observed between the first and the second centimetre of the core except for Pb and Sr, which remain almost constant, and for K and Ca, which show an increase. Corals have been found after the second centimetre and the amount of coral collected from each core section increased with the depth ranging from 0.38–32.61 g (Table IV).
Table III Total concentrations of metals, arsenic and phosphorous in each section of core H2. Concentrations (mg kg-1) are shown as mean values (n = 3) with the standard deviations in brackets.

Table IV Total amount of coral found in each sample.

The chemometric treatment on the previous results (Fig. 2a & 2b), in contrast to what we expected, has not shown a sharp separation among samples according to the depth. In the dendrogram shown in Fig. 2b, four main groups of samples can be distinguished: i) H2-1, which is sharply differentiated from all the other samples; ii) H2-0; iii) H2-6 and H2-7; and iv) all the other samples, which are further divided into three subgroups, namely: H2-5, H2-2 and H2-3; H2-8 and H2-9; H2-4 and H2-10. An analogous classification can be observed in the PCA plot (Fig. 2a), which additionally shows which elements give rise to the differences among samples. In particular, Ca and Sr determine the position of H2-1 and H2-4 in the plot with respect to the others.

Fig. 2 Chemometric treatments on the total element content. a. Combined plot of scores and loadings on PC1-PC2, and b. dendrogram obtained by hierarchical cluster analysis (HCA).
Additionally, all the data have been also normalized using Al. The depth profiles of Al-normalized concentrations are shown in Fig. S1, which can be found at http://dx.doi.org/10.1017/S0954102012000685. As observed in the above discussion, most of the elements, Ba, Cd, Co, Cu, Fe, La, Mg, Mn, Na, Ni, P, Ti, V, and Zn, show a decrease in concentration in the upper part of the core after the first centimetre. On the contrary, the concentrations of Ca, K, Pb, and Sr increase from H2-0 to H2-1 and those of As and Cr remain almost unchanged. Principal component analysis applied to the normalized data (Fig. S2, which can be found at http://dx.doi.org/10.1017/S0954102012000685) has confirmed our previous comments on the different behaviour of H2-0 and H2-1 and furthermore, from the plot of PC1 vs PC2 the samples are divided according to the influence of the following variables: Ca, Co, Ni, K, Pb and V.
Below H2-1, most of the variations occurred at the second, fourth, sixth, seventh and eighth centimetre. The chemometric treatment indicates that those parts of the core correspond to the samples influenced by Fe, Ni, V, and K. A partial differentiation of samples H2-6, strongly influenced by Ni and V, and of samples H2-9 and 10 are apparent.
Sequential extractions procedures: results and chemometric investigation
Modified BCR four-step sequential extraction procedure
The results of the BCR extraction are shown in Fig. 3. The data are reported as percent fractions of the total concentrations. Looking at the histograms the following observations can be made:

Fig. 3 Percentages of extraction relative to the Community Bureau of Reference (BCR) partitioning for each investigated sediment sample. Values are calculated relative to the total concentrations.
• Sample H2-0: Mn, Zn, Ni, Cr and Pb are the most extensively released elements with values close to 90%. All the elements are extracted mainly into the fourth fraction except for Pb, which is present at relevant levels (>15%) in the second, third and fourth fraction, and Mn which is primarily released into the second fraction. The predominant extractability of Mn into the reducible fraction is a common feature of all investigated sections: hence, Mn is most probably related to nodules throughout the core.
• Sample H2-1: it has the lowest mean recovery for most metals, with the exception of Ni and Zn. All the elements show similar trends as in H2-0.
• Sample H2-3: at this depth Mn is the most extensively released element into the four fractions, with the highest percentage of extraction into the second one.
• Sample H2-4: considering the sum of the four fractions, most metals have overall lower percentages of extraction in this sample compared with the upper layers, excluding H2-1. On the contrary, Cu and Pb are more extensively released from this section than from the rest of the core, in particular Pb has a remarkably high extractability in the reducible fraction.
• Sample H2-6: Mn and Cr have the highest percentages of extraction into the second fraction in this sample, even if the value for Mn is just slightly higher than the one present in H2-3. The fractionation pattern of several elements in sample H2-6 is similar to that of H2-3 (Fe, Mn, Zn) or to H2-8 (Cr, Fe, Mn, Ni, Pb and Zn).
• Samples H2-8, 9, and 10: regarding the last part of the core, metal recovery is generally lower than in the previous samples, excluding H2-1, even if there are some exceptions to this trend: for instance, the results have shown the highest percentages of extraction of Zn and Fe in H2-8 and H2-9 respectively. Furthermore, Cu has the highest recovery in the second fraction for all the three samples. H2-9 is also characterized by the lowest percentages for Ni and Pb.
Tessier's protocol
The results of Tessier's procedure for sample H2-10 are reported in Table V and compared in a histogram with BCR data in Fig. 4. Looking at the results it is possible to observe that:
Table V Comparison of extraction percentages obtained for sample H2-10 for each fraction (roman numeral) with Community Bureau of Reference (BCR) and Tessier's protocols. d.l. = detection limit.
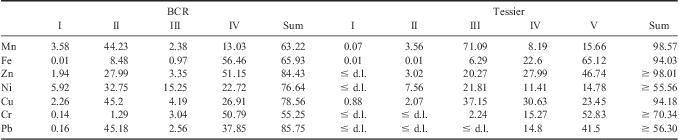

Fig. 4 Comparison between the modified Community Bureau of Reference (BCR) procedure (left panel), and Tessier's protocol (right panel) for sample H2-10.
• The first BCR fraction shows similar values to the first plus the second of Tessier (the sum of the percentages of all metals extracted is 14.04% and 17.17% respectively).
• Although we expected a higher amount extracted into Tessier's third fraction, in comparison to the second of BCR, we found similar or higher extraction percentages in the latter for all metals (except for Mn and Cr which are indeed more extensively released with Tessier's protocol).
• The percentages extracted into the fourth fraction of Tessier are higher than those found in the third of BCR for nearly all elements, probably because of the more drastic extraction conditions used in the former.
• Comparing the fifth fraction of Tessier with the fourth fraction of BCR, the recoveries of Mn, Fe, Cr and Pb are a little higher in Tessier, whereas Zn, Ni and Cu are a little higher in BCR.
The overall extraction for Tessier, computed as the sum of the extraction percentages into all the fractions, can be considered quantitative (≥ 90%), within experimental error, for most elements, except for Cr, Ni and Pb. The reason for the different behaviour of these elements cannot be clearly explained. As expected, the overall extraction for BCR is lower than 100%, due to the fact that aqua regia cannot extract silicate-bound elements.
Discussion
Total metal contents: results and chemometric investigation
Trends of total concentrations
The coral in core H2 might be a sample of Errina antarctica (Gray) (Cnidaria Phylum, Stylasteridae Family, Errina Genus). Unfortunately only few publications deal with Cnidaria in the Antarctic Peninsula (López-González & Gili Reference López-González and Gili2001, Peña Cantero Reference Peña Cantero2008, Reference Peña Cantero2009) and there is a lack of up-to-date information specifically regarding this genus. However, according to some studies (Ramos et al. Reference Ramos, Inoue and Ohde2004) it was originally described as Labiopora Moseleyi Ridley (Cairns Reference Cairns1992) and in general it mainly represents corals that can survive in extreme conditions (i.e. shallow cold water). The genus Errina can be separated into two subgenera: Eu-Errina and Inferiolabiata. The specimen in the core H2 belongs to the first group. Regarding its distribution, E. antarctica has been mainly documented in southern Chile, in Burdwood Bank (Argentina) and in the Falkland Islands (Haussermann & Forsterra Reference Haussermann and Forsterra2007). In general the distribution of stylasterids is influenced by several factors, such as water salinity and density, nutrient level and sediment discharge (Cairns Reference Cairns1992). For its unique detection in the investigated area, it can be excluded that it represents evidence of tropical climate that occurred prior to the Eocene/Oligocene transition (Pearson et al. Reference Pearson, Foster and Wade2009). Consequently, its presence has been interpreted by the authors as a result of ocean currents. Although our study is not intended to discuss coral distribution, the 14C dating of the core and the coral may help with interpretation. As described above, Ca is the cation with the highest concentration. In general, the trend of Ca in sediments is related to CaCO3. Corals are surely a source of this CaCO3 in core H2, but there is not a direct relationship between the amount of corals and that of Ca, so other sources of this element must be present, possibly the sea ice mineral ikaite (CaCO3.6H2O), found elsewhere in Antarctica (Sala et al. Reference Sala, Delmonte, Frezzotti, Proposito, Scarchilli, Maggi, Artioli, Dapiaggi, Marino, Ricci and De Giudici2008). This is particularly true for sample H2-1, which contains the highest concentration of Ca but no coral. On the other hand, the levels of Ca are overall higher in the bottom part of the core, starting from sample H2-7, than in the top one, and the weight of coral (Table IV) follows the same trend. Likewise, Sr is related to calcareous exoskeletons, notably their dissolution in the water column and deposition on the seafloor. Sr and Ca are both involved in aragonite formation. The trend of Sr shows a clear decrease in concentration with depth, opposite to Ca. This indicates the presence of aragonite where Sr easily substitutes for Ca (Malandrino et al. Reference Malandrino, Abollino, Buoso, Casalino, Gasparon, Giacomino, La Gioia and Mentasti2009).
The decrease of metal concentrations in the first centimetre of H2 in comparison to the rest of the core may be associated to the presence of ikaite, as mentioned above, or to the interaction with the water column, which is stronger on the top of the core and involves particle resuspension, ion/exchange, adsorption/desorption phenomena, mineralization and interactions with benthic organisms (Håkanson et al. Reference Håkanson, Gyllenhammar and Brolin2004, Prasad et al. Reference Prasad, Ramanathan, Shrivastav and Anshumali Saxena2006). In our opinion, the first hypothesis is more feasible, because section H2-0 should be equally, or even more extensively, affected by the influence of the water column.
The presence of Ni and Cr is presumably related to basalt outcrops which are characterized by a very high content of Ni, Cr, and of Fe and Mn (Malandrino et al. Reference Malandrino, Abollino, Buoso, Casalino, Gasparon, Giacomino, La Gioia and Mentasti2009). In addition, Ni is also strongly linked to humic matter (Nissenbaum & Swaine Reference Nissenbaum and Swaine1976, Braguglia et al. Reference Braguglia, Campanella, Petronio and Scerbo1995) like Zn and Pb, whose contribution in soils and sediments is strongly influenced by atmospheric events (Eggleton & Thomas Reference Eggleton and Thomas2004, Ianni et al. Reference Ianni, Magi, Soggia, Rivaro and Frache2010). Even if Pb is considered one of the major pollutants in the environment, the concentrations measured in H2 are close to the lowest limit of the typical concentration range for unpolluted sediments, 10–100 mg kg-1 (Malandrino et al. Reference Malandrino, Abollino, Buoso, Casalino, Gasparon, Giacomino, La Gioia and Mentasti2009). Thus, this supports the hypothesis of natural metal sources for this element.
The general overview of the results on the total metal content highlights the presence of different concentrations along the depth profile, especially between the first and the second centimetre of the core, and different element behaviours. All the concentrations of potentially toxic elements (As, Cd, Cr, Cu, Ni, Pb and Zn) are well below the sediment quality guideline low trigger values (Table S5, which can be found at http://dx.doi.org/10.1017/S0954102012000685) reported in the Australian and New Zealand guidelines for fresh and marine water quality (Larner et al. Reference Larner, Seen, Palmer and Snape2007), with the exception of two values for Cu (samples H2-0 and H2-6), which are anyway much lower than the high trigger value (270 mg kg-1) of such guidelines. Furthermore, the occurrence of the highest amounts of As and Pb (which can be considered as indicators of pollution if present at high levels) at the bottom of the core, confirm an absence of anthropogenic influence, which would have given rise to increased concentrations in the top layer of the core. This lack of contamination is not unexpected, considering the isolated position of the sampling site, which is far from research stations that could be a source of pollution. The same conclusions were reached for other cores collected in the Ross Sea (Ianni et al. Reference Ianni, Magi, Soggia, Rivaro and Frache2010). On the other hand, sediment contamination is not totally absent in Antarctica, for instance, polluted sediments were found in Brown Bay, located near the Australian research station in the Windmill Islands, East Antarctica. The contamination was quite localized, since O'Brien Bay, which is just 3 km from Brown Bay, was found to be unimpacted by anthropogenic activities (Palmer et al. Reference Palmer, Snape, Townsend, Stark, Samson and Riddle2010). Finally, comparison of the results obtained for this core, H2, and another labelled as D has been accomplished and shown in Table VI. They both were collected in the western sector of the Ross Sea, but D was sampled during the XIX Antarctic Expedition (2003–04) at 75°06′S, 164°280′5″E (Malandrino et al. Reference Malandrino, Mentasti, Giacomino, Abollino, Dinelli, Sandrini and Tositti2010). The results are compared with values in deep-sea clay-like sediments as well, taking into account Turekian & Wedepohl's compilation (Turekian & Wedepohl Reference Turekian and Wedepohl1961) which, although not recent, represents a reliable and wide dataset and is extensively cited in studies on sediments (Dymond et al. Reference Dymond, Collier, McManus, Honjo and Manganini1997, Rubio et al. Reference Rubio, Nombela and Vilas2000, Uluturhan et al. Reference Uluturhan, Kontas and Can2011). It is noticeable that concentrations of most metals are higher in such sediments then in cores H2 and D. On the other hand, the high concentrations of Sr, Mg and especially Ca in core H2 can partly be explained by the presence of corals.
Table VI Concentration ranges (mg kg-1) in the investigated core H2 compared with another core (coded D) previously sampled in the Ross Sea and deep-sea clay-like sediments. d.l. = detection limit.

*Malandrino et al. Reference Malandrino, Mentasti, Giacomino, Abollino, Dinelli, Sandrini and Tositti2010
**Turekian & Wedepohl Reference Turekian and Wedepohl1961
Chemometric data processing
As reported in the Total metal contents: results and chemometric investigation section, the samples can be divided into four main groups. The combined plot of scores and loadings obtained by PCA shows which elements characterize the samples and give rise to the differences among them. For instance, Ca and Sr determine the position of H2-1 and H2-4 in the PCA plot (Fig. 2a). Most probably the values are related to the lowest amount of coral being found in those sections. Additionally, this may indicate the presence of aragonite, where Sr easily substitutes for Ca. Sample H2-1 shows a remarkably different behaviour, also related to the decrease in concentration observed for most elements. Considering the chemometric treatment (Fig. 2), according to the approach of Gabriel (Gabriel Reference Gabriel1971) the angle between Ca and Sr (about 90°, corresponding to a cosine close to zero) is clear evidence of the non-correlation between Ca and Sr. This is also confirmed by the value of the Pearson correlation coefficient (-0.048 with significance level = 0.05). H2-0 is not influenced by any specific variables because of the different behaviour of the first centimetre of the core, whereas H2-10 is influenced by Ca, probably due to the high amount of coral present in this section (see also Trends of total concentrations section). H2-6 and H2-7 form together a separated group determined by heavy metal influence, i.e. Ni, V, and As. Table III shows that these elements have their maximum value in layer H2-7 (As) or H2-6 (Ni and V). Overall, their concentration is higher in the lowest part of the core, with a few exceptions: on the whole, their mean concentrations in samples H2-6–H2-10 are higher than in samples H2-0–H2-5, even after excluding the anomalous H2-1 layer. A strong correlation has been observed among Al, Ni and Cr, and between Fe and Ti. This could suggest a common terrigenous origin (Bonn et al. Reference Bonn, Gingele, Grobe, Mackensen and Fütterer1998, Zabel et al. Reference Zabel, Bickert, Dittert and Haese1999), typical of that area due to the inputs of the David and Campbell glaciers, as already noticed for the above mentioned core D (Malandrino et al. Reference Malandrino, Mentasti, Giacomino, Abollino, Dinelli, Sandrini and Tositti2010).
Al-normalized data and metal ratios
The normalization of the total concentration data for Al permits identification of anomalies and variation in the trends (Fig. S1). From the comparison of the trends with and without normalization a lot of differences have been observed. For most elements (Mn, Ti, Ba, Mg and Zn) the variation between 0 and 1 cm is attenuated and profiles are more constant. In order to complete the scenario, some indexes have been plotted and are shown in Fig. 5.

Fig. 5 Profiles of Al/Ti, Cu/Zn and Fe/Mn ratios and Baexcess for core H2.
Fe/Mn ratio is used as a palaeoredox index by different authors (Wersin et al. Reference Wersin, Höhener, Giovanoli and Stumm1991, Sohlenius & Westman Reference Sohlenius and Westman1998) and represents an indicator of redox conditions at the sediment-water interface at the time of deposition. Similarly, Cu/Zn ratio is also an indicator of redox sediment conditions (Sohlenius & Westman Reference Sohlenius and Westman1998). High values of Fe/Mn and Cu/Zn ratios are indicative of reducing conditions and vice versa. The former shows a quite constant profile with depth (except for samples H2-1 and H2-4) with a slight increase at the bottom indicating anoxic conditions. Cu/Zn ratio has in general a decreasing trend with remarkably low values at 2–5 cm of depth, suggesting oxic conditions. This last observation is partially supported by Fe/Mn ratio profile, which shows a decrease at 4 cm of depth, also indicating oxic conditions. Hence, we can assume that the central part of core H2 (2–5 cm of depth) was most probably deposited under oxic conditions. Instead, since in the uppermost and deepest parts of the core the profiles of Fe/Mn and Cu/Zn do not match, it is not possible to make clear statements on the redox state at the sediment-water interface, however, it can be presumed that Fe/Mn ratio is more reliable than Cu/Zn since Cu concentration can be influenced by the content of organic material, which in turns depends on past climate changes which influence primary production of living organisms (Wersin et al. Reference Wersin, Höhener, Giovanoli and Stumm1991, Sohlenius & Westman Reference Sohlenius and Westman1998). A similar discrepancy between the behaviour of the two indexes was found for core D (Malandrino et al. Reference Malandrino, Mentasti, Giacomino, Abollino, Dinelli, Sandrini and Tositti2010).
Unlike the previous indexes, Al/Ti ratio is an indicator of sediment origin: an increase is related to felsic sources whereas a decrease suggests a presence of mafic material (Zabel et al. Reference Zabel, Bickert, Dittert and Haese1999). In this case, the trend is constant around 18 (except for the first data point H2-0). In comparison with core D (Malandrino et al. Reference Malandrino, Mentasti, Giacomino, Abollino, Dinelli, Sandrini and Tositti2010), in which the ratio was below 17 in most layers, the high values obtained for core H2 might be related to the contribution of detritus material from Granite Harbour Intrusives, characterized by felsic intrusive lithic fragments and plagioclase grains (Licht et al. Reference Licht, Lederer and Swope2005). In general from all the plots it is possible to observe, again, that the section H2-0 has a different behaviour with respect to the others.
Biogenic Ba in marine sediments has been suggested to be a reliable proxy (Pfeifer et al. Reference Pfeifer, Kasten, Hensen and Schulz2001, Reitz et al. Reference Reitz, Pfeifer, de Lange and Klump2004) of export productivity from the surface ocean. The biogenic Ba (also called excess Ba) input is estimated as the difference between the measured total Ba and the terrigenous Ba fraction, whose estimation is not straightforward (Klump et al. Reference Klump, Hebbeln and Wefer2000). Excess Ba is calculated as: Baexcess = Batotal - (Ba / Tilitho × Titotal) (Dymond et al. Reference Dymond, Suess and Lyle1992). Either Al or Ti can be chosen as a terrigenous denominator since it has been proved that no significant difference occurred (Reitz et al. Reference Reitz, Pfeifer, de Lange and Klump2004). Thus, in this study the Ba/Ti ratio has been chosen with a value of 0.126 (Turekian & Wedepohl Reference Turekian and Wedepohl1961). The same value was used for samples from the continental margin of Antarctica in the area of the Weddell, Lasarev and Riiser-Larsen seas (Bonn et al. Reference Bonn, Gingele, Grobe, Mackensen and Fütterer1998).
Figure 5 shows that the lowest values of Baexcess data are found in sections H2-1, whose mineral composition is different from the rest of the core (see Trends of total concentrations section) and in the two deepest layers, i.e. H2-9 and H2-10. The maximum value corresponds to section H2-7. The range of Baexcess in core H2 is 228–418 mg kg-1, in good agreement with that found for core D (Malandrino et al. Reference Malandrino, Mentasti, Giacomino, Abollino, Dinelli, Sandrini and Tositti2010). A direct comparison with the data of Bonn et al. (Reference Bonn, Gingele, Grobe, Mackensen and Fütterer1998) is not possible, because these researchers studied much longer cores (up to 16 m), however, they found values ranging from c. 200 to c. 600 mg kg-1 along the core, with sharp maxima (up to 2000 mg kg-1) interpreted as corresponding to interglacial periods.
Sequential extraction procedures: results and chemometric investigation
Modified BCR four-step sequential extraction procedure
Regarding the BCR partitioning, combining the results from each fraction and from the PCA (Fig. S3, which can be found at http://dx.doi.org/10.1017/S0954102012000685), more information has been obtained. In the third (oxidizable) fraction of BCR a strong correlation between Cu and Fe is highlighted, which might indicate an involvement of these elements in biological processes. Additionally, Cu is extracted at high percentages both into the second fraction (highest recovery for H2-8) and into the fourth one (highest recovery for H2-0). Its presence may be related in part to a biological and in part to a mineral source. However, several studies in the literature related to soil matrix have shown that Cu is extracted mainly into the third fraction for its high affinity with organic matter (Gleyzes et al. Reference Gleyzes, Tellier and Astruc2002) and also for the low solubility of CuS (Kps CuS = 3.10-37). Fe has been mainly extracted into the fourth fraction, with relatively low percentages (usually < 10%) being released into the second one: taking into account the characteristics of the extractants, it can be presumed that Fe is mainly related to crystalline oxides and, to a much lesser extent, to amorphous oxides (Gleyzes et al. Reference Gleyzes, Tellier and Astruc2002, Malandrino et al. Reference Malandrino, Abollino, Buoso, Casalino, Gasparon, Giacomino, La Gioia and Mentasti2009).
Low percentages of Cr are extracted into the first three fractions, in agreement with the well-known low availability of this element. Cr is mainly partitioned between the fourth fraction and the silicate-bound (unextracted) one. Also Pb has a low reactivity: in most samples, about 40–60% of this metal is present in the fourth fraction or is not extractable. The remaining amount is extracted into the second and third fraction: this suggests that Pb in sediments was in part co-precipitated with or adsorbed onto Fe and Mn oxides, which are good scavengers for this element (Ianni et al. Reference Ianni, Magi, Soggia, Rivaro and Frache2010) and in part present as PbS, whose solubility product is very low (Kps = 3.10-28).
Zn is important for phytoplankton communities and it has a nutrient-type behaviour: short residence time in shallow waters and, as a consequence, high concentrations at the bottom. Indeed, low (< 5%) but detectable percentages of Zn have been observed in the first fraction, i.e. as an available element for microorganisms. The largest amounts of Zn have been extracted into the second and fourth fraction. This result could reflect an interaction with amorphous and crystalline oxides. This hypothesis is corroborated by the PCA results for the second fraction (Fig. S3b) where a strong correlation between Fe and Zn (Pearson correlation coefficient = 0.871, α = 0.05) and between Fe and Ni (Pearson correlation coefficient = 0.671, α = 0.05) has emerged. Therefore, we can connect these elements to a common terrigenous origin. In addition, the geogenic origin of Fe has also been confirmed by its correlation with Cr, one of the most typical geological elements, in the fourth fraction. Moreover, Ni and Cr derive from the weathering of biotite and olivine in granite and basalt rocks respectively, rich also in Mn and in Fe. The correlation between Fe, Mn and Cr obtained here is a confirmation of the presence of granite and basalt components in the core.
Moreover, the PCAs on the data for each fraction (Fig. S3) have made it possible to distinguish the different behaviour of the samples, for instance: H2-0 and H2-1 are separated from each other and from the rest of the sections in all fractions, except for H2-0 in the third one; H2-3 and H2-4 show a certain degree of resemblance in the first and third fraction; and H2-10 has a different behaviour from H2-8 and H2-9, which are somewhat similar in the second, third and fourth fraction. Finally, considering that metal recovery in the deep sections are generally lower than in the shallow part, excluding H2-1, we can hypothesize that the latter is most probably related to amorphous and organic compounds more affected by physical and chemical phenomena occurring in the water column, whereas the deepest part is more influenced by the mineralogical composition, therefore it is strongly bound to the matrix and hardly released.
Many findings of our study are in good agreement with the sequential extraction results obtained by BCR for other sediments from Antarctica. For instance, Al, Cr and Fe were predominantly present in the residual phase and large amounts of Pb were extracted into the second fraction in O'Brien Bay, Windmill Islands, East Antarctica (Larner et al. Reference Larner, Seen, Palmer and Snape2007). On the other hand, Mn was mainly found in the fourth fraction in O'Brien Bay, whereas it was primarily extracted into the second one in core H2, probably deriving from nodules. Larner et al. (Reference Larner, Seen, Palmer and Snape2007) explained the high percentages of Cd, Cu, Pb and Zn found in the oxidizable fraction with the presence of sulfides. Several analogies exist between these data and the data of Ianni et al. (Reference Ianni, Magi, Soggia, Rivaro and Frache2010). Also these researchers found that Al, Cr and Fe were mainly present in the residual phase and found high percentages of Pb in the second fraction. Interestingly, they interpreted the presence of Cu in the oxidizable fraction as deriving from its association with organic compounds, because they found lower oxidizable Cu amount in offshore samples with respect to coastal ones, which have a higher biological productivity. The main difference between our data and those of Larner et al. (Reference Larner, Seen, Palmer and Snape2007) and Ianni et al. (Reference Ianni, Magi, Soggia, Rivaro and Frache2010) is the relatively high extractability of several elements in the first fraction found by both these researchers. The reason for this dissimilarity is presently unexplained.
Tessier's protocol
In general some differences emerge from the fractionation patterns observed with BCR and Tessier protocols, because of the differences in the extraction conditions and the analytical variability of the results. This is due to the relatively large number of steps involved in the protocols and possibly to localized heterogeneity of the samples. The comparison between the first three steps of BCR and the first four of Tessier shows that the latter gave rise to higher extraction percentages, because of the stronger reagents and the more drastic conditions (reaction times and temperatures) used. Differences and discrepancies between the results obtained with the two methods have also been reported by other researchers (e.g. Sutherland & Tack Reference Sutherland and Tack2003).
In general, the advantages of BCR over Tessier's scheme are mainly related to the short operation time, the presence of a detailed protocol and the availability of a certificate reference material to validate the results. The main advantage of Tessier's scheme is the possibility to distinguish between a mobile and mobilizable element fraction, corresponding to the first and second extraction step, which are combined when using the BCR protocol. Such a distinction makes it possible to identify the effect of a local change in ionic strength and acidity of interstitial waters on element release from sediments. The effect of ionic strength can be particularly interesting for marine sediments from the Southern Ocean, which is characterized by the presence and interaction of water masses with different salinities.
In conclusion, as well known, sequential extraction procedures provide a broader insight into the characteristics of sediments than the determination of total concentrations only. Information about the distribution and fate of metals in sediments increases with increasing numbers of steps as anticipated. At the same time, however, the reliability of results decreases with increasing numbers of steps because of increasing experimental complexity. The best compromise between the amount of information and the reliability of results needs to be assessed on a case-by-case basis, depending on the aim of the research (Gleyzes et al. Reference Gleyzes, Tellier and Astruc2002, Abollino et al. Reference Abollino, Giacomino, Malandrino and Mentasti2011a).
Conclusions
The elemental composition of the core H2 is mainly dominated by terrigenous elements. No evidence is found for contamination from human activities in the sediment. Top sediments, due to their recent formation may contain traces of local and/or distant anthropogenic pollution. In this case, potentially toxic elements such as As and Pb have a quite constant trend through the core, and they do not highlight particular contamination phenomena. Most probably the sediment composition results from natural biogeochemical processes. Indeed, the chemometric analyses show a correlation among groups of typical lithogenic elements, such as Fe, Al and Ti. However, H2 is also influenced by biogenic elements, namely Mg, Ca and Sr, strongly related to the exoskeletons found in the core. In particular, the high concentration of Ca is originated from CaCO3 and partially related to the presence of the E. antarctica coral. Additionally chemometrics has made it possible to recognize the different composition of different sections along the core. Community Bureau of Reference extraction has made it possible to distinguish the origin of Fe and Mn in a reasonable experimental time. Fe is bonded to amorphous and primarily to crystalline oxides, whereas Mn is mostly present as nodules, especially in the upper part of the core. As is common for unpolluted sediments, in this case a high percentage of metals has been extracted into the fourth fraction, which indicates their low availability and strong binding with the sediment matrix. The comparison of this procedure with Tessier's protocol has made it possible to distinguish between mobile and mobilizable fraction, although a complex experimental procedure is required.
Finally, this study has demonstrated the importance of combining data from total concentration of elements with results from extraction procedures in order to acquire more information for complete environmental considerations. Nevertheless, sequential extraction procedures should be applied with full consideration of their limitations.
Acknowledgements
The authors are grateful for valuable comments and suggestions made by the reviewers Ashley Townsend and Roger Fuoco, and for the comments made by the editor Alan Vaughan that significantly improved the quality of the manuscript. This work was financially supported by the PNRA (Italian National Antarctica Research Program). Authors are also indebted to the Italian participants of the expeditions to Antarctica, in the year 2003–04, for carrying out the samplings.
Supplemental material
Three supplemental figures and five supplemental tables can be found at http://dx.doi.org/10.1017/S0954102012000685.


