


A major application of mathematical equations in animal science is to describe milk yield pattern over the lactation in livestock farmed for milk production (Pulina and Nudda, Reference Pulina, Nudda and Pulina2001; Thornley and France, Reference Thornley and France2007). Mathematical equations of the lactation curve provide a useful tool for basic studies intended to extend scientific understanding of the complicated physiological processes that control milk production and secretion (Dimauro et al., Reference Dimauro, Cappio-Borlino, Macciotta and Pulina2007). Lactation curves may be utilized by different researchers in animal science to imitate the process of lactation and to assess associations between energy and nutrient provision, the endocrine system, mammary secretory cells and environmental variables influencing the process of milk production.
Diverse growth equations may be used to model the lactation curve because the shape of the curve for cumulative milk yield is similar to that for standard growth. The cumulative milk yield curve would be influenced to a lesser degree than the typical lactation curve if there are some missing records, and it is less responsive to the presence of outliers (López et al., Reference López, France, Odongo, McBride, Kebreab, AlZahal, McBride and Dijkstra2015). Contrary to the conventional curve, fitting the lactation curve for cumulative milk yield would only be slightly influenced by the incidence of deviations due to any disturbance. Therefore, it would be possible to describe atypical or nonstandard lactation curves when daily milk yield is fitted to days in milk (DIM). Incidence of disturbance results in conventional lactation models being unable to fit atypical curves (Rekik and Ben Gara, Reference Rekik and Ben Gara2004; Macciotta et al., Reference Macciotta, Vicario and Cappio-Borlino2005; Silvestre et al., Reference Silvestre, Petim-Batista and Colaço2005; López et al., Reference López, France, Odongo, McBride, Kebreab, AlZahal, McBride and Dijkstra2015). Standard growth models are suitable for fitting the cumulative milk production curve because of the monotonically increasing trajectory and can represent the underlying trend of the lactation curve in relation to the productive potential of the cow.
The broad range of mathematical models available in the literature can be considered as other possibilities in the sense that each equation fits some data sets better than others (Aziz et al., Reference Aziz, Shalaby, El-Shafie, Mahdy and Nishida2006). Currently the suitability of a sinusoidal function, as a newly applied equation, is confirmed for describing growth curves in dairy cows (Darmani et al., Reference Darmani Kuhi, Ghavi Hossein-Zadeh, López, Falahi and France2019a) and turkeys (Darmani et al., Reference Darmani Kuhi, López, France, Mohit, Shabanpour, Ghavi Hossein-Zadeh and Falahi2019b). However, there are no reports of fitting a sinusoidal function to the lactation curve of dairy cows. Therefore, the aim of the present work was to investigate the appropriateness of a sinusoidal function by applying such an equation to the lactation curve of Holstein cows for cumulative milk production and composition using data constructed from test-day individual cow milking records. Fitting performance is compared with three conventional growth models, viz. linear, Richards and Morgan.
Materials and methods
This study used 911 144 test-day records for milk yield, milk fat and protein production of 156 906 primiparous Iranian Holstein cows from 834 dairy herds. The dataset spanned 2000 through 2011 and is part of the data kept by the Animal Breeding Centre and Promotion of Animal Products of Iran. A detailed description of the data was reported in a previous study (Ghavi Hossein-Zadeh, Reference Ghavi Hossein-Zadeh2017).
For daily milk fat and protein yields an initial calculation was made using the amount of milk produced daily and the milk composition:
 $$\eqalign{{\rm Daily\;milk\;fat\;or\;protein\;}\lpar {{\rm kg}/{\rm d}} \rpar \hskip-10pc \cr & \quad \quad = \displaystyle{{{\rm Daily\;milk\;fat\;or\;protein\;}\lpar {\rm \percnt } \rpar \times {\rm milk\;yield\;}\lpar {{\rm kg}/{\rm d}} \rpar } \over {100}}}$$
All test-day records available in the dataset for a given DIM were averaged, and then the cumulative production of milk and of milk components were calculated. Each daily milk, fat and protein yield at a given DIM is added to the sum of all the yields from calving to that particular DIM to calculate cumulative production.
In general, cumulative production shows a curvilinear pattern similar in shape to that of a typical growth curve. The curve for cumulative milk yield resembles a more linear trend (more attenuated sigmoidicity) than the standard growth curve.
The functions used to describe the lactation curves are presented in Supplementary Table S1. The linear, Richards, Morgan and sinusoidal equations (the latter three give a flexible point of inflexion) were fitted to the data to model the relationship between milk, fat or protein yield and DIM. The use of a classical growth function such as the Gompertz or logistic, both of which have a fixed point of inflexion, would force daily milk yield to peak when a fixed fraction of maximum cumulative yield (1/e for the Gompertz, 1/2 for the logistic) is attained. This limitation can be avoided using a flexible growth function.
Each function was fitted using appropriate SAS procedures (PROC REG for the linear model and PROC NLIN for the Richards, Morgan and sinusoidal equations) (SAS Institute, 2002) to estimate parameters. The NLIN procedure produces weighted or unweighted least squares estimates of the parameters of a non-linear model. To fit non-linear functions, the Gauss-Newton method was used as the iteration technique. To begin this process, the NLIN procedure first examines the starting value specifications of the parameters. If a grid of values is specified, the NLIN procedure evaluates the residual sum of squares at each combination of parameter values to determine the set of parameter values producing the lowest residual sum of squares. These values are used for the initial step of the iteration. The models were examined for goodness-of-fit (quality of prediction) using adjusted coefficient of determination  $\lpar {R_{{\rm adj}}^2 } \rpar $, residual standard deviation or root mean square error (RMSE), Akaike's information criterion (AIC) and the Bayesian information criterion (BIC).
RMSE is a type of generalized standard deviation and was calculated as follows:
 $${\rm RMSE} = \sqrt {\displaystyle{{{\rm RSS}} \over {n-p-1}}} $$
where RSS is the residual sum of squares, n is the number of observations (data points) and p is the number of parameters in the model. The best model is the one with the lowest RMSE.
The AIC was calculated using the following equation:
 $${\rm AIC} = n \times \ln \left({\displaystyle{{{\rm RSS}} \over n}} \right)+ 2p$$
The AIC is a good statistic for comparing models of different complexity because it adjusts the RSS for number of parameters in the model. A smaller numerical value of AIC indicates a better fit when comparing models.
The BIC combines maximum likelihood (data fitting) and choice of model by penalizing the (log) maximum likelihood with a term related to model complexity as follows:
 $${\rm BIC} = n \times \ln \left({\displaystyle{{{\rm RSS}} \over n}} \right)+ p\ln \lpar n \rpar $$
A smaller numerical value of BIC indicates a better fit when comparing models.
The percentage squared bias (PSB) calculated as proposed by Ali and Schaeffer (Reference Ali and Schaeffer1987) was used to assess model accuracy, and mean square prediction error (Fahti Nasri et al., Reference Fahti Nasri, France, Odongo, López, Bannink and Kebreab2008) to evaluate the predictive performance of the equations.
Results
Estimated parameters of the equations for cumulative milk yield and composition of Holstein cows are shown in Table 1. Also, goodness of fit statistics for the four models fitted to the cumulative curves are presented in Table 2.  $R_{{\rm adj}}^2 $ values were generally high, implying suitable fits to the data, and showed minor differences among the models for cumulative yields. A comparison between the equations according to the other statistical criteria (Table 2) showed differences between the models under consideration. The sinusoidal equation provided the lowest values of RMSE, AIC and BIC, and therefore the best fit to the lactation curve for cumulative milk, fat and protein yields. The linear model gave the worst fit to the cumulative lactation curve for all production traits by providing the largest values of RMSE, AIC and BIC. The sinusoidal equation also performed better than the other functions in terms of prediction precision and accuracy, showing the lowest mean square prediction error and PSB (Table 2).
Table 1. Parameter estimates for the different functions

a yf for the sinusoidal is not an estimated parameter. It was calculated from the fitted equations as: y f = y* + a.
Table 2. Comparison of goodness-of-fit, predictive and bias performance for the linear and non-linear equations
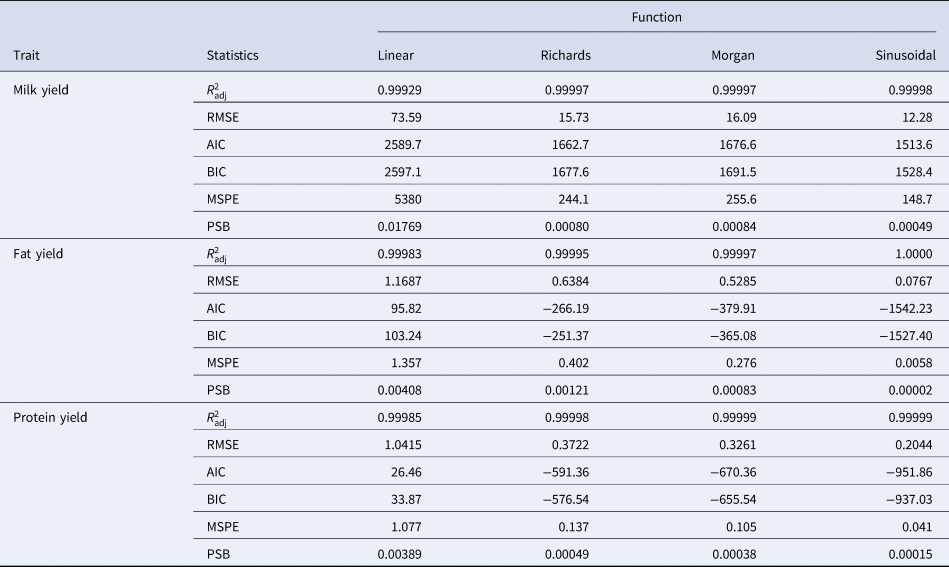
 $R_{{\rm adj}}^2 $, adjusted coefficient of determination; RMSE, root mean square error; AIC, Akaike information criterion; BIC, Bayesian information criterion; MSPE, mean square prediction error; PSB, percentage squared bias.
Both time and cumulative yield at inflexion point for different non-linear models fitted to cumulative yields of milk, fat and protein are shown in Table 3. Based on a comparison between observed cumulative curves and their predicted counterparts (Fig. 1, and online Supplementary Figs S2 and S3), only the Richards equation provided accurate estimation of the cumulative milk yield at inflexion time. The sinusoidal equation underestimated the cumulative yield at inflexion and the Morgan equation overestimated it. For cumulative fat yield, the Richards equation provided nearly accurate estimates of cumulative yield at inflexion and sinusoidal and Morgan equations overestimated it. For cumulative protein yield, the Richards underestimated cumulative yield at inflexion and the sinusoidal and Morgan overestimated it.

Fig. 1. Predicted lactation curves for cumulative milk yield obtained with different growth equations in Holstein cows.
Table 3. Time (t*) and cumulative yield (y*) at inflexion point, daily milk yield at peak (mp) and milk yield at 305 d lactation (y 305) for the models fitted to cumulative yields of milk, fat and protein in Holstein cows (NA = not applicable)

Observed cumulative yields from 5 to 305 DIM are depicted in Supplementary Figure S1. As demonstrated, there was an increasing trend for cumulative milk yield and composition with increasing DIM. Predicted lactation curves for cumulative milk yield obtained by fitting the four growth equations are shown in Figure 1. Also, predicted lactation curves for cumulative fat yield and protein yield are shown in Supplementary Figures S2 and S3.
Discussion
Knowledge of the shape of the lactation curve is valuable in a management context, especially for decisions that are time-dependent. Modelers seek to find parametric descriptors of the shape of the lactation curve to predict characteristics including peak milk yield, time to peak, and persistency. For example, knowing when peak milk yield will occur can assist dairy farmers or managers in planning feeding strategies to maintain peak yield for as long as possible (López et al., Reference López, France, Odongo, McBride, Kebreab, AlZahal, McBride and Dijkstra2015). Although several studies have compared non-linear models to fit the lactation curve for milk yield and composition, there are few reports on modeling the lactation curve for cumulative milk yield (Ghavi Hossein-Zadeh, Reference Ghavi Hossein-Zadeh2014, Reference Ghavi Hossein-Zadeh2017; López et al., Reference López, France, Odongo, McBride, Kebreab, AlZahal, McBride and Dijkstra2015) and no reports for cumulative milk composition traits. Therefore, the current study is the first to report on fitting cumulative milk fat and protein yield data, in particular assessing a sinusoidal function as an alternative to conventional models. Developing an appropriate strategy to reach a desired lactation shape through modifying the parameters of such non-linear models would be of considerable value. These parameters may act as surrogates for various genetic and environmental factors, different combinations of which can account for differences in non-linear curves.
Typically, the conventional lactation curve follows a skewed bell shape, with a quick rise after parturition to a peak a few weeks later followed by a slow decline until the end of lactation. However, several researchers have reported non-standard patterns such as continuously increasing or decreasing and reverse standard. These atypical curves are not simply fitted using conventional lactation models (Rekik and Ben Gara, Reference Rekik and Ben Gara2004; Macciotta et al., Reference Macciotta, Vicario and Cappio-Borlino2005; Silvestre et al., Reference Silvestre, Petim-Batista and Colaço2005; López et al., Reference López, France, Odongo, McBride, Kebreab, AlZahal, McBride and Dijkstra2015). However, the consistently increasing pattern of cumulative curves does not present any difficulties in fitting sigmoidal functions to cumulative milk yield and composition traits. The current results indicate that representative non-linear growth functions, especially the sinusoidal and the Morgan equation, provide suitable fits to cumulative lactation curves not only for milk yield but also for fat and protein yields. Consistent with the results of this study, López et al. (Reference López, France, Odongo, McBride, Kebreab, AlZahal, McBride and Dijkstra2015) fitted six classical growth functions (monomolecular, Schumacher, Gompertz, logistic, Richards, and Morgan) to cumulative milk production curves of Canadian Holstein dairy cows and concluded that the fitted classical growth functions could be an alternative to conventional models when analyzing lactation data.
A cumulative lactation curve shows a monotonically increasing trend presenting a typical sigmoidal shape, with an accelerating phase related to early lactation when daily production rises, and a decreasing phase in which the slope declines continuously. Total milk, fat and protein yield over the lactation are simply obtained from this cumulative milk production curve by calculating its value at any specific DIM for each non-linear function (López et al., Reference López, France, Odongo, McBride, Kebreab, AlZahal, McBride and Dijkstra2015). This simple method of obtaining total production with cumulative curves differs from the method of calculating by integrating standard lactation curves to reach total milk yield. The results of the current study show that monthly test-day production records provide a suitable input for the cumulative lactation curve. This would be a benefit if a daily system of recording production data in dairy farms is not available.
Differences between the lactation curve characteristics of dairy cows are possibly responsible for the significant differences between goodness of fit of the functions. The variation in model fit in different studies on conventional curves may have resulted from the differences in mathematical form of the equations, differences in monthly production records, the breed of animals, the number of data points and the time interval between subsequent recordings of data. Compared with conventional lactation models which are sensitive to missing test-day records, especially in early DIM (Adediran et al., Reference Adediran, Malau-Aduli, Roche, Donaghy and Fulkerson2007; Wasike et al., Reference Wasike, Kahi and Peters2011), fitting the non-linear growth models to cumulative production records would be influenced to a much lesser degree by a few missing records (López et al., Reference López, France, Odongo, McBride, Kebreab, AlZahal, McBride and Dijkstra2015). Therefore, the smoother trend of cumulative curves for milk yield and composition is likely less susceptible to abnormal records or occurrence of outliers. Abnormal records can be a result of several problems such as measurement faults and biological disruptions in animal performance occurring when dairy cows are threatened by some severe condition which limits expression of their genetic potential, e.g. nutritional deficit, metabolic or infectious disorders (Codrea et al., Reference Codrea, Hojsgaard and Friggens2011). The identification of these bias factors and correcting them is critical and this may be achieved by analyzing daily records of production traits. However, as mentioned above, these disruptions in the lactation curve would be very problematic when working with conventional lactation models, whereas the fit of cumulative curves for milk yield and composition demonstrates the greater flexibility of these curves to varied data attributes (López et al., Reference López, France, Odongo, McBride, Kebreab, AlZahal, McBride and Dijkstra2015).
The current results show that growth functions can be fitted accurately to lactation curves for cumulative milk, fat and protein yields, resulting in acceptable statistical output and accurate determination of production traits. However, the sinusoidal equation introduced herein had sufficient flexibility and a variable point of inflexion and provided the best goodness of fit, so it may be considered an alternative to classical growth functions. Choosing a flexible and accurate equation to predict the lactation curve can noticeably improve the outcome of a research study and the predictive accuracy of a model guarantees its implications.
Supplementary material
The supplementary material for this article can be found at https://doi.org/10.1017/S0022029920000254
Acknowledgements
The authors wish to acknowledge the Animal Breeding Centre and Promotion of Animal Products of Iran for providing the data used in the current study.


