


1. Introduction
Displacement along transform plate boundaries is typically characterized by limited volcanism. For example, most of the 1600 km San Andreas Fault system in California (Brown, Reference Brown and Wallace1990; Wallace, Reference Wallace1990) and ∼900 km Ailao Shan – Red River transform boundary of Indochina (Leloup et al. Reference Leloup, Lacassin, Tapponnier, Schärer, Zhong, Liu, Zhang, Ji and Trinh1995) show no evidence of volcanism. Nevertheless, exceptional cases of volcanism along transforms exist and require careful investigation and validation. Such exceptions occur in pull-apart extensional basins (Aydin et al. Reference Aydin, Schultz and Campagna1990; Adiyaman et al. Reference Adiyaman, Chorowicz, Arnaud, Gündogdu and Gourgaud2001; Tatar et al. Reference Tatar, Yurtmen, Temiz, Guersoy, Kocbulut, Mesci and Guezou2007) or other transtensional structures (Alaniz-Álvarez et al. Reference Alaniz-Álvarez, Nieto-Samaniego, Morán-Zenteno and Alba-Aldave2002; Palomo et al. Reference Palomo, Macıas and Espındola2004; Tibaldi et al. Reference Tibaldi, Pasquarè, Tormey, Cloetingh and Negendank2009; Mathieu et al. Reference Mathieu, De Vries, Pilato and Troll2011) that likely facilitate the upward migration of melts.
The relationship between volcanism and motion along the Dead Sea Transform (DST) plate boundary (Fig. 1; e.g. Quennell, Reference Quennell1959; Freund, Reference Freund1965; Garfunkel et al. Reference Garfunkel, Zak and Freund1981; Kashai & Croker, Reference Kashai and Croker1987) was studied by Weinstein & Garfunkel (Reference Weinstein, Garfunkel, Garfunkel, Ben-Avraham and Kagan2014), who distinguished between volcanic evidence away from the transform and that found along its axis (i.e. off- and on-transform, respectively). In accordance with previous studies (e.g. Shaliv, Reference Shaliv1991; Weinstein, Reference Weinstein2000; Weinstein et al. Reference Weinstein, Navon, Altherr and Stein2006), Weinstein & Garfunkel (Reference Weinstein, Garfunkel, Garfunkel, Ben-Avraham and Kagan2014) suggested that early to middle Miocene volcanism, mainly in the Lower Galilee, was associated with off-transform activity related to the Harrat Ash Shaam volcanic field (Fig. 1). In contrast, volcanism younger than ∼13 Ma found within the intersecting area between the DST and Harrat Ash Shaam was suggested to represent on-transform basalts, possibly generated by melt channelling through the DST (Garfunkel, Reference Garfunkel1981; Weinstein & Garfunkel, Reference Weinstein, Garfunkel, Garfunkel, Ben-Avraham and Kagan2014).

Fig. 1. (a) Location of volcanic fields (Harrats; black areas) across the Arabian plate, including the Harrat Ash Shaam and the Azraq–Sirhan Graben (red lines; modified after Segev et al. Reference Segev, Lyakhovsky and Weinberger2014; Weinstein & Garfunkel, Reference Weinstein, Garfunkel, Garfunkel, Ben-Avraham and Kagan2014). A black frame marks the location of (b). Inset shows the main tectonic elements in the northwestern Arabian plate: the Alpine Himalaya orogenic belt (AHOB), the Dead Sea Transform (DST) and the Owen Fracture Zone (FZ). EAF – East Anatolian Fault; NAF – North Anatolian Fault; CA – Cyprus Arc. (b) Major tectonic elements and distribution of the Cenozoic Harrat Ash Shaam volcanic field in the northwestern Arabian plate (after Segev et al. Reference Segev, Lyakhovsky and Weinberger2014). Red frame shows the location of Figure 2 and the Yarmouk River gorge (YRG) studied here. LRB – Lebanese restraining bend.
The idea that the post ∼13 Ma volcanism at the DST–Harrat Ash Shaam intersection is directly related to DST motion is problematic. First, of the ∼1000 km long DST, which includes numerous extensional structures, the post ∼13 Ma volcanism appears mainly along its ∼90 km intersection with the Harrat Ash Shaam volcanic field (Figs 1, 2; Schattner et al. Reference Schattner, Ben-Avraham, Lazar and Hüebscher2006 a; Segev & Rybakov, Reference Segev and Rybakov2010; Segev et al. Reference Segev, Lyakhovsky and Weinberger2014; Weinstein & Garfunkel, Reference Weinstein, Garfunkel, Garfunkel, Ben-Avraham and Kagan2014; Regenauer-Lieb et al. Reference Regenauer-Lieb, Rosenbaum, Lyakhovsky, Liu, Weinberg, Segev and Weinstein2015; Rosenthal et al. Reference Rosenthal, Ben-Avraham and Schattner2019). Second, the on-transform magmatic association, as suggested by Weinstein & Garfunkel (Reference Weinstein, Garfunkel, Garfunkel, Ben-Avraham and Kagan2014), is based on only two localities within the intersecting segment: the Zemah-1 well (south of Lake Kinneret; Fig. 2) and the surficial basalts that cover the ∼10 km long Korazim block (north of Lake Kinneret). The rock units found in the Zemah-1 well (online Supplementary Material Figs S1, S2) include Miocene–Pliocene gabbro intrusions and ∼700 m thick Pliocene basalts (Marcus & Slager, Reference Marcus and Slager1983, Reference Marcus and Slager1985; Meiler, Reference Meiler2011; Segev, Reference Segev2017). The arrangement of magnetic and gravity anomalies over these Miocene intrusions and Pliocene basalts suggests that they originated from the nearby Yarmouk River gorge (Schattner et al. Reference Schattner, Segev, Mikhailov, Rybakov and Lyakhovsky2019). Accordingly, the source of the magmatism was off-transform, at the southern margin of the Harrat Ash Shaam.

Fig. 2. Geological map of the study area (originally 1:200 000 scale; modified after Sneh et al. Reference Sneh, Bartov and Rosensaft1998; Schattner et al. Reference Schattner, Segev, Mikhailov, Rybakov and Lyakhovsky2019; Segev, Reference Segev2020). The Kinneret (K1), Kinarot (K2) and Bet She’an (B) basins are termed KKB. A thick dashed blue polygon marks the focus of this study around the Yarmouk River gorge. Blue circles mark previously reported volcanic centres. Green circles mark additional centres described in the current study (Yarmouk, Koayiah, Meitsar and Shaq el Barid). Oil wells are marked by yellow circles and black crosses (Zemah-1; Ness 02, 03, 05, 06, 10, 12; ES – Ein Said). Geothermal springs are marked by magenta circles (Hamat Gader; M – Mokhaba). Additional abbreviations: NA – Natur; RZ – Rugum Zaki; YB – Yhudiya-Beteikha; BY – Bnei Yehuda; MHP – Mevo Hama plateau; UQP – Umm Qays plateau; YJC – Yarmouk–Jordan river confluence; EMF – Eastern Marginal Fault; WMF – Western Marginal Fault. Israel Transverse Mercator (ITM) coordinates divided by 1000.
The current study explores the association of the volcanic activity at the intersection between the DST and Harrat Ash Shaam, in the Yarmouk River gorge, during the last ∼13 Ma. We examined aerial photography, and geological and geophysical evidence from the gorge, south Harrat Ash Shaam and adjacent Kinneret–Kinarot–Bet She’an basin complex (Fig. 2) to identify the volcanic centres, reconstruct the accumulation mode of each magmatic unit and explain the marked thickness variations (over 1 km) of basalts and gabbros between the transform axis and its eastern shoulder. Our findings indicate that, in contrast to most previous suggestions, the magmatism belongs to the off-transform Harrat Ash Shaam activity (not the DST), which continued to provide volcanic and plutonic material throughout Miocene–Pleistocene times (i.e. after the DST displaced its predecessor, the NW-trending Irbid–Azraq rift and the Harrat Ash Shaam volcanic field). We discuss the implications of the recurring and stationary activity throughout this ∼13 Ma period.
2. Geological background
2.a. Harrat Ash Shaam and Irbid–Azraq rifting
The NW-trending Irbid–Azraq rift developed during Oligocene–Miocene times across western Arabia. It propagated through the Golan and southern Galilee (Arabian and Sinai plates, respectively; Fig. 1) toward the Mediterranean margin in response to a NNE–SSW extension, associated with the Red Sea rifting (i.e. Red Sea stress regime) and northern Arabia subduction (Steckler & Ten Brink, Reference Steckler and Ten Brink1986; Bellahsen et al. Reference Bellahsen, Faccenna, Funiciello, Daniel and Jolivet2003; Schattner et al. Reference Schattner, Ben-Avraham, Reshef, Bar-Am and Lazar2006 b; Segev & Rybakov, Reference Segev and Rybakov2011; Avni et al. Reference Avni, Segev and Ginat2012; Lyakhovsky et al. Reference Lyakhovsky, Segev, Schattner and Weinberger2012; Segev et al. Reference Segev, Lyakhovsky and Weinberger2014; Regenauer-Leib et al. Reference Regenauer-Lieb, Rosenbaum, Lyakhovsky, Liu, Weinberg, Segev and Weinstein2015). Subsiding basins in the northwestern part of the rift (e.g. proto-Golan and Kinneret–Kinarot–Bet She’an basin; KKB in Fig. 2) accumulated shallow Oligocene marine ingressions (mainly carbonate rocks of the Fiq and Susita formations; Fig. 3) arriving from the Persian Gulf region (Fig. 1; Michelson, Reference Michelson1982; Michelson & Mor, Reference Michelson and Mor1985; Michelson et al. Reference Michelson, Flexer and Erez1987; Segev et al. Reference Segev, Lyakhovsky and Weinberger2014, Reference Segev, Avni, Shahar and Wald2017; Wald et al. Reference Wald, Segev, Ben-Avraham and Schattner2019). This transgression was the first Cenozoic marine flooding into the intracontinental basins after withdrawal of the Tethys Ocean in late Eocene time and the continental peneplanation (Avni et al. Reference Avni, Segev and Ginat2012; Wald et al. Reference Wald, Segev, Ben-Avraham and Schattner2019).
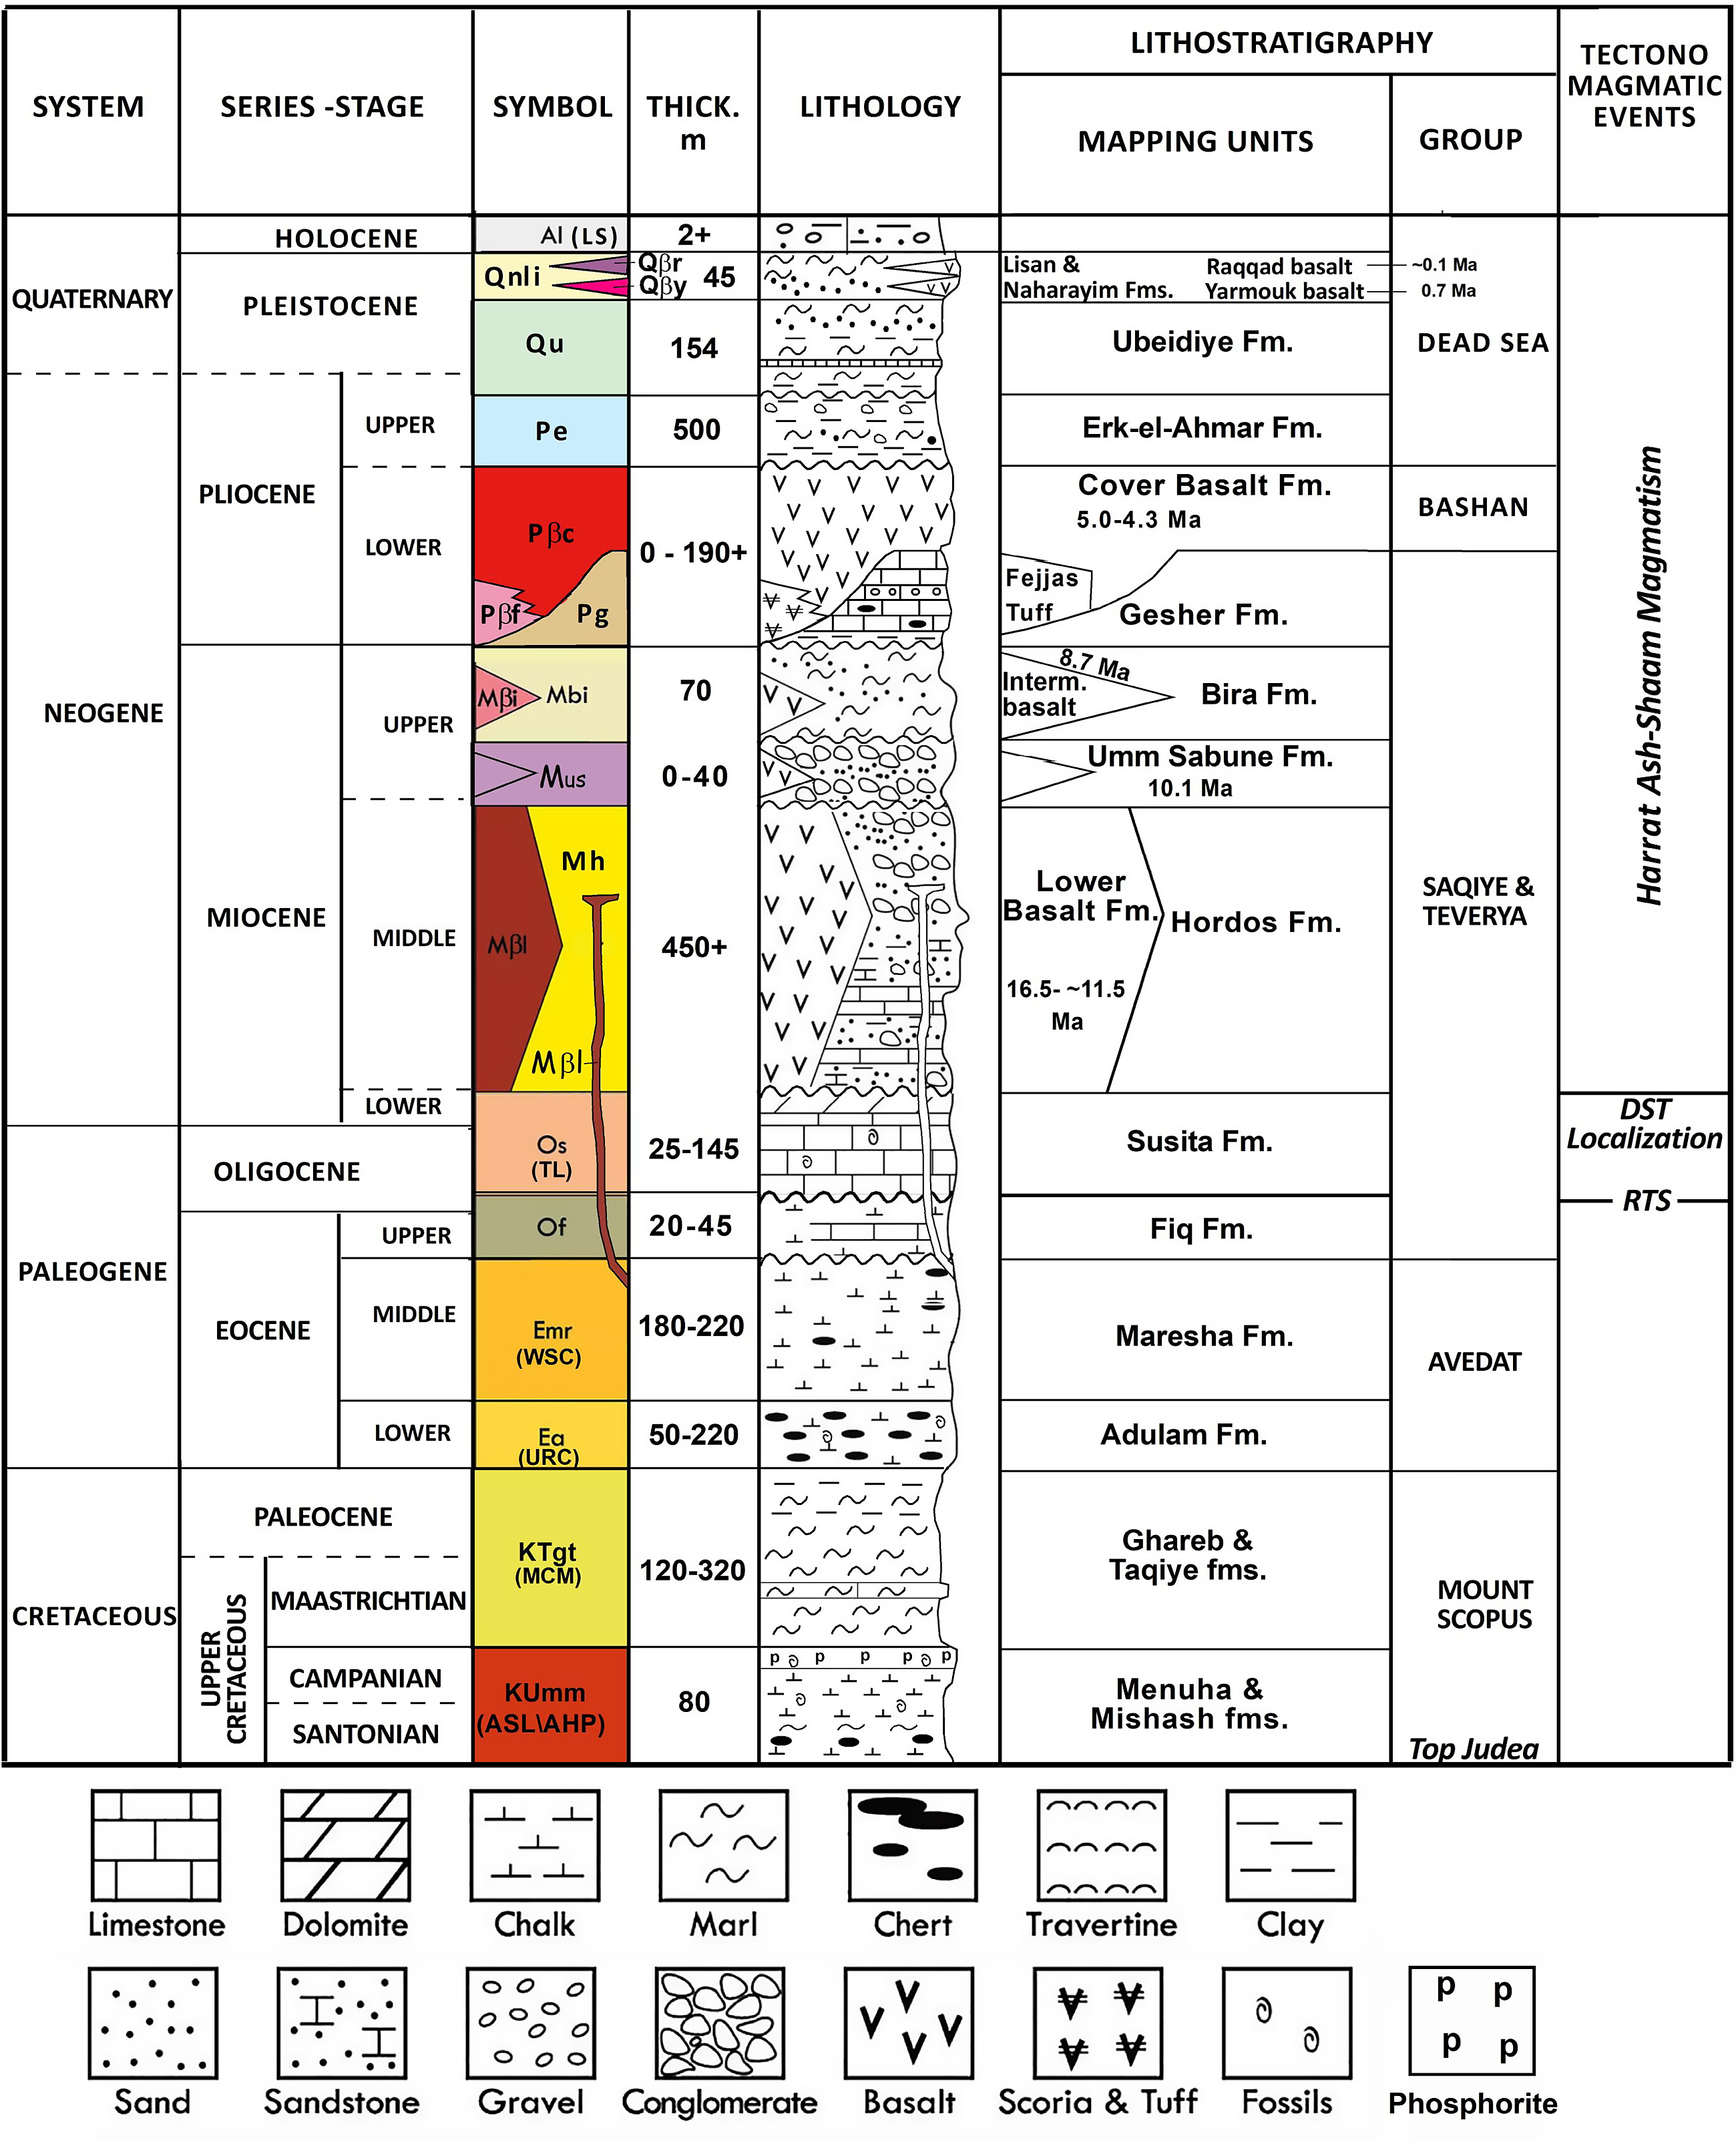
Fig. 3. Stratigraphy of the exposed formations surrounding the Kinneret–Kinarot basin (modified after Sneh, Reference Sneh2017; Segev, Reference Segev2020). RTS – regional truncation surface.
Rifting was accompanied by extensive volcanism along the Harrat Ash Shaam field, which began shortly after the Afar plume ascent and its associated Ethiopia–Yemen trap volcanism (Fig. 1; e.g. White & McKenzie, Reference White and McKenzie1989; Schilling et al. Reference Schilling, Kingsley, Hanan and McCully1992; Baker et al. Reference Baker, Thirlwall and Menzies1996; Segev, Reference Segev2002). The trap volcanism began outpouring in early Oligocene time (31 Ma; Baker et al. Reference Baker, Thirlwall and Menzies1996). This was followed by the formation of volcanic fields, locally called Harrats, from ∼30 Ma ago (e.g. Camp et al. Reference Camp, Hooper, Roobol and White1987), which developed within ∼200 km of the eastern Red Sea coast (Fig. 1a) owing to the northward sub-lithospheric flow of the plume-related material (Faccenna et al. Reference Faccenna, Becker, Jolivet and Keskin2013).
One of the largest volcanic fields of this series, the Harrat Ash Shaam, developed ∼500 km north of the Red Sea on the western Arabian plate (Fig. 1; e.g. Giannérini et al. Reference Giannérini, Campredon, Feraud and Zakhem1988; Moh’d, Reference Moh’d2000; Ilani et al. Reference Ilani, Harlavan, Tarawneh, Rabba, Weinberger, Ibrahim, Peltz and Steinitz2001; Trifonov et al. Reference Trifonov, Dodonov, Sharkov, Golovin, Chernyshev, Lebedev, Ivanova, Bachmanov, Rukieh and Ammar2011). The Harrat Ash Shaam field extended into the Golan and the Lower Galilee on the northern Sinai plate during middle Miocene time (∼13 Ma and ∼17 Ma, respectively; Michelson, Reference Michelson1979; Michelson & Mor, Reference Michelson and Mor1985; Shaliv, Reference Shaliv1991; Mor & Sneh, Reference Mor and Sneh1996; Moh’d, Reference Moh’d2000; Segev, Reference Segev2000, Reference Segev2017; Weinstein, Reference Weinstein2000; Weinstein et al. Reference Weinstein, Navon, Altherr and Stein2006). The NW-trending ∼700 × 40 km volcanic field reaches a maximum thickness of ∼1 km at the Druze depression (Fig. 1b; Razvalyaev et al. Reference Razvalyaev, Kazmin, Galaktionov, Krasheninnikov, Hall, Hirsch, Benjamini and Flexer2005; Meiler et al. Reference Meiler, Reshef and Shulman2011; Segev et al. Reference Segev, Lyakhovsky and Weinberger2014). Regenauer-Leib et al. (Reference Regenauer-Lieb, Rosenbaum, Lyakhovsky, Liu, Weinberg, Segev and Weinstein2015) linked the development of the Harrat Ash Shaam volcanic field to the lithospheric extension that produced the Irbid–Azraq rift system. Recent studies have suggested that the Lower Galilee basins of this rift system continued to extend after the DST plate boundary began its displacement (Rosenthal et al. Reference Rosenthal, Ben-Avraham and Schattner2019; Wald et al. Reference Wald, Segev, Ben-Avraham and Schattner2019).
Basaltic volcanism formed in the Harrat Ash Shaam during two main periods, 26–22 Ma and 13 to <0.1 Ma (Giannérini et al. Reference Giannérini, Campredon, Feraud and Zakhem1988; Mor, Reference Mor1993; Sharkov et al. Reference Sharkov, Chernyshev, Devyatkin, Dodonov, Ivanenko, Karpenko, Leonov, Novikov, Hanna and Khatib1994, Reference Sharkov, Chernyshev, Devyatkin, Dodonov, Ivanenko, Karpenko, Lebedev, Novikov, Hanna and Khatib1998; Heimann et al. Reference Heimann, Steinitz, Mor and Shaliv1996; Ilani et al. Reference Ilani, Harlavan, Tarawneh, Rabba, Weinberger, Ibrahim, Peltz and Steinitz2001; Weinstein et al. Reference Weinstein, Navon, Altherr and Stein2006, Reference Weinstein, Weinberger and Calvert2013; Inbar & Gilichinsky, Reference Inbar, Gilichinsky, Sagy, Bookman, Hamiel, Mushkin, Nahmias, Medvedev and Heimann2009; Shaanan et al. Reference Shaanan, Porat, Navon, Weinberger, Calvert and Weinstein2011; Trifonov et al. Reference Trifonov, Dodonov, Sharkov, Golovin, Chernyshev, Lebedev, Ivanova, Bachmanov, Rukieh and Ammar2011). It contains predominantly alkali basalts, similar to other intraplate continental basalts worldwide (e.g. Weinstein, Reference Weinstein2000, Reference Weinstein2012; Shaw et al. Reference Shaw, Baker, Menzies, Thirlwall and Ibrahim2003; Weinstein et al. Reference Weinstein, Navon, Altherr and Stein2006).
During the last ∼26 Ma, the Harrat Ash Shaam remained at the same geographical location despite the overall plate motion. Trifonov et al. (Reference Trifonov, Dodonov, Sharkov, Golovin, Chernyshev, Lebedev, Ivanova, Bachmanov, Rukieh and Ammar2011) explained this fixation by a coupled motion of the magmatic sources with the plates. This suggestion is supported by the models of Faccenna et al. (Reference Faccenna, Becker, Jolivet and Keskin2013) and Regenauer-Leib et al. (Reference Regenauer-Lieb, Rosenbaum, Lyakhovsky, Liu, Weinberg, Segev and Weinstein2015), which highlighted the roles of sub-lithospheric flow and lithospheric extension, respectively. The models by Regenauer-Lieb et al. (Reference Regenauer-Lieb, Rosenbaum, Lyakhovsky, Liu, Weinberg, Segev and Weinstein2015) assumed that a weak and shallow (∼20 km) structural framework allowed melts to ascend through the rifted lithosphere.
2.b. Dead Sea Transform
The DST is a seismically active N-trending plate boundary between the Arabian and Sinai plates (Fig. 1). Sinistral motion along the DST began during early Miocene time (∼20 Ma; e.g. Freund et al. Reference Freund, Garfunkel, Zak, Goldberg, Weissbrod, Derin, Bender, Wellings and Girdler1970; Eyal et al. Reference Eyal, Eyal, Bartov and Steinitz1981; Garfunkel, Reference Garfunkel1981, Reference Garfunkel1998; Joffe & Garfunkel, Reference Joffe and Garfunkel1987; Bayer et al. Reference Bayer, Hoetzl, Jado, Rocher and Voggenreiter1988; Bosworth et al. Reference Bosworth, Huchon and McClay2005; Marco, Reference Marco2007; Segev et al. Reference Segev, Lyakhovsky and Weinberger2014; Nuriel et al. Reference Nuriel, Weinberger, Kylander-Clark, Hacker and Craddock2017). When the Arabian plate completed ∼35 km of sinistral motion in early Miocene time (∼17.5 Ma), volcanic activity, faulting and subsidence initiated across the Lower Galilee basins, which are located along the western extension of the displaced Irbid–Azraq – Harrat Ash Shaam (Figs 1, 2, 4; Shaliv, Reference Shaliv1991; Segev, Reference Segev2000; Schattner et al. Reference Schattner, Ben-Avraham, Reshef, Bar-Am and Lazar2006 b; Segev et al. Reference Segev, Lyakhovsky and Weinberger2014; Rozenbaum et al. Reference Rozenbaum, Sandler, Zilberman, Stein, Jicha and Singer2016; Wald et al. Reference Wald, Segev, Ben-Avraham and Schattner2019).

Fig. 4. Structural map of the Late Cretaceous top Judea Group interface (base of Fig. 3) in northern Israel, NW Jordan and SW Syria (values in metres above present-day sea level). Data were compiled from Segev et al. (Reference Segev, Lyakhovsky and Weinberger2014), Rosenthal et al. (Reference Rosenthal, Segev, Rybakov, Lyakhovsky and Ben-Avraham2015) and references therein. Faults in the Dead Sea Transform (DST) valley (Kinneret–Kinarot–Bet She’an – KKB) and Hula basins are marked after Schattner et al. (Reference Schattner, Segev, Mikhailov, Rybakov and Lyakhovsky2019 and references therein). The Lower Galilee fault system is marked after Wald et al. (Reference Wald, Segev, Ben-Avraham and Schattner2019). The extent of basaltic units is marked according to their age (see colour key); solid lines indicate exposed basalt; dashed lines indicate the inferred subsurface presence of these basaltic units (after, e.g. Heimann, Reference Heimann1990; Trifonov et al. Reference Trifonov, Dodonov, Sharkov, Golovin, Chernyshev, Lebedev, Ivanova, Bachmanov, Rukieh and Ammar2011; Weinstein & Garfunkel, Reference Weinstein, Garfunkel, Garfunkel, Ben-Avraham and Kagan2014). IAR – Irbid–Azraq rift; MH – Mt Hermon; BS – Bet She’an; YV – Yizre’el valley; R – Revaya; MF – Marma Faiad; YF – Yarmouk Fault; MG – Mt Gilboa; MC – Mt Carmel; EMF – Eastern Marginal Fault; WMF – Western Marginal Fault. Israel Transverse Mercator (ITM) coordinates divided by 1000.
A complex of extensional basins, the Kinneret–Kinarot–Bet She’an, subsided along the DST axis at its crossing area with the Irbid–Azraq – Harrat Ash Shaam (KKB in Figs 2, 4, 5). The complex accumulated clastic and basaltic units owing to its low topographic relief (Hurwitz et al. Reference Hurwitz, Garfunkel, Ben-Gai, Reznikov, Rotstein and Gvirtzman2002; Inbar, Reference Inbar2012; Segev et al. Reference Segev, Lyakhovsky and Weinberger2014; Rosenthal et al. Reference Rosenthal, Ben-Avraham and Schattner2019; Wald et al. Reference Wald, Segev, Ben-Avraham and Schattner2019). Until Pliocene time, subsidence of the complex took place under a DST transtension regime (Rosenthal et al. Reference Rosenthal, Ben-Avraham and Schattner2019). A shift to transpression during Pleistocene time altered the deformation pattern north of the complex, leading to uplift of the Lebanese restraining bend, breaching of the Hula basin (Fig. 1; Freund, Reference Freund, Garfunkel, Zak, Goldberg, Weissbrod, Derin, Bender, Wellings and Girdler1970; Walley, Reference Walley1998; Gomez et al. Reference Gomez, Khawlie, Tabet, Darkal, Khair and Barazangi2006, Reference Gomez, Karam, Khawlie, McClusky, Vernant, Reilinger, Jaafar, Tabet, Khair and Barazangi2007; Schattner & Weinberger, Reference Schattner and Weinberger2008; Weinberger et al. Reference Weinberger, Schattner, Medvedev, Frieslander, Sneh, Harlavan and Gross2011) and N–S extension and subsidence of the Lower Galilee (Figs 1, 4; Matmon et al. Reference Matmon, Wdowinski and Hall2003; Schattner et al. Reference Schattner, Ben-Avraham, Lazar and Hüebscher2006 a; Wald et al. Reference Wald, Segev, Ben-Avraham and Schattner2019).

Fig. 5. Bouguer gravity anomaly map of the study area (values in milliGal; coloured background) overlaid with a reduced-to-pole (RTP) magnetic anomaly map (values in nanotesla; after Schattner et al. Reference Schattner, Segev, Mikhailov, Rybakov and Lyakhovsky2019). Main magnetic anomalies discussed in the text are marked in pink font, with corresponding polarity (plus/minus): SHA – Sha’ar Ha’golan; TK – Tel Katzir; HA – Haruv anomaly; RA – Raqqad anomaly. Light blue line marks the present Lake Kinneret coastline. Black lines mark the main faults along the Dead Sea Transform (DST) valley and its shoulders. Blue stars mark previously reported volcanic centres, Mt Nimron (MN), Al-Himmah vent (AH) and vents (a)–(d) mentioned in the text and Figure 8. The sharp NNE-striking steep gravity gradient follows the Western Marginal Fault (WMF), which represents the main DST strand and plate boundary between the Sinai sub-plate on the west and the Arabian plate on the east. The Eastern Marginal Fault (EMF) is not associated with a continuous and sub-parallel gravity gradient, although it constitutes a normal fault bordering the Kinneret–Kinarot–Bet She’an basin (KKB). Note the prominent gravity anomaly (Yarmouk anomaly, YA) along the Yarmouk River gorge, which includes Hamat Gader (HG). Additional abbreviations as in Figure 2. Israel Transverse Mercator (ITM) coordinates divided by 1000.
Weinstein & Garfunkel (Reference Weinstein, Garfunkel, Garfunkel, Ben-Avraham and Kagan2014) showed that the occurrence of Plio-Pleistocene volcanism along the DST (Fig. 1) is restricted to the Kinneret–Kinarot–Bet She’an basin and the Korazim block, bounding it from the north (Fig. 2). They found no evidence for DST-related mantle melting, and therefore considered that the source of Plio-Pleistocene volcanism relates to the Harrat Ash Shaam. However, they attributed the magma plumbing system to the DST (i.e. ‘on-transform’) and consequently insinuated that extensional stresses related to the DST prevailed during that period. Nevertheless, recent studies have suggested that the extensional stresses relate to the Irbid–Azraq rifting (i.e. Red Sea stress regime), which continued to extend the Arabian and northern Sinai plates through subsidence of both the Lower Galilee and the Irbid–Azraq rift (Lyakhovsky et al. Reference Lyakhovsky, Segev, Schattner and Weinberger2012; Wald et al. Reference Wald, Segev, Ben-Avraham and Schattner2019). The ongoing rifting is further supported by measured seismicity over the last 30 years (Wetzler et al. in prep.). Thus, the DST–Harrat Ash Shaam intersection is a key area for resolving the volcanic on-/off-transform debate and understanding how the volcanism related to the Harrat Ash Shaam persisted during the DST development.
3. Study area
The study area is located at the southern part of the DST–Harrat Ash Shaam intersection (Fig. 1). It extends across the Yarmouk River gorge and the adjacent Kinarot basin (Fig. 2). The following sections (3.a. and 3.b.) describe the stratigraphy, magmatism, and tectonic and topographic development of the study area.
3.a. Stratigraphy
During Oligocene–early Miocene times, the study area experienced widespread erosion, as part of a regional truncation surface that developed across the NE African, Sinai and NW Arabian plates (Fig. 1a; Avni et al. Reference Avni, Segev and Ginat2012; Wald et al. Reference Wald, Segev, Ben-Avraham and Schattner2019). The truncation surface was subsequently covered by middle Miocene (∼17.5 Ma) to recent sedimentary and volcanic units (Fig. 3). Their accumulation pattern represents the topographic imprint of the Irbid–Azraq – Harrat Ash Shaam province and the development of the DST.
The fluvial and lacustrine sediments of the middle Miocene Hordos Formation accumulated over the entire low-lying Kinneret–Kinarot–Bet She’an basin (KKB in Fig. 2). These sediments interfinger with the lava flows of the Lower Basalt Formation in the eastern Galilee and southwestern Golan slopes (Michelson, Reference Michelson1979; Michelson & Mor, Reference Michelson and Mor1985). Moh’d (Reference Moh’d2000) described a correlative basaltic intrusion within the Hordos sediments in the Gilad area of northwestern Jordan (Figs 2, 4). Radiometric ages from the upper Hordos Formation (interbedded mafic rocks and rock salts) found at the Zemah-1 well indicate that the Kinarot basin, which today is ∼500 m lower than its surroundings, had already formed a topographic low ∼13 Ma ago (Fig. 2; online Supplementary Material Figs S1, S2; Segev, Reference Segev2017).
A late Miocene erosional phase (∼12 Ma) truncated the Lower Basalt and older formations. Subsequently, the Umm Sabune Formation conglomerates covered the unconformity with basalts and pyroclastic components within fluvial deposits (Fig. 3; Schulman, Reference Schulman1962; Shaliv, Reference Shaliv1991; Shirav et al. Reference Shirav, Peltz, Baer, Aharon, Agnon, Arkin and Avigad1995). At ∼10 Ma, marine incursions from the Mediterranean formed lacustrine/lagoonal conditions that deposited the Bira Formation carbonates and evaporites over the Lower Galilee and the Kinneret–Kinarot–Bet She’an basin (Shaliv, Reference Shaliv1991; Rozenbaum et al. Reference Rozenbaum, Sandler, Zilberman, Stein, Jicha and Singer2016, Reference Rozenbaum, Sandler, Stein and Zilberman2019). Outcrops of its upper gypsum member at the western margin of the latter basin, and subcrops of thick evaporites (mainly halite) found only in the Zemah-1 well (Fig. 2; online Supplementary Material Figs S1, S2; Segev, Reference Segev2017) indicate that saline water bodies covered this tectonic and topographic depression during deposition of the Bira Formation.
The lower Pliocene Gesher Formation comprises fresh to brackish lacustrine sediments (Figs 2, 3; online Supplementary Material Figs S1, S2). It interfingers with the Fejjas Tuff on both the eastern and western margins of the Kinneret–Kinarot–Bet She’an basin. In places where both formations are absent, the contemporaneous Cover Basalt Formation is found. Therefore, both the Fejjas Tuff and Gesher Formation are considered contemporaneous with the Cover Basalt Formation (Shaliv, Reference Shaliv1991; Heimann et al. Reference Heimann, Steinitz, Mor and Shaliv1996; Rozenbaum et al. Reference Rozenbaum, Sandler, Zilberman, Stein, Jicha and Singer2016).
The Cover Basalt Formation formed a 50–200 m thick succession on the Golan and Galilee slopes, while the transform valley was already topographically lower. The thickness of the Cover Basalt decreases to ∼50 m at the base of the W-facing slope of the Golan, near the Eastern Marginal Fault (EMF in Fig. 2). It increases to 729 m at the centre of the Kinarot basin, where the Zemah-1 well encountered its top at −1384 m (Fig. 2; online Supplementary Material Fig. S2). Three-dimensional gravity modelling suggests that the Cover Basalt accumulated over the entire Kinneret–Kinarot–Bet She’an basin while maintaining a thickness similar to that in Zemah-1 (Rosenthal et al. Reference Rosenthal, Ben-Avraham and Schattner2019). Interpretation of seismic reflection data suggests that the thickness reaches up to ∼1000 m NE of Lake Kinneret (marked YB in Fig. 2; Meiler et al. Reference Meiler, Reshef and Shulman2011). Ar–Ar dating and mapping show that the Cover Basalt age decreases northwards: from 5.42 to 5.65 Ma in the southern Bet She’an basin (B in Fig. 2; Dembo et al. Reference Dembo, Hamiel and Granot2015) and 5.1–4.0 Ma north of Bet She’an (Rozenbaum et al. Reference Rozenbaum, Sandler, Zilberman, Stein, Jicha and Singer2016), to 4.8–3.6 Ma in the Korazim block bounding the Kinneret basin from the north (Fig. 2; Heimann, Reference Heimann1990; Heimann et al. Reference Heimann, Steinitz, Mor and Shaliv1996). To date, geological studies have not mapped any Cover Basalt sources in the Yarmouk River gorge. Similarly, geophysical studies have not associated the magnetic and gravity anomalies there to volcanic centres. The Cover Basalt sources were found ∼17 km north of the gorge and Zemah-1 well (Mor, Reference Mor1986).
The uppermost sedimentary units within the Kinneret–Kinarot–Bet She’an basin include fluvial/lacustrine formations: Erq el-Ahmar (Horowitz, Reference Horowitz1974; Tchernov, Reference Tchernov1975; age 4.4–3.1 Ma; Davis et al. Reference Davis, Matmon, Fink, Ron and Niedermann2011), Ubediye (∼1.5 Ma; Tchernov, Reference Tchernov1987; Martinez Navarro et al. Reference Martinez-Navarro, Belmaker and Bar-Yosef2009), Naharayim (<1.5 Ma; Heimann & Braun, Reference Heimann and Braun2000) and Lisan (Lartet & d’Albert, Reference Lartet and d’Albert1869; age 70–17 ka, e.g. Begin, Reference Begin1974; Kaufman et al. Reference Kaufman, Yechieli and Gardosh1992; Marco, Reference Marco1996).
The Yarmouk Basalt was mapped (Noetling, Reference Noetling1886; Blanckenhorn, Reference Blanckenhorn1914; Picard, Reference Picard1932; Michelson, Reference Michelson1973; Mor & Sneh, Reference Mor and Sneh1996) and dated to 0.8–0.6 Ma (Siedner & Horowitz, Reference Siedner and Horowitz1974; Mor & Steinitz, Reference Mor and Steinitz1985; Heimann & Braun, Reference Heimann and Braun2000; Mor, Reference Mor2012). Its flows were suggested to arrive from ∼100 km away from the Yarmouk River gorge outcrops, around Jabel al-Druze in the Syrian part of the Harrat Ash Shaam (Michelson, Reference Michelson1973; Fig. 1), where basalts of similar ages were identified (fig. 2 in Trifonov et al. Reference Trifonov, Dodonov, Sharkov, Golovin, Chernyshev, Lebedev, Ivanova, Bachmanov, Rukieh and Ammar2011). According to Michelson (Reference Michelson1973), the flows entered the Yarmouk River, followed its course along the southern Golan and descended downstream above the Eocene Adulam Formation and Maastrichtian–Paleocene Ghareb and Taqiye formations (Fig. 2). At the Yarmouk outlet, the basalts crop out ∼100 m above the present-day riverbed in an ∼30 m thick succession (Michelson, Reference Michelson1973). They reappear ∼10 km SW, at the Jordan–Yarmouk River confluence, at the centre of the Kinarot basin (YJC in Fig. 2; Braun, Reference Braun1992; Heimann & Braun, Reference Heimann and Braun2000). Hence, the Yarmouk Basalt arrived from off-transform sources located in the Harrat Ash Shaam.
The youngest unit, the Raqqad Basalt, was mapped in the Raqqad and Yarmouk rivers above the Eocene and Maastrichtian–Paleocene formations (Fig. 2; Noetling, Reference Noetling1886; Blanckenhorn, Reference Blanckenhorn1914; Picard, Reference Picard1932; Michelson, Reference Michelson1973; Mor, Reference Mor1989; Mor & Sneh, Reference Mor and Sneh1996). Mor (Reference Mor1989) suggested that the Raqqad Basalt erupted near the Syrian Mt Hermon (MH in Fig. 4), flowed over ∼90 km southward and entered the Raqqad and Yarmouk river gorges. Therefore, the sources of the basalt are most likely located off-transform. K–Ar dating of the youngest Golan volcanic rocks yielded 0.24–0.23 Ma (Mor & Steinitz, Reference Mor and Steinitz1985) and 0.48–0.37 Ma (Mor & Sneh, Reference Mor and Sneh1996) ages. More recent Ar–Ar dating of these volcanic rocks yielded reliable ages of between 0.12 and 0.095 Ma (Inbar & Gilichinsky, Reference Inbar, Gilichinsky, Sagy, Bookman, Hamiel, Mushkin, Nahmias, Medvedev and Heimann2009; Weinstein et al. Reference Weinstein, Weinberger and Calvert2013). The latter seems to represent the Raqqad Basalt age range better. Additional Ar–Ar dating yielded ages with higher errors between 0.151 ± 0.042 and 0.124 ± 0.011 Ma (Ben-Asher et al. Reference Ben-Asher, Haviv, Roering and Crouvi2017). Similar to the Cover and Yarmouk basalts, no Raqqad volcanic sources were found in the Yarmouk River gorge.
The Raqqad Basalt and alluvial deposits almost entirely cover the NE-trending Yarmouk Fault, which downthrows the Golan hanging wall relative to the Mt Gilad footwall (Fig. 2). The fault was suggested to initiate as a dextral strike-slip during the Oligo-Miocene Irbid–Azraq rifting (Fig. 4; Lyakhovsky et al. Reference Lyakhovsky, Segev, Schattner and Weinberger2012; Segev et al. Reference Segev, Lyakhovsky and Weinberger2014). Biostratigraphic evidence indicates that this displacement was later accompanied by a normal component, throwing ∼250 m near Hamat Gader and ∼150 m near Wadi Meitsar to the NE (Fig. 2; Michelson & Lipson-Benitah, Reference Michelson and Lipson-Benitah1986). A recent analysis of earthquake focal mechanisms indicates that the Yarmouk River gorge is currently being subjected to ∼E–W normal faulting (Wetzler et al. in prep.).
3.b. Zemah-1 well
Zemah-1 is the only deep well drilled in the Kinneret–Kinarot–Bet She’an basin (4249 m, 1983; location in Figs 2, 5). Its original reports present a complicated stratigraphy with many open questions concerning units that are not recognized in outcrops, lack indicative fossils and exhibit very few reliable geochronological ages (Marcus & Slager, Reference Marcus and Slager1983, Reference Marcus and Slager1985; Steinitz & Lang, Reference Steinitz, Lang, Marcus, Slager, Ben-Zaken and Indık1984 a,b; Mittlefehldt & Slager, Reference Mittlefehldt and Slager1986; Stein, Reference Stein, Garfunkel, Ben-Avraham and Kagan2014). To clarify these issues, Segev (Reference Segev2017) re-examined and reinterpreted the geochronological data of the well. Relevant details are presented below and in online Supplementary Material Fig. S2.
The lowermost interval includes 964 m of plagio-gabbro and plagio-diabase intrusions (between 4249 and 3285 m) that yielded an Ar–Ar total gas date of 9.5 Ma, and K–Ar dates of 11, 13.7 and 8.5 Ma. This interval correlates to the Lower Basalt Formation and its host Hordos Formation (∼13 Ma). The evaporite layers drilled within the Hordos Formation may represent middle Miocene marine flooding into the Kinneret–Kinarot–Bet She’an basin. Contemporaneous oyster-bearing marine deposits at the top Hordos Formation ∼15 km to the NW (Sneh, Reference Sneh1993) support this interpretation.
The transition between the Hordos Formation and the younger Bira Formation is poorly defined in the well (∼3285 m deep). It consists of an ∼900 m thick layered evaporite succession interrupted by eight intrusive bodies (∼700 m cumulative thickness) and minor marl and limestone layers. These olivine-gabbro and olivine-diabase intrusions are reliably dated to the Pliocene: Ar–Ar 4.05 ± 0.1 Ma (Heimann et al. Reference Heimann, Steinitz, Mor and Shaliv1996), and qualitatively K–Ar 3.6, 3.9, 3.1 and 4.1 Ma (Steinitz & Lang, Reference Steinitz, Lang, Marcus, Slager, Ben-Zaken and Indık1984 a,b), corresponding to the exposed Cover Basalt Formation.
Segev (Reference Segev2017) adopted the exposed Bira Formation age range for the subsurface Bira complex (∼9.1–7 Ma). Its upper contact with the Gesher–Fejjas–Cover Basalt complex (1215 m) comprises marl and limestone overlain by a 729 m thick basaltic unit (up to 486 m depth). The basalt sample from 1039 m (176 m above the base) yielded an Ar–Ar age of 4.9 Ma (Stein, Reference Stein, Garfunkel, Ben-Avraham and Kagan2014) that fits well with the oldest ∼5.0–4.3 Ma Cover Basalt exposures in the southern Golan (Ron et al. Reference Ron, Heimann and Garfunkel1992). A 4.48 Ma age, the K–Ar date of a basalt sample from 679 m depth, agrees with the 4 Ma age of the exposed top Gesher–Feijjas–Cover Basalt complex.
4. Methods
The current study analyses the following data sources:
-
(i) Magnetic anomaly map: interpretation of a 1 km grid regional reduced-to-pole (RTP; Fig. 5; online Supplementary Material Fig. S3) map focusing on the study area. A detailed description of the magnetic data acquisition and processing, RTP map construction and analysis principles appears in Schattner et al. (Reference Schattner, Segev, Mikhailov, Rybakov and Lyakhovsky2019). The polarity, dimensions and shapes of the RTP magnetic anomalies represent (mainly) basic igneous volumes located in the subsurface (magneto-stratigraphy in online Supplementary Material Fig. S1). Their positive or negative polarity (Fig. 5) represents the integrated effect of all magmatic bodies located directly below the mapped anomaly. The high correlation between the location and polarity of the RTP magnetic anomalies and exposed volcanic centres indicates that the remaining uncorrelated anomalies represent buried magmatic bodies (Schattner et al. Reference Schattner, Segev, Mikhailov, Rybakov and Lyakhovsky2019).
-
(ii) Gravity anomaly map: interpretation of a 250 m grid Bouguer gravity anomaly map (Fig. 5; Supplementary Material Fig. S4) focusing on the study area. Gravity data acquisition, processing and map construction are detailed in Rosenthal et al. (Reference Rosenthal, Segev, Rybakov, Lyakhovsky and Ben-Avraham2015, Reference Rosenthal, Ben-Avraham and Schattner2019). Processing of the collected measurements included drift, latitude, free-air, Bouguer and terrain corrections. Latitude correction was calculated according to the 1967 Geodetic Reference System formula. Datasets of the digital elevation model (DEM) used for free-air, Bouguer and terrain corrections are after Hall (Reference Hall1993), ASTER GDEM V2 (US/Japan ASTER Science Team, 2011; a product of METI and NASA) and BENTAL (National Topographic Database) of the Survey of Israel. Bouguer correction was calculated using a density of 2.67 g cm−3 (Rybakov et al. Reference Rybakov, Goldshmidt, Fleischer, Rotstein and Goldberg1995, Reference Rybakov, Lyakhovsky and Segev2010). Terrain correction included replacing the measured elevation value with DEM values to maintain consistency. For more explanations, see Rosenthal et al. (Reference Rosenthal, Ben-Avraham and Schattner2019).
-
(iii) Temperature and heat flux: interpretation of temperature- and heat-flux data from previous studies (Mazor et al. Reference Mazor, Kaufman and Carmi1973; Eckstein & Simmons, Reference Eckstein and Simmons1977; Levitte & Eckstein, Reference Levitte and Eckstein1978; Starinsky et al. Reference Starinsky, Katz and Levitte1979; Michelson, Reference Michelson1981; Gettings & Showail, Reference Gettings and Showail1982; Arad & Bein, Reference Arad and Bein1986; Baijjali et al. Reference Baijjali, Clark and Fritz1997; Shalev et al. Reference Shalev, Lyakhovsky, Weinstein and Ben-Avraham2013; Reznik & Bartov, Reference Reznik and Bartov2021) focusing on the study area (Fig. 6). The temperature field (heat flux) is closely related to the lithospheric thickness and rheology, its brittle versus ductile deformation style, the depth of the seismogenic zone and magmatism (Ranalli, Reference Ranalli1995; Ranalli & Rybach, Reference Ranalli and Rybach2005; Jaupart & Mareschal, Reference Jaupart and Mareschal2010). The temperature field is a function of (1) the crustal structure, namely the thickness of the lithological unit (sedimentary succession, upper crust, lower crust and the relevant mantle); (2) the radiogenic heat-production parameter of each layer; (3) the thermal conductivity; and (4) mantle contribution by either (a) an induced thermal perturbation, or ‘active’ source mantle plume; or (b) thinning of the lithosphere by tectonic extension that resulted in mantle rising, or ‘passive’ source (Stein et al. Reference Stein, Garfunkel and Jagoutz1993; Regenauer-Leib et al. Reference Regenauer-Lieb, Rosenbaum, Lyakhovsky, Liu, Weinberg, Segev and Weinstein2015).
-
(iv) A 1:50 000 scale geological map: integration of new evidence with a compilation of previous maps of the southern Golan, Yarmouk River gorge and northern Mt Gilad (after Segev, Reference Segev2020 and sources: Michelson, Reference Michelson1979; Michelson & Mor, Reference Michelson and Mor1985; Mor & Sneh, Reference Mor and Sneh1996; Moh’d, Reference Moh’d2000; Sneh et al. Reference Sneh, Bartov and Rosensaft1998; Mor, Reference Mor1986, Reference Mor2012; Sneh, Reference Sneh2017) to produce a new and updated 1:50 000 geological map of the Kinneret–Kinarot region (Figs 7, 8).
-
(v) Topography maps (Survey of Israel, 1:50 000 scale) and digital terrain model (DTM of 25 m grid, from Hall & Cleave, Reference Hall and Cleave1986; Fig. 9; online Supplementary Material Fig. S5) were used for constructing topographical contours and projecting them on to Google Earth satellite images (Figs 10a, 11; online Supplementary Material Figs S6–S8).
-
(vi) High-resolution orthophotos of the Yarmouk River gorge (Survey of Israel, 0.5 m pixel), field photographs and Google Earth satellite images (∼1 m pixel; location of figures in Fig. 9; online Supplementary Material Figs S6–S9).
-
(vii) Radiometric ages: re-evaluation of available K–Ar and Ar–Ar measurements from Zemah-1 well (Marcus & Slager, Reference Marcus and Slager1983, Reference Marcus and Slager1985) to establish a new stratigraphic amendment for this well. Dating was carried out mainly at the Geological Survey of Israel laboratory: K–Ar as described in Steinitz & Lang (Reference Steinitz, Lang, Marcus, Slager, Ben-Zaken and Indık1984 a,b); Ar–Ar as described by Heimann et al. (Reference Heimann, Steinitz, Mor and Shaliv1996).

Fig. 6. (a) Calculated geothermal heat flow (mW m−2) in northern Israel from temperatures measured in boreholes (marked by black dots; modified after Shalev et al. Reference Shalev, Lyakhovsky, Weinstein and Ben-Avraham2013). (b) Present-day heat-flow map (solid lines – contour interval of 10 mW m−2, dashed lines – contour interval of 5 mW m−2) based on temperatures measured in wells in the southern Golan (black dots mark the location of wells: Ness 2, 3, 5, 10 and 12, ES – Ein Said; modified after Reznik & Bartov, Reference Reznik and Bartov2021). North of the Sheikh Ali Fault (SAF), values are based only on the Ness 10 borehole. Dashed red lines mark the suggested limits of the northern and southern Golan volcanic districts. Geographical coordinates.

Fig. 7. Geological map of the western Golan slopes facing the northeastern Lake Kinneret (part of the Eastern Teverya sheet; modified after compilation of Sneh, Reference Sneh2017; from Michelson & Mor, Reference Michelson and Mor1985). Enhanced numbers note the base Cover Basalt elevation (metres above sea level) along its contact with the underlying Eocene, Oligocene, Miocene and Pliocene formations. Abbreviations in green font are as in previous figures. KH – Kfar Haruv; SU – Susita. Abbreviations in black font refer to geological formations listed in the legend and Figure 3. The extent of this map is marked on Figure 9.

Fig. 8. (a) Geological map of the Yarmouk River region (after Segev, Reference Segev2020; Sources: Michelson & Mor, Reference Michelson and Mor1985; Moh’d, Reference Moh’d2000) and (b) N–S cross-section (A–A′) of the Yarmouk River gorge. Yarmouk (Y) and Raqqad (R) volcanic terraces are marked along the Yarmouk River gorge, together with volcanic vents and volcanos (see legend). Thick black dashed ellipses mark the suggested extent of the Yarmouk Cover Basalt volcano. Abbreviations are as in previous figures. Israel Transverse Mercator (ITM) coordinates divided by 1000.

Fig. 9. Elevation map and location of the southern Golan volcanic eruption centres, settlements and Zemah-1 well (extent marked in Fig. 2). Black frames mark the location of the other figures, including aerial photos and their view direction (marked by an arrow). Note the concentric peripheral flexure south of the Yarmouk (Jordan) that centres around the Raqqad volcanics. Black dashed-line frames mark the ∼9 km long Yarmouk River and the ∼6 km long Raqqad River morphological segments. These two segments were used for morphological correlation (description in text). Basalt/scoria eruptive centres marked: TB – Tel Bezek; TAS – Tel A-Saki; TAE – Tel Abu Eitar; K – Koayiah volcano; M – Meitzar volcano; SEB – Shaq el Barid volcano; AA – Al Adassiyah; Y – Yarmouk volcano. Additional abbreviations are as in previous figures. Israel Transverse Mercator (ITM) coordinates divided by 1000.

Fig. 10. (a) Northward-facing Google Earth-based aerial photo with overlaid digital terrain model (DTM)-based topographic red contours, and geological contacts of basalt units: pale blue – Yarmouk Basalt (Qβy); magenta – Cover Basalt (Pβc). The yellow line marks the Jordan–Syria border along the Yarmouk River. Y-I–Y-III, Yarmouk Basalt terraces mark the most upstream northeastward lava flows from the Koayiah volcano (in panel (a)). (b) The circular Meitsar basaltic vent (black) and the steep sidewalls of another postulated volcanic (phreatic) vent (yellow) are cut by the Raqqad River. Green line – Raqqad Basalt (Qβr); pale blue line – Yarmouk Basalt (Qβy); magenta line – Cover Basalt (Pβc); yellow line – Jordan–Syria border along the Yarmouk River. Y3–Y7 – Yarmouk Basalt terraces; R1–R8 – Raqqad Basalt terraces. White frames mark the location of the following field photos. Map data: ©2018 Google, CNES/Airbus/ ©2019 Maxar Technologies/ Landsat/Copernicus. ©2013 DigitalGlobe/ U.S. Dept of State Geographer. ©2018 ORIONHME.

Fig. 11. (a) SSE-facing Google Earth-based aerial photo with overlaid DTM-based topographic contours (red) and main geological units: the basaltic Shak el Barid cone (dashed white circle), Al-Himmah, two additional vents and the postulated Birkat Al Arayes vent (dashed yellow circles). White lines mark landslide scars (LS). Black lines indicate incomplete steep sidewalls of covered volcanic vents. Pale red lines mark the Yarmouk Basalt outcrops (Qβy). Purple lines mark the Raqqad Basalt (Qβr) outcrops. Location in Figure 9. Map data: ©2018 Google, CNES/Airbus/ ©2019 Maxar Technologies/ Landsat/Copernicus. ©2013 DigitalGlobe/ U.S. Dept of State Geographer. ©2018 ORIONHME.
5. Results
5.a. Geophysical evidence
Two pairs of magnetic anomalies occur along the Yarmouk River gorge, in the adjacent Kinarot basin, across the Eastern Marginal Fault (location in Fig. 5; online Supplementary Material Fig. S3): (i) strong and weaker negative anomalies of −175 nT (YA) and −100 nT (SHA); (ii) two strong positive anomalies of 200 nT, marked as HA and TK in Figure 5. The southern part of these anomalies partially overlaps a prominent Bouguer gravity anomaly (Fig. 5; online Supplementary Material Fig. S4). This 10 × 5 km NE-trending Bouguer anomaly extends east of the DST along the Yarmouk River gorge (henceforth the Yarmouk anomaly). Its peak values reach −9 mGal, higher than its immediate surroundings of c. −20 mGal. A second prominent Bouguer gravity anomaly occurs ∼10 km to the south, over the Ajlun region of the Gilad (Fig. 5; online Supplementary Material Fig. S4).
The heat-flow map presented in Figure 6 shows values ranging between 40 and 45 mW m−2. However, exceptionally higher values of c. 90 mW m−2 (170–200 °C) were recorded in the Yarmouk River gorge (Fig. 6). Temperatures measured in geothermal springs and artesian wells along the gorge reached up to 50 °C.
5.b. Geological evidence
Three basaltic horizons were mapped in the Miocene Hordos Formation along the southwestern Golan slopes (Figs 2, 7, 8). The basaltic outcrops are composed of altered coarse crystals. The rocks were dated by K–Ar in six locations (Table 1). In the Gilad region, south of the gorge, a basaltic dyke penetrated the succession up to the Miocene Waqqas Conglomerate (correlative to the Hordos Formation).
Table 1. K–Ar dates by Mor (Reference Mor1986), Shaliv (Reference Shaliv1991) and Segev (Reference Segev2017)

The intrusions in the Zemah-1 well, below 3300 m, contain a generally fine-grained lithology, showing a slight general transition between plagioclase-rich gabbro and diabase. These rocks differ somewhat from the Pliocene olivine gabbro hosted by the Bira and Gesher–Feijjas–Cover Basalt complex (Fig. 3; online Supplementary Material Figs S1, S2). Re-evaluation of all radiometric dates from these intrusions in the Zemah-1 well, based on analytical and geological considerations, shifts the previous ages of 8.5, 11 and 13.7 Ma (Steinitz & Lang, Reference Steinitz, Lang, Marcus, Slager, Ben-Zaken and Indık1984 a,b) to an average of ∼13 Ma (Segev, Reference Segev2017). The late Miocene southern Golan alkali basalts are only mildly undersaturated in silica, having low concentrations of incompatible elements (Weinstein, Reference Weinstein2000).
The updated 1:50 000 scale Kinneret–Kinarot geological map provides a comprehensive view of the Yarmouk River gorge, covering both its northern and southern banks (Fig. 8). The map shows that rocks belonging to the Cover Basalt Formation make up a large area of the Umm Qays cliffs facing the Yarmouk River from the south (see also outcrops in Fig. 12a, c; online Supplementary Material Fig. S6). This basaltic unit covers the upper ∼275 m of the Umm Qays cliffs (location in Figs 8, 9; online Supplementary Material Fig. S6). It extends down to ∼50 m above sea level, where it is cut by a younger landslide (Fig. 12a; online Supplementary Material Fig. S6). This ∼3 km2 landslide overlies the southern Yarmouk bank (shaded grey areas in Fig. 8). It places lower Eocene (Adulam Formation) and Pliocene Cover Basalt Formation rocks over the Maastrichtian–Paleocene Ghareb and Taqiye formations (Figs 8, 12). In contrast, the Cover Basalt Formation covers the entire upper part of the western slope of the Umm Qays plateau (Fig. 8; online Supplementary Material Figs S5, S6). There, the basaltic unit extends downslope without faulting until Al Adassiyah, at c. −200 m elevation, reaching the Kinneret–Kinarot–Bet She’an basin surface elevation.

Fig. 12. (a) Southward-facing photo overlooking, from top to bottom: the Umm Qays basaltic plateau, the Cover Basalt cliff (for more explanation, see Fig. 9) and the southern Yarmouk riverbank. The riverbank consists of Raqqad Basalt terrace R11 at the base, Maastrichtian–Paleocene marl covered by the Yarmouk Basalt terrace Y9 and alluvium (Al). (b) ESE-facing field photo downstream of the Yarmouk River gorge. The Raqqad Basalt (Qβr) terraces (R11, 12; purple symbols) appear on both riverbanks, whereas terrace R13 appears at the base and the Yarmouk Basalt (Qβy) higher terrace Y10 (pale red symbols) on the upper part of the hill. The Eocene Adulam Formation and Fault on the northern riverbank (right-hand side, see Fig. 9) face the Maastrichtian–Paleocene Ghareb and Taqiye formations on the southern riverbank (KTgt). Location and viewpoint are marked in the inset. (c) SE-facing photos of northeastern Gilad, Jordan. The Pliocene Cover Basalt, which appears on the Umm Qays plateau on top (above 300 m), forms a continuous outcrop that follows the westward-facing slope, down to Al Adassiyah (AA in Fig. 9) in the DST valley, at c. −200 m.
Over the northern Yarmouk bank, the Cover Basalt shows a similar makeup to its southern Umm Qays equivalent. Its base contact is situated at ∼300 m above sea level in both plateaus (Figs 8, 9, 12a; online Supplementary Material Fig. S5), and its flows reach down to c. −150 m elevation, east of Tel Katzir (TK) (Figs 8, 9). Today the Cover Basalt appears in isolated outcrops, divided by colluvium, slides and Eocene–Oligocene formations (Fig. 8). Additional 729 m thick flows were penetrated by the Zemah-1 well, i.e. in the topographically lower Kinneret–Kinarot–Bet She’an basin, west of the Eastern Marginal Fault (Fig. 2; online Supplementary Material Figs S1, S2). This section is about three to five times thicker than the Cover Basalt exposed on the TK hill and Golan slope. Further north, the base Cover Basalt shows a similar westward descent from an elevation of ∼300 m along the eastern margin of the map presented in Figure 7, through ∼250 m near northern Kfar Haruv (KH) and 90–50 m near Susita (SU) (Fig. 7), to −150 m on the coast of Lake Kinneret. Two shield volcanos (RZ and NA), one scoria cone (BY), and additional centres occur in the east and north (Figs 2, 7).
5.b.1. Late Pleistocene volcanism in the gorge
5.b.1.a. Yarmouk Basalt volcanism
A new volcanic structure (Koayiah volcano) was identified on the northern Yarmouk riverbank, ∼6 km east of the Raqqad and Yarmouk rivers confluence and the Israel–Jordan–Syrian border junction (Figs 2, 9, 14; online Supplementary Material Fig. S7). Aerial photos of the volcano show black basaltic rocks vertically cross-cutting white Eocene chalks, in an elevation range of ∼0–125 m. The basalts cover the palaeo-riverbed, which constituted the relief during the volcanic eruption (∼0.8–0.6 Ma, after Heimann & Braun, Reference Heimann and Braun2000; Fig. 10a). Irregular white-grey Eocene blocks appear within the basaltic conduits (Fig. 10a).
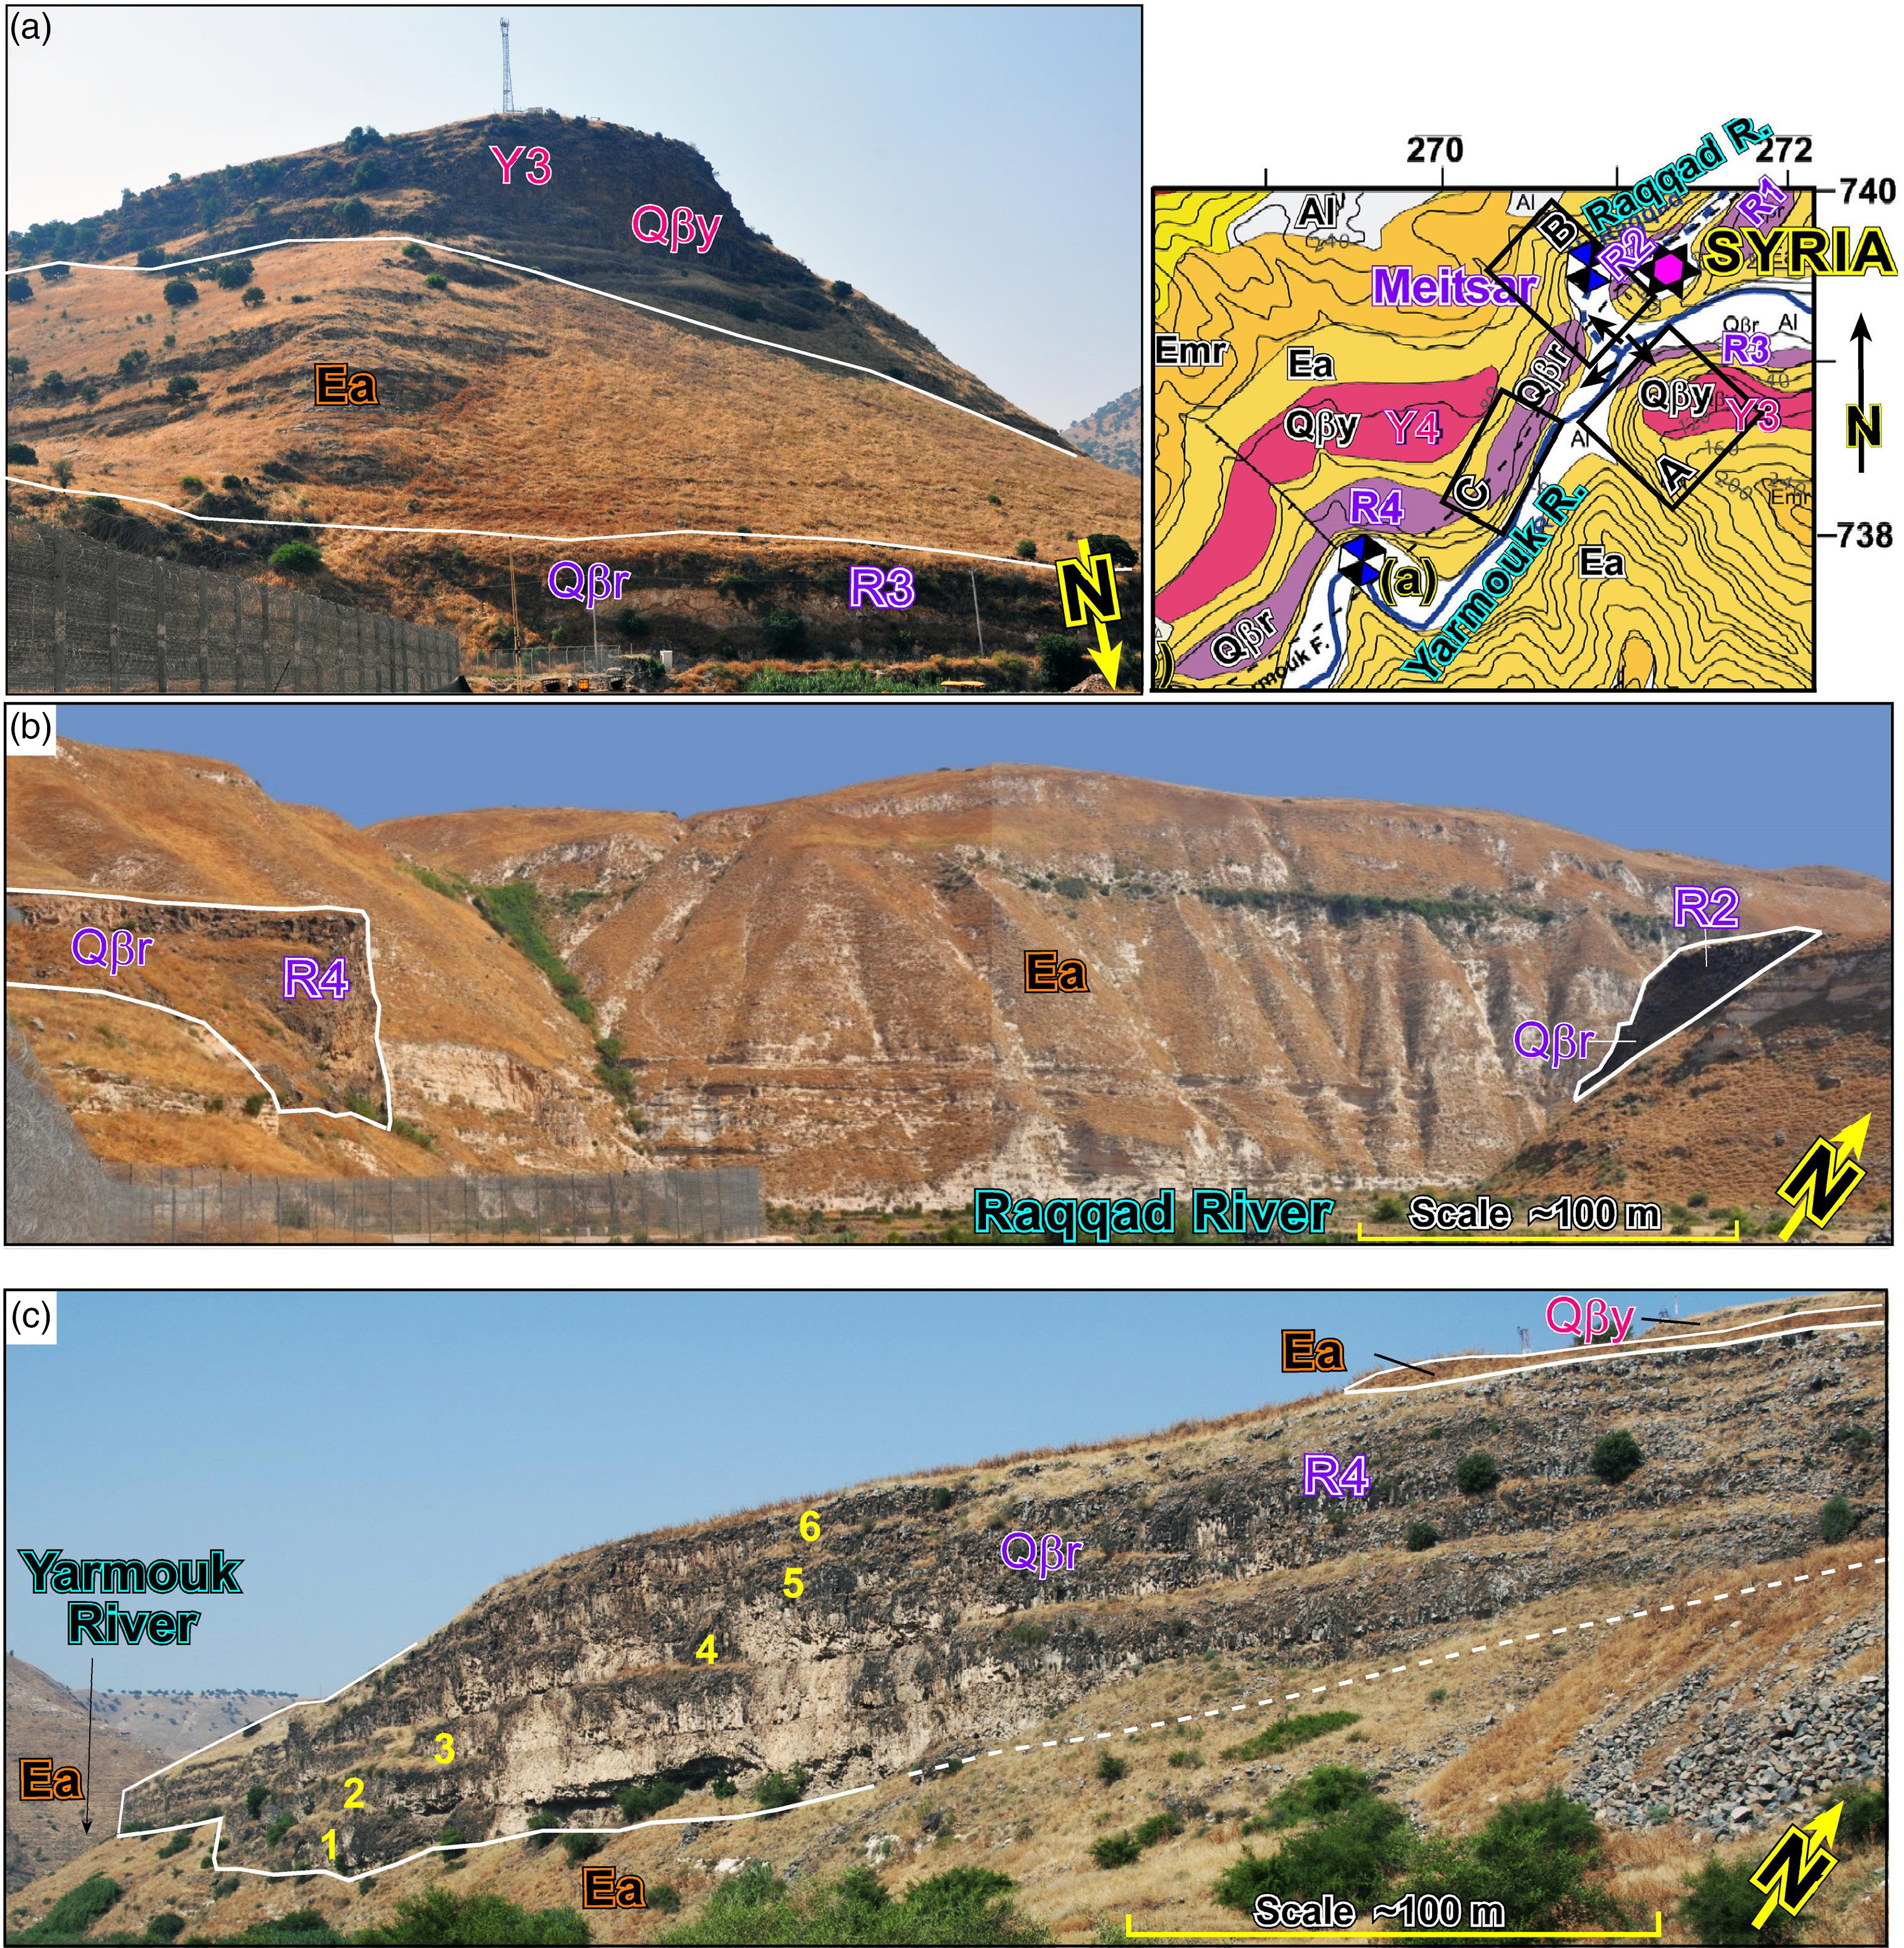
Fig. 13. Field photos showing the riverbanks and volcanic units (location of all photos on inset geological map). (a) Southward view from the Yarmouk River showing the Yarmouk Basalt terrace Y3 slope at the hilltop, and Raqqad Basalt terrace R3 at its bottom. (b) View from the Yarmouk–Raqqad confluence upstream of the Raqqad River outlet. The river eroded the basalt flow (R2 terrace relic) from the Meitsar volcano toward the SW, to the narrow R4 terrace. (c) A westward view of Raqqad Basalt (Qβr) terrace R4 on the Yarmouk riverbank. The six lava flows (white numbers) form the ∼80 m thick terrace that probably flowed from the Meitsar volcano southwestward, partly within a narrow channel, before passing through the Yarmouk–Raqqad confluence into the wider (∼600 m) Yarmouk palaeo-channel (Fig. 14).

Fig. 14. Restoration of the volcanic sources and flows illustrated over the present-day elevation map: (a) Yarmouk Basalt in pale red; (b) Raqqad Basalt in purple; (c) present-day distribution of both basaltic units. The thick black polygons bound the outcrop extent of the relict basalt terraces: Yarmouk – Y1–12 west of the volcano and YI–III east of it; Raqqad – R1–11. We suggest that the ∼0.7 Ma Yarmouk Basalt erupted from the Koayiah volcano (white star) and flowed downstream into the central Kinarot basin (Fig. 2; Heimann & Braun, Reference Heimann and Braun2000); the ∼0.1 Ma Raqqad Basalt erupted from the Meitsar and Shaq el Barid basaltic volcanos (red and white stars). Note the wide (up to ∼1 km) sinuosity class channel having a tortuosity coefficient of 1.0–1.25 (see Fig. 13c; after Petts, Reference Petts1986). AW – Al-Wehda dam. Additional abbreviations are as in previous figures. Israel Transverse Mercator (ITM) coordinates divided by 1000.
At its upper part, the Koayiah volcano lava sheet is ∼150 m thick. Its top reaches an elevation of ∼275 m, which is ∼25 m below the irregular unconformity underlying the Pliocene Cover Basalt, whose palaeo-channels incise down to the top Yarmouk Basalt. These incisions facilitated the downward migration of the Cover Basalt topsoil to cover large parts of the much younger Yarmouk Basalt, making its definition challenging. On the southern riverbank (Jordan), brown topsoil covers the Pliocene unconformity (Fig. 10a; online Supplementary Material Fig. S7).
The distribution of the Yarmouk Basalt further emphasizes the location of the Pleistocene Koayiah volcano (Figs 2, 10a). The basalt appears as a set of flows extending along, and restricted to, the gorge. Their thickness decreases eastward over ∼3 km to ∼55 m or less (online Supplementary Material Fig. S7), upstream of the Yarmouk River gorge, and they appear on both riverbanks (up to AW in Fig. 14c; Y-I to Y-III basalt terraces).
West of the Koayiah volcano, the Yarmouk Basalt flows were mapped along ∼30 km downstream in the gorge (Figs 2, 8, 10b, 11, 14; online Supplementary Material Figs S8, S9). Although the flows are intensively eroded along the river meanders, their base maintains a uniform topographic gradient, from an elevation of ∼125 m on the western side of the Koayiah volcano down to the Y1–Y4 basalt terraces at ∼75 m elevation near the Israel–Jordan–Syrian border. The flows extend further downstream in the gorge, where the present-day river meanders have eroded large parts of the terraces (Fig. 14a–c). The flows cross the wide (up to ∼1 km) Yarmouk outlet into the Kinarot basin (Figs 2, 14), where they were dated to ∼0.8–0.6 Ma at the Yarmouk–Jordan river confluence (Heimann & Braun, Reference Heimann and Braun2000).
5.b.1.b. Raqqad Basalt volcanism
The present study re-examined all previous geological mapping of Raqqad Basalt outcrops NE of the Raqqad–Yarmouk river confluence (Figs 2, 10b, 14). While the inaccessibility of the Raqqad River gorge prevented on-site examination, the integration of surficial and geological data examined here indicates that some of the outcrops previously identified as Raqqad Basalt are more likely sliding blocks related to the Cover Basalt.
A concentric structure located at the Raqqad entrance to the confluence is identified as a basaltic vent relic, named here the Meitsar volcano (Figs 10b, 14b; online Supplementary Material Figs S8, S9). The centre of the vent is covered by fluvial sediment, surrounded by ∼5–10 m high basalt terraces from all directions (R1–R4, becoming younger upward as in Fig. 13c). The western side of this circular structure is bounded by an arch-shaped cliff of Eocene formations (Fig. 13b; online Supplementary Material Fig. S9).
Further from the Meitsar volcano, about six consecutive basaltic lava flows indicate the southwestward flow direction starting in a narrow channel (Fig. 13b, c). The flows entered the Raqqad–Yarmouk river confluence and continued downstream along the wider (∼600 m) Yarmouk River gorge (Fig. 14b). The R4 terrace filled the Yarmouk channel from c. −50 m elevation to ∼30 m (∼80 m thick), flowing downstream until terminating after ∼6 km (Figs 8, 14b; online Supplementary Material Fig. S8). At the southwestern tip, R4 outcrops thin to ∼25 m (between −50 m and −25 m). This terrace terminates before another vent, marked as vent (b) in Figures 8, 14c and online Supplementary Material Figure S8. The younger and smaller basalt terrace R5 is below −100 m, an elevation equivalent to the Shaq el Barid terraces (Fig. 14b, c; online Supplementary Material Figs S8, S10; see below).
About 8.5 km downstream of the Meitsar volcano, a second Raqqad Basalt eruption source is identified as the Shaq el Barid volcano (Figs 8, 11, 14b, c; online Supplementary Material Figs S8, S10). It is located at the intersection between the NE-trending Yarmouk and N-trending Wadi Meitsar faults. It is also ∼2.5 km away and ∼30 m lower than the SW tip of the R4 terrace (Fig. 14b; online Supplementary Material Fig. S8). The cumulative ∼70 m thickness of the Raqqad Basalt at the volcano decreases to about half downstream and upstream of the Yarmouk River gorge. The Shaq el Barid volcano conveyed lava flows downstream in the gorge for over ∼9 km until reaching its outlet into the Kinarot basin (Figs 8, 14b, c). Today, the Yarmouk River and Fault cross-cut the Raqqad Basalt flows (between terraces R7 and R8, and between terraces R12 and R13; Fig. 12b).
The Al-Himmah vent is located further SW along the Yarmouk Fault and gorge (Figs 8, 11, 14c; online Supplementary Material Figs S8, S11). However, unlike the other volcanos, its structure is closest to a complete cone, built within lower Eocene Adulam Formation chalks. Its ∼190 m high rim is unusually steeper (∼70°) than the adjacent Golan erosional slopes (∼30°; online Supplementary Material Fig. S11), forming a sharp 180° turn in the Yarmouk River direction.
Four additional volcanic vents, and two attached to the basaltic volcanos, were detected along the straight ∼9 km long segment of the gorge, between Meitsar volcano and Al-Himmah vent (marked as (a)–(d) in Figs 8, 14c; online Supplementary Material Fig. S8). Their size and preservation are less prominent than the Al-Himmah vent. Nonetheless, they show partial characteristics of an exceptionally steep, arched-shaped northern rim wall and a moderate southern face covered by landslides, talus and river sediments. The Birkat Al Arayes is somewhat different from the other vents along the gorge (Figs 11, 14c; online Supplementary Material Figs S8, S12), and still questionable. It is an ∼200 m wide permanent pond, located in a 20–60 m low depression, ∼600 m south of the Yarmouk River.
5.c. Structural elements
The fragmented NE-trending Yarmouk Fault downthrows the southern Golan relative to the structurally elevated Mt Gilad to its south (Fig. 8). Most of the fault traces are covered by the Raqqad Basalt and alluvium. The displacement of the Yarmouk Fault was previously determined using biostratigraphic considerations. Michelson & Lipson-Benitah (Reference Michelson and Lipson-Benitah1986) pointed out that an ∼150 m thick succession is missing from the base of the upper lower Eocene Adulam Formation (marked HG in Fig. 8a). Its exposed section near the Ein Said well (ES in Fig. 6) includes ∼170 m out of ∼320 m (Fig. 8b). South of the HG segment of the Yarmouk Fault, the footwall exposes the ∼100 m thick Maastrichtian–Paleocene Muwaqqar (Ghareb and Taqiye) Chalk Marl Formation against the upper Adulam Formation (Fig. 8b). These relationships represent an ∼250 m normal stratigraphic displacement that decreases northeastward to ∼150 m near the Wadi Meitsar outlet, owing to motion across secondary, mainly NNW-trending, normal faults (Fig. 8). These secondary faults cross the modern Yarmouk River, displace the Cover Basalt and affect the river meandering.
At the river outlet, the westernmost Yarmouk Fault segment reaches the transform Eastern Marginal Fault in a fan-like geometry (EMF in Fig. 8a). In this area, the presence of the Eastern Marginal Fault is obscure. North of the Yarmouk outlet, the Eastern Marginal Fault is mostly concealed west of the TK hill and along the eastern margin of Lake Kinneret. It was previously marked east of the TK hill based on topographic considerations (Figs 2, 8). The Eastern Marginal Fault terminates toward the NE corner of Lake Kinneret, at the Sheikh Ali Fault (Figs 2, 7).
6. Discussion
6.a. Geophysics
The 1 km grid RTP magnetic anomaly map presented in Figure 5 is part of a 1 km grid that covers a 65 × 45 km area of the eastern Galilee, the DST valley and the Golan (online Supplementary Material Fig. S3; Schattner et al. Reference Schattner, Segev, Mikhailov, Rybakov and Lyakhovsky2019). A comparison between magnetic anomalies and independent mapping of the exposed volcanic eruption centres (e.g. Mor, Reference Mor1986) shows a strong correlation in both location and polarity. The correlation emphasizes the accuracy of the RTP magnetic anomaly map and supports its use for predicting the location of additional buried basaltic bodies that do not appear on the present surface. The polarity of an anomaly indicates that the volcanic body formed either during a single polarity era or several eras of similar polarity.
Volcanic eruption centres were not reported from within the Kinneret–Kinarot–Bet She’an basin. It is therefore likely that the anomalies detected there represent subsurface basaltic bodies that mainly fill deep basins within the DST valley, between the Eastern and Western Marginal faults (such as SHA and TK in Fig. 5, and southward in online Supplementary Material Fig. S3; Segev, Reference Segev2019).
The spatial coincidence of the negative and positive magnetic RTP anomalies with the prominent Bouguer gravity anomaly in the Yarmouk River region (Fig. 5; online Supplementary Material Fig. S4) represents a relatively deep and large gabbroic body, consisting of a volcanic centre for the southern Golan, northwestern Jordan and southwestern Syria. The Ajlun Bouguer gravity anomaly, ∼10 km to the south, has been reported in previous studies to represent the exposed Cretaceous Judea Group carbonate section, as part of the regional Syrian Arc anticlinorium (Ginzburg, Reference Ginzburg1960; Segev & Rybakov, Reference Segev and Rybakov2011).
The spatial coincidence of these anomalies with the highest heat-flux and temperature values (Fig. 6) strengthens the possibility of a volcanic system underneath the gorge. The heat source in the area was previously thought to be associated with (i) a shallow seismogenic zone (Ben-Avraham et al. Reference Ben-Avraham, Haenel and Villinger1978; Aldersons et al. Reference Aldersons, Ben-Avraham, Hofstetter, Kissling and Al-Yazjeen2003; Shamir, Reference Shamir, Enzel, Agnon and Stein2006; Davies & Davies, Reference Davies and Davies2010; Shalev et al. Reference Shalev, Lyakhovsky, Weinstein and Ben-Avraham2013); (ii) magmatic activity of the southern Golan (Stein et al. Reference Stein, Garfunkel and Jagoutz1993; Ben-Avraham, Reference Ben-Avraham, Garfunkel, Ben-Avraham and Kagan2014; Weinstein & Garfunkel, Reference Weinstein, Garfunkel, Garfunkel, Ben-Avraham and Kagan2014); (iii) thermally driven plume rising (Goretzki et al. Reference Goretzki, Inbar, Kühn, Möller, Rosenthal, Schneider, Siebert, Raggad and Magri2016); (iv) groundwater convection systems (Gvirtzman et al. Reference Gvirtzman, Garven and Gvirtzman1997); and (v) ascending hot water from deep hydrological systems, which discharge into the Yarmouk River gorge springs (Arad & Bein, Reference Arad and Bein1986).
Using data from recently drilled wells (Figs 2, 6b), Reznik & Bartov (Reference Reznik and Bartov2021) delineated the magnitude and extent of the southern Golan heat flow. The anomaly centres around the Yarmouk River gorge. It extends NE over more than 15 km while exhibiting an exponential decrease in heat flow. Reznik & Bartov (Reference Reznik and Bartov2021) correlated the thermal anomaly with a localized and shallow causative source (3.5 km below ground level) and interpreted it as a subsurface magma chamber or magmatic intrusions. They associated the heat-flow source with the volcanic events that produced the Yarmouk (0.8–0.6 Ma) and Raqqad (0.2–0.1 Ma) basalts, based on applying a transient point source solution for Green’s function (Carslaw & Jaeger, Reference Carslaw and Jaeger1959). By applying the function to the Golan region, Reznik & Bartov (Reference Reznik and Bartov2021) showed that radial propagation from a heat pulse via thermal conduction requires several hundred thousand years to form the observed heat-flow values, depending on the exact location of the heat source. Altogether, the seismic, gravimetric and magnetic data provided here indicate the presence of a magmatic intrusion and magmatic chamber under the Yarmouk River gorge.
6.b. Geology
Surface evidence mapped and dated across the Yarmouk River gorge and its bounding Golan and Gilad regions points to repetitive magmatic activity during Miocene to Pleistocene time outside the transform valley. The Miocene ages of the three basaltic horizons in the Hordos Formation of the southwestern Golan slopes (dated by K–Ar in eight locations; Mor, Reference Mor1986; Shaliv, Reference Shaliv1991; Table 1) correspond with the dyke that penetrated the Gilad region up to the Miocene Waqqas Conglomerate (Moh’d, Reference Moh’d2000; correlative to the Hordos Formation). This correlation, over an ∼15 km long (N–S) area extending over the eastern shoulder of the DST, experienced magmatic activity before the Yarmouk River incised into the shoulder morphology. The average ∼13 Ma age of the intrusions in the Zemah-1 well below 3300 m (Steinitz & Lang, Reference Steinitz, Lang, Marcus, Slager, Ben-Zaken and Indık1984 a,b; Segev, Reference Segev2017) may represent the late Miocene Lower Basalt Formation in the Yarmouk River gorge, although the range is wide. Weinstein (Reference Weinstein2000) correlated the composition of the intrusion to the peridotite end-member underlying the Lower Galilee lithosphere.
The occurrence of Pliocene Cover Basalt plateaus along the location described in the previous paragraph emphasizes the repetitive magmatism on the eastern DST shoulder. Field relationships of the Pliocene Cover Basalt outcrops on the northern and southern banks of the Yarmouk River point to spatial continuity between these volcanic plateaus. The two plateaus are associated here with a common volcanic conduit named the Yarmouk Cover Basalt volcano. Its conduit is estimated to have a width similar to that of the corresponding vertical basaltic outcrop (∼2 km; Fig. 12a; marked by a dashed ellipse in Fig. 8; online Supplementary Material Figs S3, S4). Products of the conduit did not flow further toward the Gilad, since that area was already relatively elevated during Pliocene time (Segev et al. Reference Segev, Lyakhovsky and Weinberger2014). The almost uninterrupted appearance of basalts over the western slopes facing the transform valley (Figs 8, 12c; online Supplementary Material Fig. S6) indicates that the Cover Basalt flowed downslope from the Umm Qays plateau toward the topographically lower Kinneret–Kinarot–Bet She’an basin in the west. Following a ∼5–4 Ma eruption of the Yarmouk Cover Basalt volcano (Ar–Ar age of basalt within the nearby Zemah-1 well and southern Golan; Fig. 3), the Yarmouk River eroded the volcano (Figs 9, 12a, b, 14). Later on, probably during Pleistocene time, landslides displaced Cover Basalt flows along the southern Yarmouk bank (Figs 8, 11; online Supplementary Material Fig. S5, S6).
The southern Yarmouk region marks a state border and is, therefore, less accessible for field measurements. Over the years, there have been fewer magnetic and gravity measurements than in the Golan and Kinneret–Kinarot–Bet She’an basin (e.g. Rosenthal et al. Reference Rosenthal, Segev, Rybakov, Lyakhovsky and Ben-Avraham2015, Reference Rosenthal, Ben-Avraham and Schattner2019; Schattner et al. Reference Schattner, Segev, Mikhailov, Rybakov and Lyakhovsky2019). Therefore, the magnetic signal of the Umm Qays plateau is less clear (Fig. 5; online Supplementary Material Fig. S3). The high Bouguer gravity anomaly in the Yarmouk, which spatially coincides but is much larger than the negative magnetic anomaly (Fig. 5), indicates the presence of a sub-volcanic gabbroic intrusion with opposing magnetic polarities. Its larger SW side presents a stronger reverse magnetic polarity than its smaller NE side and a central weak normal magnetic polarity.
Slightly to the north, the appearance of the Cover Basalt over the DST-facing slopes of the southern Golan is less continuous than the southern equivalent. In this region (MHP and TK in Figs 8, 9), field relationships suggest that the Cover Basalt flowed from the plateau at ∼300 m above sea level, downslope toward the valley. The spatially discontinuous appearance of the flows as isolated outcrops, divided by colluvium, slides and Eocene–Oligocene formations (Fig. 8), was caused by younger, probably Pleistocene faulting and erosion. The faulting is part of the intersection between the Yarmouk Fault and the Eastern Marginal Fault, which deformed the Eocene, Oligocene and Miocene rock formations into a complicated puzzle topped by landslides (Fig. 8; Marcus & Slager, Reference Marcus and Slager1983, Reference Marcus and Slager1985; Michelson & Mor, Reference Michelson and Mor1985; Mor & Sneh, Reference Mor and Sneh1996; Sneh et al. Reference Sneh, Bartov and Rosensaft1998). Three- to fivefold thickening of the Cover Basalt in the Zemah-1 well suggests that the transform valley acted as a sink, which collected the flows that arrived from the transform shoulders. The volcanic sources were located along the gorge, on its banks, further north over the topographically elevated Golan (e.g. RZ, NA and BY volcanos in Figs 2, 7), and on the western margin of the DST valley. Additional sources contributed to the equivalent continuous westward descent and thickening of the entire Bashan Group in the northeastern corner of Lake Kinneret (Figs 2, 9, 15; online Supplementary Material Figs S3, S4; Meiler, Reference Meiler2011; Inbar, Reference Inbar2012).

Fig. 15. (a) Reconstruction of the early Pliocene (∼5.3 Ma), pre-Cover Basalt elevation in the southern Golan using the base Cover Basalt interface from geological maps (Mor, Reference Mor2012; Sneh, Reference Sneh2017; Segev, Reference Segev2020) and subcrop elevations (modified after Meiler, Reference Meiler2011). Syrian and Jordan regions were constructed by extrapolation from the top Judea structural map (Fig. 4). The westward-descending relief illustrates the drainage flow direction from the elevated Golan–Gilad toward the Kinneret–Kinarot–Bet She’an (KKB) basin in the DST valley. This intracontinental tectonically driven valley accumulated terminal marine transgression sediments of the Bira Formation, and later on, the restricted shallow lake deposits of the Gesher Formation. A light blue dashed line bounds the extent of the KKB basin. KB – Korazim block; SAF – Sheikh Ali Fault; YF – Yarmouk Fault; EMF – Eastern Marginal Fault. Additional abbreviations are as in previous figures. Israel Transverse Mercator (ITM) coordinates divided by 1000. (b) Isopach map of the Pliocene–Recent Bashan Group basalts (black contours) overlaying the modern elevation map. The isopach was constructed by subtracting the base Cover Basalt from the present-day elevation. Note the division of the study area into southern (blue line) and northern (yellow line) volcanic districts (see also Figs 7, 10).
The early Pliocene elevation, or palaeomorphology, is reconstructed by the base Cover Basalt interface (Fig. 15a). This map shows the southern Golan drainage system when the continental Kinneret–Kinarot–Bet She’an basin was filled by a terminal marine transgression that formed the Bira Formation, and later on the restricted shallow lakes that deposited the Gesher Formation (Kinneret–Kinarot Lake; Sneh, Reference Sneh2017; Rozenbaum et al. Reference Rozenbaum, Sandler, Stein and Zilberman2019). Rozenbaum et al. (Reference Rozenbaum, Sandler, Stein and Zilberman2019) suggested that the high Gesher Lake surface (the present top Gesher Formation is at ∼300 m) covered large parts of the western Golan. The accumulation of a thick (∼700 m) Cover Basalt layer within the DST contributed to the loading and subsidence of its axial basins during Pliocene time.
The morphological expression of the Yarmouk River gorge began to develop after the Cover Basalt flows ended, and before the Yarmouk Basalt began to erupt. The distribution of the volcanic centres and flows of the Yarmouk Basalt marks the location and orientation of the gorge during their flow over the post-Cover Basalt relief (Fig. 14a). At its outlet, the palaeo-Yarmouk crosses and erodes the Pliocene Yarmouk volcano and divides the Cover Basalt into two plateaus to its north and south (MHP and UQP, respectively; Figs 8, 9, 14).
Previous studies have assumed that the Raqqad Basalt originated near Mt Hermon (MH in Fig. 4) and flowed southward over ∼90 km until it entered the Raqqad River and Yarmouk River gorges (Mor, Reference Mor1989). The geological, morphological and geophysical evidence presented here suggest an alternative explanation. The distinct eastern and western Raqqad Basalt segments (∼6 km and ∼9 km long, respectively) more likely originated from the local volcanic sources identified along the gorge (Figs 8, 14b).
The configuration of the Meitsar volcano suggests that a basaltic cone developed during the initial effusive stage of the volcano. At more advanced stages, the volcano became explosive, blew up its conduit and induced a concentric collapse represented today by the arch-shaped cliff of Eocene formations surrounding the western side of the vent (online Supplementary Material Figs S8, S9). The vent was subsequently eroded by the Raqqad River, while imprinting a meander upstream of the confluence. The Meitsar volcano and its flows aligned with the SW-trending Yarmouk River gorge, hinting at the subsurface location of the Yarmouk Fault.
Similar to the Meitsar volcano, the Shaq el Barid conduit formed a steep and elevated (∼190 m) semi-circular northern wall before blowing up during an explosive stage. Subsequently, its walls collapsed, the conduit was eroded by the Yarmouk River, filled by its fluvial sediments and imprinted the meander visible today (Figs 8, 11; online Supplementary Material Figs S8, S10). The Shaq el Barid volcano conveyed lava flows downstream in the gorge over ∼9 km (including the pre-existing Al-Himmah vent) until reaching its outlet into the Kinarot basin (Figs 8, 14). Hence, this volcano was probably more productive than the Meitsar volcano (Fig. 14b). The locations of the four additional mapped vents (marked as (a)–(d) in Fig. 14c; online Supplementary Material Fig. S8) coincide with the Yarmouk Bouguer gravity, heat-flux and RTP magnetic anomalies and hydrothermal sites, which could hint at more recent volcanic activity (Figs 6, 8).
6.b.1. Effect on the river morphology
The Yarmouk and Raqqad rivers (frames 1 and 2, respectively, on Fig. 14c) exhibit a similar orientation, gradient, lithology and faulting influence. The alignment of vents along the Yarmouk River gorge suggests that these rivers also share similar developmental stages. The southern Raqqad segment has a symmetrical moderate V-shaped river morphology. It comprises Eocene chalk covered by cliff-forming Cover Basalts on both the northern and southern banks (Fig. 2). Small landslides on both sides influenced the sinuosity of this segment.
The Yarmouk segment exhibits an asymmetric V-shaped cross-section with a moderate southern bank. Its steeper northern bank consists of the arches mentioned above, which form the river meanders. These meanders could be attributed to the bypassing of landslides or the river incising within the Raqqad Basalt vents. However, careful examination of the geological map (Fig. 8) shows that meanders (a)–(d) extend alongside the slides and vents (Fig. 14a). Moreover, in the segment between the Shaq el Barid volcano and the Al-Himmah vent, the river incised the Raqqad R7–R8 basalt flow along approximately a straight line following the inferred location of the Yarmouk Fault.
The Yarmouk River gorge developed through several stages and processes (Fig. 14a–c). Both the Yarmouk and Raqqad lavas (0.8–0.6 Ma and 0.2–0.1 Ma, respectively) erupted during phreatic explosions, flowed along the Yarmouk Fault, above a shallow magmatic chamber and within a sinuous river with a tortuosity coefficient (Petts, Reference Petts1986) of 1.06–1.25. However, following the Raqqad volcanic eruptions, the river meandering tortuosity coefficient increased to 1.25–2 (Fig. 14). This increase likely resulted from the intensification of the phreatic explosions caused by the interaction of a shallow magmatic chamber beneath the gorge and the abundant subsurface water above it.
6.b.2. Structural elements
The new geological map suggests that the DST–Yarmouk intersection represents a meeting between two different fault systems, rather than branching of the transform. The geometry of the NE-trending Yarmouk Fault indicates a general N–S extension between the Golan and Gilad regions (north and south, respectively, e.g. Fig. 9). However, the structural arrangement changes at the intersection with the N-trending Eastern Marginal Fault of the DST (Fig. 8a). It includes a structural saddle with reverse faulting (west of TK, Figs 8a, 9), and a NNE-striking Zemah anticline, close to the centre of the Kinarot basin (see the location of Zemah-1 well in Figs 2, 9; Rotstein et al. Reference Rotstein, Bartov and Frieslander1992; Zurieli, Reference Zurieli2002; Schattner & Weinberger, Reference Schattner and Weinberger2008; Inbar, Reference Inbar2012).
While the surface expression of the Eastern Marginal Fault trace is obscured, magnetic data indicate that a series of positive RTP anomalies extend from the western Golan, across the concealed Eastern Marginal Fault and over the entire Kinneret–Kinarot–Bet She’an basin, reaching the eastern Galilee, outside the DST valley (Schattner et al. Reference Schattner, Segev, Mikhailov, Rybakov and Lyakhovsky2019). These anomalies led Schattner et al. (Reference Schattner, Segev, Mikhailov, Rybakov and Lyakhovsky2019) to deduce that only little displacement was accommodated along the Eastern Marginal Fault. Instead, the relative motion between the Arabian and Sinai plates was accommodated by the Western Marginal Fault that continues along a NNE-trending diagonal fault (solid NNE-trending line in Figs 2, 5). The Kinarot Western Marginal Fault has a more prominent appearance than the Eastern Marginal Fault. It bounds the compressional structures and the entire DST Fault valley (e.g. Ubeidiya anticline; Rotstein et al. Reference Rotstein, Bartov and Frieslander1992). Several studies have interpreted the Western Marginal Fault as the main DST surface strand (e.g. Kashai & Croker, Reference Kashai and Croker1987; Ben-Gai & Kashai, Reference Ben-Gai and Kashai2004; Schattner et al. Reference Schattner, Segev, Mikhailov, Rybakov and Lyakhovsky2019). This definition diminishes the recent structural role of the Eastern Marginal Fault and allows the association between the magmatism found in the Zemah-1 well and the Yarmouk River gorge.
Based on broader regional considerations, a previous study deduced that oblique dextral strike-slip motion occurred along the Yarmouk (Segev et al. Reference Segev, Lyakhovsky and Weinberger2014). This displacement down-threw the Golan basin hanging block as part of the Oligocene–early Miocene Irbid–Azraq rifting (Figs 1, 4). The rifting, which pre-dated the DST, extended across NW Jordan in a NW–SE direction. It propagated across the Lower Galilee toward the Mediterranean margin (Schattner et al. Reference Schattner, Ben-Avraham, Reshef, Bar-Am and Lazar2006 b; Lyakhovsky et al. Reference Lyakhovsky, Segev, Schattner and Weinberger2012; Segev et al. Reference Segev, Lyakhovsky and Weinberger2014). Displacement along the DST started at ∼20 Ma, and while it became the dominant structural factor in the region, activity in the Yarmouk River gorge did not stop. The Yarmouk River gorge-related volcanism described here began in middle Miocene time (∼13 Ma). Its immediate sources are detected by the −9 mGal high Bouguer gravity anomaly of the gorge (Fig. 5; online Supplementary Material Fig. S4). This anomaly represents basic intrusions that may have formed since late Miocene time. Later on, extension across the Yarmouk Fault facilitated the arrival of the Pliocene Cover Basalt Formation to the surface.
Regenauer-Lieb et al. (Reference Regenauer-Lieb, Rosenbaum, Lyakhovsky, Liu, Weinberg, Segev and Weinstein2015) studied the Irbid–Azraq propagating rift as an example of an initially slowly extending (1–1.5 mm yr−1) continental lithosphere with a relatively low surface heat flow (∼50 mW m−2). These authors showed that shear heating at the lithosphere base forms melt-rich shear bands. Pre-existing weak areas at the lithosphere base reaching a critical depth of 20 km allowed a fast ascent of melts. Their model showed that the ascent from the lithosphere base to the near-surface lasted over ∼2 Ma.
The Yarmouk and Raqqad magmatism initiated over 10 Ma after the Irbid–Azraq rifting and the associated Harrat Ash Shaam volcanism began. It is reasonable to assume that surface heat flux was higher during the volcanic eruptions along the Yarmouk River gorge, even relative to the present measured values of ∼85 mW m−2 (Fig. 6). Reznik & Bartov (Reference Reznik and Bartov2021) estimated the Pliocene heat fluxes were higher than 115 mW m−2. These considerations emphasize that the Harrat Ash Shaam tectono-magmatic activity was initiated before the DST and persisted contemporaneously with the DST motion. In particular, this activity maintains a prolonged lithosphere extension at the gorge to the present day.
6.c. Tectono-magmatic scenario
The magmatic development of the Yarmouk River gorge provides a key to understanding the tectono-magmatic relationships between the NW-trending Irbid–Azraq rift and the associated Harrat Ash Shaam, with the younger N-trending DST Fault zone. Following the observations presented above, the following conclusions on the tectono-magmatic history can be drawn:
The Oligocene–Miocene NW-trending Irbid–Azraq rift was accompanied by a general NE–SW extension that induced faulting (e.g. initiation of the Yarmouk Fault), subsidence of the central Golan basin, volcanism in parts of the Harrat Ash Shaam volcanic field (which also appear as small basaltic bodies within the Hordos Formation on both banks of the Yarmouk River) and emplacement of plagioclase-rich gabbro and diabase intrusive bodies underneath the Kinarot basin (Zemah-1 well). These events represent the first (∼13 Ma), mainly intrusive, magmatic phase in the southern Golan. It corresponds with the contemporaneous upper part of the Lower Basalt Formation, exposed across the Lower Galilee, west of the DST. The evidence for this Miocene magmatic phase occurs along a corridor that crosses the DST axis: from the Yarmouk River gorge, through the Kinneret–Kinarot–Bet She’an basin and into the Lower Galilee. This magmatic phase is attributed here to the off-transform Harrat Ash Shaam activity. One of its centres was the Yarmouk region. During late Miocene time (pre-Cover Basalt Formation), wide streams flowed downslope from the elevated southern Golan toward the Bira marine ingression from the Levant basin that covered the low-lying tectonic Kinneret–Kinarot basin (represented by the Bira Formation).
Pliocene Cover Basalt Formation lavas flowed downslope toward the Kinneret–Kinarot basin in the DST valley, from the east (Mt Gilad and Golan) and west (Lower Galilee). Their southern Golan volcanos (e.g. RZ, NA, TB and Yarmouk; Figs 5, 7–9) formed an ∼100 m thick basaltic plateau over the pre-river Yarmouk area and filled the Kinneret–Kinarot basin with a >700 m thick basaltic unit. Later, the Pliocene uplift of the Yarmouk region was accompanied by the river incision along the Yarmouk Fault. The river divided this basaltic unit into the southern Umm Qays and northern Mevo Hama plateaus (UQP and MHP in Figs 8, 9, 14, 15), exposed today on the southern and northern flanks of the gorge (respectively) at similar elevations.
Further north, lavas from the eastern Golan volcanic cones descended over the W-facing slopes into a structural-topographic low at the northeastern corner of the Kinneret basin (YB in Fig. 2). As a result, over 800 m of Plio-Pleistocene Bashan Group accumulated north of the Sheikh Ali Fault, while scarce relics remained on the eroded southern Golan steep escarpments (south of this fault and along the eastern margin of the Kinneret basin). Correlative Cover Basalt Formation flows also arrived in the low-lying DST valley (Kinneret–Kinarot basin) from the Lower Galilee in the west. Similar to the Miocene activity, the coeval Pliocene eruptions on both the Arabian and Sinai plates point to an off-transform Harrat Ash Shaam association rather than the DST.
During late Pleistocene time (0.8–0.6 Ma), the ∼30 m thick Yarmouk Basalt flowed through the gorge and the Jordan River toward Naharayim in the central Kinarot basin. The current study defines the Koayiah volcano, on the Jordan–Syria border, as the source of the Yarmouk Basalt volcanism. The extent of this basalt, based on gravity, magnetic, morphotectonic and geothermal data, supports this interpretation.
The youngest basaltic unit, the Raqqad Basalt, produced erratic radiometric data. We correlate these basalts to the youngest volcanic units in the Golan that recently yielded Ar–Ar ages of ∼0.12 Ma. The Raqqad Basalt lavas emanated from at least two centres: (i) the Meitsar volcano, which produced ∼6 km long basalt flows, found near the Raqqad–Yarmouk confluence; (ii) the Shaq el Barid volcano, which produced ∼9 km long basalt flows, found near the Wadi Meitsar–Yarmouk confluence; and (iii) at least six explosive phreatic volcanic vents (two of them next to the basaltic eruption centres) located along the concealed SW–NE Yarmouk Fault, between the Meitsar volcano and Al-Himmah vent. These vents modified the Yarmouk River morphology from sinuous to fixed meandering (Fig. 14).
7. Conclusions
The ∼13 Ma long recurrent magmatic activities underneath the Yarmouk River gorge represent a stationary heat source that produced basaltic melts during late Miocene, Pliocene (mainly) and late Pleistocene times. This ongoing productivity suggests that the source moved together with the Arabian lithosphere during this period, possibly due to its localized thinning associated with the Irbid–Azraq rifting. The source produced the Harrat Ash Shaam through separate localized volcanic districts, such as the NE Golan volcanic chain. The magmatism that occurred along the Yarmouk River gorge defines the southern Golan as a separate magmatic district, which stems from the same source, and tunnelled along the extensional Yarmouk Fault. The Miocene intrusions in the Zemah-1 well have been frequently related to a sub-lithospheric, anomalously hot mantle below the DST. Our study associates these intrusions with the long-lasting off-transform south Golan magmatism and, therefore, with the activity of the Harrat Ash Shaam.
Acknowledgements
We thank V. Lyakhovsky and M. Rybakov for years of joint magnetic and gravity studies in northern Israel, including the Kinneret–Kinarot basin of the Dead Sea Fault. We want to express our appreciation to Doron Mor and Haim Michelson, the pioneers of geological research in the southern Golan. The childhood of the principal author in Kibbutz Shaar HaGolan inspired him to investigate the Kinarot valley and the Yarmouk River gorge. The Geological Survey of Israel management supported this study. We thank N. Wetzler for merging Google aerial photos with topographic contour lines; R. Wald for assisting with the base Cover Basalt interface construction; Y. Avni and M. Beyth, for reviewing the manuscript; D. Mor for reviewing the Kinneret–Kinarot geological map; and S. Shaiak for English language assistance and editing of this manuscript. We thank the editor, an anonymous reviewer and G. Rosenbaum for their constructive comments.
Supplementary material
For supplementary material accompanying this paper visit https://doi.org/10.1017/S0016756821001072


