Introduction
Contemporary external beam radiation treatment modalities such as intensity-modulated radiotherapy (IMRT) and volumetric-modulated arc therapy (VMAT) provide steep 3D dose gradients by complex treatment plans using many beam segments.Reference Bortfeld 1 – Reference Teoch, Clark, Wood, Whitaker and Nisbet 4 These steep dose gradients associated with the target are generated by either delivering the segments through static photon beams (e.g., step-and-shoot IMRT),Reference De Gersem, Claus, De Wagter, Van Duyse and De Neve 5 or through the VMAT technique interplaying the multileaf collimator (MLC) field, dose rate and gantry speed in a single or multiple arcs.Reference Otto 6 In prostate radiotherapy, the relatively new VMAT technique was proved to deliver comparable dose coverage at the planning target volume (PTV) with similar organs-at-risk (OARs) sparing compared with IMRT.Reference Rana 7 – Reference Sale and Moloney 9 In addition, generally VMAT consumes less monitor unit per treatment and hence requires less treatment time.Reference Palma, Vollans and James 10 , Reference Hardcastle, Tome, Foo, Hiller, Carolan and Metcalfe 11 This results in an enhancement of patient throughput and a reduction of the MLC loading. However, VMAT is a more complex delivery technique involving the rotation of gantry and variation of dose rate. A more complicated monitor unit calculation and patient-specific quality assurance are therefore needed compared with IMRT.Reference Nelms, Opp and Robinson 12 , Reference Elith, Dempsey, Cao, Farshadi and Warren-Forward 13
In quality assurance of the prostate treatment plan, evaluating the PTV dose coverage is important. It is because nowadays prescription dose to the prostate in radiotherapy is getting higher and higher,Reference Martin and D’Amico 14 , Reference Greene, Mayadev and Valicenti 15 taking advantage of a very deep dose gradient achievable around the target using the IMRT or VMAT technique. Such deep dose gradients from the prostate can spare OARs such as bladder and rectum. Some dose–volume parameters such as D 99%, D mean, conformity index (CI), homogeneity index (HI) and gradient index (GI) are defined, and help to justify the merit of PTV dose coverage.Reference Isa, Rehman, Afzal and Chow 16 These parameters have their specific dosimetric meanings regarding their corresponding characteristics at the target dose coverage. For example, D 99% determines the dose in the PTV dose–volume histogram (DVH) with 99% of volume, whereas CI is the volume of target receiving >98% of the prescribed dose divided by the PTV. It is seen that the evaluation of target dose coverage is a process to justify a group of dose–volume points and parameters. In addition, radiobiological parameter such as prostate tumour control probability (TCP) should be considered in the plan evaluation. In general, the more the plan evaluation parameters with various dimensions of diversity are considered, the more accurate and thorough is the evaluation result.
Recently, big data in radiation treatment planning becomes a timely and hot topic.Reference Rosenstein, Capala and Efstathiou 17 , Reference Chow 18 Solution in big data storage is desirable because more and more complex treatment plans are generated in pace with the advancement of dose delivery technology. Our suggested Gaussian error function (GEF) model can simplify the cumulative DVH curves of target and OARs in simple mathematical parameters that greatly save the storage space of treatment plans.Reference Chow, Markel and Jiang 19 – Reference Chow, Markel and Jiang 21 Our PTV dose–volume factor (PDVF), calculated as per the GEF parameter, reflects the phenomenal characterisation of the PTV DVH curve, and was proposed to evaluate the PTV dose coverage in the prostate treatment plan.Reference Chow, Jiang and Daniel 22 In this study, the PDVF were calculated for 90 prostate patients (40 IMRT and 50 VMAT). Through comparison with other dose–volume and radiobiological parameters, the validity of PDVF was justified by comparing the prostate IMRT and VMAT plans.
Materials and Methods
Patient and treatment planning
In this study, 40 prostate IMRT and 50 prostate VMAT patients were selected in the Grand River Hospital, Canada. The information of maximum volume (V max), minimum volume (V min), mean volume (V mean), median volume (V median) and standard deviation for the target and OARs (rectum, bladder, left femur and right femur) of the prostate IMRT and VMAT patients are shown in Table 1. The prostate IMRT and VMAT plans were created using the PinnacleReference Sanghani and Mignano 3 (version 7.4, Philips Medical System, Andover, MA, USA) or Eclipse treatment planning system (version 8.5, Varian Medical System, Palo Alto, CA, USA) under the same dose prescription (78 Gy/39 fractions) and dose–volume criteria (Table 2) in the inverse planning optimisation.Reference Chow and Jiang 23 The seven-beam technique was used in the prostate IMRT plans with the 6 MV photon beams at the 40, 80, 110, 250, 280, 310 and 355° beam angles, whereas the single-photon arc technique was used for the VMAT plans.Reference Chow and Jiang 24 The 6 MV photon beams were produced by a Varian 21 EX linear accelerator equipped with a 120-leaf MLC (Varian Medical System). Dosimetry of all treatment plans were verified using the MapCHECK® or ArcCHECK® patient-specific QA system (Sun Nuclear, Melbourne, FL, USA).Reference Li, Zhang and Jiang 25 For all IMRT and VMAT plans, the PTV DVHs were determined to calculate the dose–volume points (D 5%, D 95%, D 99% and D mean), radiobiological parameter (prostate TCP) and PDVF for comparison.
Table 1 Information of the V max, V min, V mean, V median and standard deviation for the planning target volume (PTV), rectum, bladder, left and right femur of the intensity-modulated radiotherapy (IMRT) and volumetric-modulated arc therapy (VMAT) prostate patients

Table 2 Dose–volume criteria for the volumes of interest in the intensity-modulated radiotherapy and volumetric-modulated arc therapy inverse planning optimisation

Abbreviation: CTV, clinical target volume; PTV, planning target volume.
Calculations of the CI, HI and GI
The CI is defined as the volume of the target receiving >98% of the prescribed dose divided by the PTV,Reference Feuvret, Noel, Mazeron and Bey 26 and has an optimal value of 1. The HI is defined by the following equation:Reference Kataria, Sharma, Subramani, Karrthick and Bisht 27
 $${\rm HI}{\equals}{{D_{{{\rm 5\,\%\,}}} {\minus}D_{{{\rm 95\,\%\,}}} } \over {D_{{{\rm mean}}} }},$$
where D 5% is the dose received by 5% of the PTV, D 95% the dose received by 95% of the PTV and D mean the mean dose. In Equation (1), the optimal value of HI is equal to 0 (i.e., D 5%=D 95%). The GI is defined as:Reference Sheth, Sim and Cheng 28
 $${\rm GI}{\equals}{{V_{{50\,\%\,}} } \over {V_{{100\,\%\,}} }},$$
where V 50% and V 100% are the volumes covered by at least 50 and 100% of the prescribed dose, respectively. A GI value closer to 1 embodies a faster dose fall-off in normal tissue, which may indicate a lower dose to the critical structure.
Calculation of the prostate TCP
The prostate TCP is determined using the following equation:
 $${\rm TCP}{\equals}{{\exp (p{\plus}qD)} \over {1{\plus}\exp (p{\plus}qD)}},$$
where p and q are related to the D 50 and the normalised slope at the point of 20% control probability, γ 50, and D is the dose. Information of D 50 and γ 50 can be found from Okunieff et al.Reference Okunieff, Morgan, Niemierko and Suit 29 summarised related clinical data for various tumours and reported parameters. The control probability for the tumourlet, TCP (v i , D i ) with volume v i and dose D i , can be inferred from the TCP in Equation (3) for the whole volume using the following equation:
 $${\rm TCP}\left( {v_{i} ,D_{i} } \right){\equals}{\rm TCP}(D_{i} )^{{v_{i} }} .$$
In Equation (4) (v i , D i ) represents the differential DVH. In this study, the cumulative DVH acquired from the prostate treatment plan was converted to the differential one using our home-made computer routine on the MATLAB platform.Reference Chow and Jiang 24
Calculation of the PDVF
All PTV DVHs for the prostate IMRT and VMAT plans were modelled using the GEF in this study. The GEF can be written as:Reference Chow, Markel and Jiang 19 – Reference Chow, Markel and Jiang 21
 $$\eqalignno{ {\rm DVH}(V){\equals}a_{1} erf\left[ {b & _{1} {\times}\left( {D{\minus}c_{1} } \right)} \right]\cr\quad{\plus}a_{2} \,erfc\left[ {b_{2} {\times}\left( {D{\minus}c_{2} } \right)} \right],$$
where erf and erfc are the Gaussian error and complementary error function, respectively. a 1, b 1 and c 1 are parameters in the erf and a 2, b 2 and c 2 are parameters in the erfc. D and V are the dose and volume of the PTV, respectively. In Equation (5), it is found that parameters a 1 and a 2 are related to the maximum relative volume of the cumulative DVH curve in the modelling, whereas b 1 and b 2 are related to the slope of the DVH curve after the curve drop-off. Parameters c 1 and c 2, however, are related to the variation of DVH drop-off position where the normalised volume is close to 1. It is found that c 1 is related to the shape of the curved edge at the turning point in the DVH. Results of the average parameters (a 1,2, b 1,2 and c 1,2) in Equation (5) for the prostate IMRT and VMAT plans are shown in Table 3.
Table 3 Average dose–volume histogram curve fitting parameters for the intensity-modulated radiotherapy (IMRT) and volumetric-modulated arc therapy (VMAT) plans using the Gaussian error function model

The PDVF is therefore defined as:Reference Chow, Jiang and Daniel 22
 $${\rm PDVF}{\equals}1\left( {{{\left| {c_{1} {\minus}c_{0} } \right|} \over {c_{0} }}} \right),$$
where c o is the prescription dose of 78 Gy for the prostate IMRT and VMAT plans in this study. When 100% of prescribed dose covers 100% of target volume, the rectangular shaped PTV DVH results in c 1 equal to the prescription dose. Therefore, PDVF=1 reflects an ideal PTV dose coverage in Equation (6). However, due to OAR sparing, shape of the external contour and tissue heterogeneity, the realistic value of PDVF should be slightly lower than the optimal value of 1.
Results and Discussion
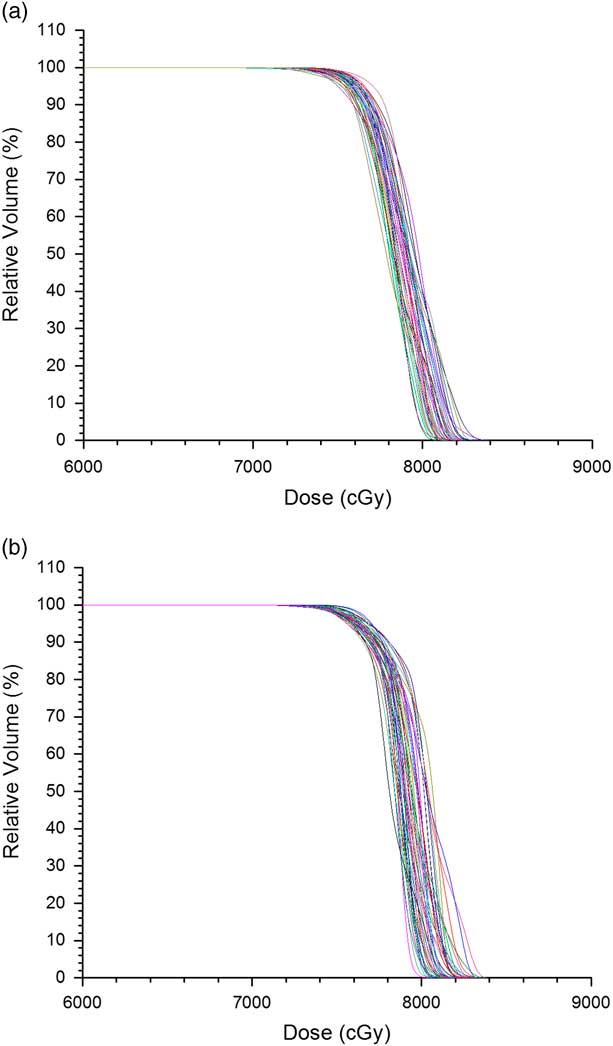
Figures 1a and 1b show the PTV DVHs of all prostate IMRT and VMAT plans, respectively. The dose in the x-axis of Figure 1 starts from 60 Gy instead of 0 to zoom out the drop-off portions of the DVH curves. Relative volume is shown in the y-axis for convenience to determine the dose–volume points. The average D 5%, D 95% and D 99% were determined from Figure 1 for the prostate IMRT and VMAT plans, and shown in Table 4. In addition, the mean doses, D mean of PTV for the IMRT and VMAT plans were determined. It is seen that the prostate VMAT plans have slightly higher D 5%, D 95%, D 99% (81·5, 76·3 and 74·5 Gy) than IMRT plans (D 5%=81·3 Gy, D 95%=75·6 Gy, D 99%=74·1 Gy). Although both the IMRT and VMAT plans satisfied the dose–volume criteria of D 99%≥74·1 Gy in Table 2, the VMAT plans have slightly higher average D 99% than IMRT. The degree of curve drop-off can be determined by evaluating the difference between D 5% and D 95%, showing the slope of the drop-off portion in the DVH curve. In optimal case, D 95%=D 5% shows a vertical drop-off of the DVH curve [i.e., HI=0 according to Equation (1)]. From Table 4, the average D 5%−D 95% for the prostate IMRT and VMAT plans are 7·2 and 5·2 Gy, respectively. This shows that the dose coverage of PTV for the prostate VMAT plans is slightly better than IMRT by considering the dose–volume points.

Figure 1 Dose–volume histograms of planning target volume for all (a) intensity-modulated radiotherapy and (b) volumetric-modulated arc therapy prostate plans.
Table 4 Average dosimetric and radiobiological parameters for the intensity-modulated radiotherapy (IMRT) and volumetric-modulated arc therapy (VMAT) prostate plans

Abbreviations: PDVF, planning target volume dose–volume factor; TCP, tumour control probability.
For the dosimetric indices in Table 4, the prostate IMRT plans have a lower average CI of 0·89 compared with VMAT (0·94). This shows that the VMAT plans produced better dose conformity to the PTV. For dose homogeneity, the average HI of prostate VMAT plans is 0·09, which is closer to 0 than that of the IMRT plans (HI=0·12). The average GI of the IMRT plans is 1·5, which is higher than 1·2 for the VMAT plans. From the results of HI and GI comparisons, it is seen that the VMAT technique can provide better dose homogeneity and faster dose fall-off to the OAR at the PTV.
The prostate VMAT plans have a higher average PDVF (0·983) than IMRT (0·970) with 1 as the optimal value. This again shows that the VMAT plans have slightly better dose distribution (closer to the ideal case of a PTV DVH) at the PTV than the IMRT plans. Results of PDVF agree well with the dose–volume points and dosimetric indices. To determine the radiobiological effect, the average prostate TCP for the IMRT and VMAT plans were calculated as 0·956 and 0·958, respectively. Although the average prostate TCP of the VMAT plans is higher than the IMRT, the increase of TCP is only 0·2% regarding the slightly better PTV dose coverage in the VMAT plans. As acquisition of the PDVF only involves the parameter c 1 in the GEF model based on the cumulative DVH, calculation process is more efficient and simpler than other plan evaluation parameters, which require the whole set of dose–volume data and transformation of the cumulative DVH to differential. Moreover, dose–volume data can be stored in a much smaller space through the application of the GEF model.Reference Chow 18
Conclusions
Dose coverage of the PTV in prostate radiotherapy was evaluated between the IMRT and VMAT techniques using dose–volume points, dosimetric indices, radiobiological parameter and PDVF based on the GEF model. From 90 prostate treatment plans, it is found that though the prostate VMAT plans have slightly better results on the dose–volume points, dosimetric indices and PDVF, the improvement of prostate TCP (0·2%) is not very significant. It is concluded that both the IMRT and VMAT technique can produce the required PTV dose coverage with the latter performing slightly better. The newly proposed PDVF were calculated from the IMRT and VMAT plans and agreed well with other plan evaluation parameters. As PDVF does not need the whole set of dose–volume data and DVH transformation in the calculation, it provides a more efficient alternative in the quality assurance of treatment planning.
Acknowledgements
All patient and treatment planning data were provided by the Grand River Regional Cancer Center in the Grand River Hospital, Kitchener, Canada. The dosimetric indices were calculated by Dr Isa Khan from the Women University of AJ&K Bagh, Pakistan.