INTRODUCTION
People save from various motives. Facing hump-shaped age-earnings profiles and retirement from work later in life, they save in order to smooth consumption over time (the life-cycle motive of savings). In the environment where future earnings are uncertain and insurance markets are incomplete, they accumulate wealth in order to self-insure against such uncertainty (the precautionary motive of savings). Furthermore, individuals save in order to leave bequests to their children because of the utility from such behaviors (the altruistic motive of savings). Due to uncertain lifetime and the incompleteness of annuity markets, portions of wealth intended for their own consumption are left as bequests (accidental bequests).1
Intergenerational transfers might be caused by different motivations. For example, Kotlikoff and Spivak (1981) assume that parents transfer resources to children in return for old age support. This type of transfer motive is not considered in the paper.
Savings thus motivated determine individual wealth accumulation over lifetime, the distributions of wealth and consumption across heterogeneous people, and aggregate capital accumulation. How important are the above savings motives to people of different characteristics, and how do they influence the distributions and the aggregate wealth?
The question is important by itself, but it is even more so because of policy implications associated with it. Effects of policies that redistribute resources among people of different characteristics, such as public transfer programs, public health insurance, and social security, are critically dependent on the relative importance of different savings motives. For example, if savings of young individuals are largely motivated by precautions rather than by life-cycle concerns, policies that deliver income insurance would decrease their savings. As a result, wealth inequality between young and old generations might increase and total capital accumulation would decrease. Alternatively, if the life-cycle motive is strong among them, wealth inequality and capital accumulation would be insensitive to such policies.
Many empirical studies have tackled a part of the question, the relative importance of different savings motives in aggregate wealth accumulation, by disentangling wealth accumulated for the purpose of intergenerational transfers from wealth generated from the life-cycle motive. These studies can be divided into two groups, those that follow an accounting approach and those that employ a direct questionnaire approach. The accounting-based approach estimates wealth accumulated from life-cycle concerns as the accumulated net surplus of earnings over consumption (and the rest is wealth for transfers). In this branch of literature, there are papers by Kotlikoff and Summers (1981), Ando and Kennickell (1987), Kotlikoff (1988), and Modigliani (1988). The direct approach uses surveys asking people what shares of their wealth are held for the purpose of intergenerational transfers [Modigliani (1988) and Hurd and Mundaca (1989)].
Although these studies provide valuable information for resolving the question, there exist caveats associated with them. First, the estimates do not separate wealth accumulated from different motives at a fundamental level. The calculation of life-cycle wealth does not distinguish the precautionary motive from the pure life-cycle motive. Estimated transferred wealth of the accounting-based approach includes both accidental and altruistically motivated transfers, whereas, in the direct approach, accidental transfers are included in life-cycle wealth. Second, different types of savings do interact; hence it is very difficult to isolate each motive as the above empirical studies have attempted [Kessler and Masson (1989)]. Receiving a bequest increases resources available for consumption as well as for transfers and thus affects life-cycle savings. However, the definition of the life-cycle wealth of the accounting-based approach implicitly assumes that such bequest is not used for consumption, as long as the life-cycle wealth is nonnegative, overestimating wealth accumulated for transfers. The deceased would obtain some utility from leaving their children wealth not accumulated for altruistic concerns; hence, reasonable estimates of altruistically motivated transfers may not be obtained based on the direct questionnaire approach. Finally, these estimates are not useful in examining the relative importance of different savings motives after some policies are altered. For example, the relative importance of intergenerational transfers in wealth accumulation will be affected by policy changes such as increased social security benefits that reduce life-cycle savings.2
There are other problems with the empirical studies. As for the accounting-based approach, the estimates are sensitive to a variety of assumptions concerning the age of family formation, the age of retirement, and the age of death; the shape and stability over time of age-earnings and age-consumption profiles, and of relative wages; and the definition of durable goods as consumption or investment (Blinder, 1988). The direct questionnaire approach, on the other hand, relies on potentially highly inaccurate information from respondents.
Recognizing the limitations of the existing empirical studies, we take a complementary simulation-based approach in tackling the question. Numerical simulations are based on a realistic overlapping generations model with intra-generational heterogeneity. In the model, an individual is born into a parent with certain levels of assets and earnings. During childhood, the individual does not make any choices and just inherits and acquires ability. Once he becomes an adult, he starts working and then has a child. He receives labor and capital incomes and allocates them to current consumption and savings. The individual's earnings depend on his ability determined before entering the labor market, his age, and a stochastic shock. Accumulated wealth comes from cumulative savings and a bequest received from his parent. After a particular age, he retires and starts to face a probability of death, and once he dies he leaves wealth to his child as a bequest, from which he derives utility.3
That is, altruism is of an “impure” (a “warm glow”) type as in the models by Yaari (1965) and Blinder (1973). Pure altruism, where an individual cares about the utility of his child [as in Barro (1974) and Becker (1974)], is not assumed in the paper. Pure altruism brings strategic interactions across generations in a realistic overlapping generations model as the one in the present paper, and would lead to multiple competitive equilibria as well as significantly increase computational burdens. See note 7, too.
The parameters of the baseline economy are chosen so that the evolution of individual earnings over time, the intergenerational correlation of earnings, and the distributions of earnings and wealth of the simulated economy match those observed for the U.S. economy reasonably well. The model succeeds not only in matching the overall distributions of earnings and wealth but also in reproducing the distributions for subgroups of the population.
Then, the allocation of the baseline economy is compared with those of three hypothetical economies: one with a complete annuity market, one without labor earnings uncertainty, and one without altruism. In this way, effects of various savings motives on distributions of wealth and consumption and aggregate wealth accumulation are indirectly investigated. The reason for the indirect examination is, as noted earlier, it would be infeasible to isolate the effect of each of the motives in any model or data set because of interactions among different motives.
Existing related simulation-based studies include Masson (1986), Caballero (1991), and Lord and Rangazas (1991). They employ partial-equilibrium OLG models without intragenerational heterogeneity and focus on effects of subsets of the above-mentioned savings motives on aggregate capital accumulation. More recently, Hendricks (2002) examines the quantitative importance of accidental versus intended bequests using a dynamic general equilibrium model and claims that accidental bequests explain at least half of bequests in the U.S. economy.4
Hendricks calibrates the model without any altruism to the U.S. economy and obtains the finding. He also considers the model where a portion of individuals do not have any altruism and the rest have perfect altruism. (See note 7 for a brief account of the model with perfect altruism.) Whether an individual becomes altruistic or not is determined stochastically and independently of his parent's type. By comparing the average amount of bequests of altruistic individuals with that of non-altruistic individuals, he concludes that 47 % of bequests are accidental while the rest are intended.
Although not the main objective of the paper, Nishiyama (2002) (see note 7 for a brief description of the model) examines effects of introducing complete annuity markets to his baseline economy on variables such as aggregate capital and the distribution of wealth.
This work is also closely related to the research that searches for models that can quantitatively reproduce actual wealth distributions, such as Huggett (1996), Quadrini and Rios-Rull (1997), Gokhale et al. (2001), Laitner (2001), Nishiyama (2002), Castaneda, Diaz-Gimenez, and Rios-Rull (2003), and De Nardi (2004). In terms of the model structure, most closely related is De Nardi (2004), which also employs a general equilibrium OLG model with “impure” (“warm glow”) altruism and examines the importance of various forms of intergenerational links, that is, accidental bequests, altruism, and intergenerational correlations of earnings, in generating a realistic wealth distribution. She finds that the model with “impure” altruism can generate a large concentration of wealth in the very rich observed in data, whereas the one without altruism cannot.
Furthermore, this paper is somewhat related to the research on consumption and savings behaviors that use numerical methods, which includes Deaton (1991, 1992), Hubbard, Skinner, and Zeldes (1994, 1995), Carroll (1997), Gourinchas and Parker (2002), and Cagetti (2003).
The paper is organized as follows. The baseline model, which is supposed to reflect the actual U.S. economy, is described in Section 2, and the competitive equilibrium for this economy is defined in Section 3. Section 4 presents two hypothetical economies where complete insurance markets for lifetime uncertainty are available and earnings uncertainty is nonexistent, respectively. Section 5 describes detailed procedures to calibrate the baseline model to the U.S. economy, and Section 6 presents and explains results of numerical simulations. Section 7 concludes the paper.
ECONOMIC ENVIRONMENT
In this section, the baseline model that is calibrated to the U.S. economy in numerical examinations is presented. The underlying economic environment is a discrete-time overlapping generations world. In this economy, an individual's life is divided into three parts, childhood, adulthood before retirement, and adulthood after retirement.
During childhood an individual makes no economic decisions, hence age is counted only for adulthood in the model. It is assumed that 1 period corresponds to 5 years and an individual lives up to 12 periods. This period setting is made for easing computational burdens.
An adult before retirement, who is between age 0 (age 25–29 in real life) and age 6 (age 55–59 in real life), is called a young adult. A young adult receives labor and capital incomes, a lump-sum transfer from the government, and a bequest on his parent's death, if any, and makes decisions on consumption and assets holdings for the next period. He has a child at age 1 (age 30–34). His parent, who is 6 periods older than him, leaves him assets at death as a bequest, because of the joy of giving and uncertain lifetime. He supplies a fixed amount of time (normalized to 1) for work each period. Earnings depend on his ability settled before becoming an adult, his age (work experience), and a stochastic shock, which reflects all the stochastic changes in earnings during the working period. During this period, the agent faces two types of risks, labor earnings uncertainty and uncertainty about his parent's living status.
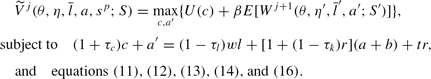
When turning age 7 (age 60–64 in real life), he retires and starts to face a positive probability of death for each year (including age 7) of his remaining life. An adult after retirement is called an old adult. He receives capital income and social security benefits, and makes decisions on consumption and asset holding for the next period. His social security receipt depends on the average earnings during his working period, which is a good approximation of the current U.S. social security system. After age 11 (age 80–84 in real life) he dies for certain. Figure 1 presents the generational structure of the model. The following subsections describe the model in detail.

Generational structure.
Generational Structure
As explained earlier, an individual's adult life starts at age 0 and may last up to age 11. Since age 7, that is, after retirement, he faces a positive probability of death. His parent is 6 periods older and his child is 6 periods younger than him. In this setting, only two generations coexist as living adults within a lineage, which simplifies the analysis.6
If the generational structure allows for the coexistence of three generations as adults, different types of bequests (from a grandparent to a grandchild, or from a parent to a child and a grandparent) could arise and complicates the analysis considerably without changing the model's implications much.
Consumer's Maximization Problem
An individual derives utility from the flow of his consumption when alive and from a bequest transferred to his child on his death. Note that he cares about the bequest left to his child but not about his child's consumption. That is, he has “impure altruism.” As mentioned in the introduction, if the individual is assumed to care about the consumption of his child, and the both agents maximize their utilities as different economic units, strategic interactions across generations would arise in the model. This would increase the complexity of the analysis significantly, hence this simpler assumption is adopted.7
One of the models considered in Hendricks (2002) assumes perfect altruism. However, he imposes unrealistic assumptions on informational structures in order to avoid computational difficulties associated with strategic interactions between a parent and his child. That is, a parent is assumed not to know anything about his child's states and the child at the beginning of life learns exactly how much he will inherit from the parent and can borrow the present value of the future inheritance. Hence, if the child receives a large amount of bequest in future, he faces a very weak borrowing constraint and consequently accumulates little wealth. Laitner (2001) also constructs a dynamic general equilibrium model with perfect altruism. In his model, an individual does not face temporary earnings shocks, has access to actuarially fair annuities and life insurance (hence only intended bequests exist), and makes intervivos transfers to his child until the child's borrowing constraint is lifted and saves the remaining transfers for his bequest. This setting allows the model to be solved numerically. Nishiyama (2002) also considers a model with perfect altruism. The setting of the model is more realistic than the above two papers and hence strategic interactions arise between a parent and his children. The computational difficulty is resolved by assuming that an individual lives for four periods at most and his earnings ability is not correlated with that of his parent.
The expectation operator E0 is attached to the above expression to indicate that as of period zero there exist risks other than the one associated with uncertain lifetime (mentioned below). An individual survives until age j−1 with probability
. With probability pj−1, he survives the next period and obtains the utility from consumption cj. With probability 1−pj−1, he dies before becoming age j and obtains utility from leaving a bequest aj. After age 11, he dies with certainty and obtains utility from bequest a12.
Assume that functions U(·) and F(·) are strictly increasing and strictly concave. Further assume that limc→0U′(c)=∞ and limb→0F′(b)<κ<∞, where κ is a positive real number. The latter assumption is imposed in order to allow zero bequests for a portion of the population.
The individual chooses consumption and assets plans in order to maximize his expected utility subject to the following constraints:


where aj+1 represents the asset holding at age j+1 and bj is the bequest received from his parent at age j, if any. Furthermore, r, w, and lj are the interest rate, the wage rate per efficiency unit of labor, and the effective labor supply at age j, respectively. Finally, τc, τl, and τk are tax rates on consumption, labor income, and capital income, respectively; tr is a lump-sum transfer received during his working periods; and socj denotes his social security receipt at age j. He faces a borrowing constraint each period so that he has to keep nonnegative assets each period, which also implies that he cannot leave a negative bequest to his child.8
There is a large literature on endogenous borrowing constraints, but due to computational complication, the simpler exogenous constraint is assumed.
Because an individual may receive a bequest on his parent's death, he needs to form an expectation on his future bequest receipt to solve the maximization problem. Assume that he has full access to the necessary information to predict his future bequest accurately, that is, the information needed to solve the parent's maximization problem after retirement (death can occur only after retirement). In order to simplify numerical computations, it is further assumed that the young individual solves his decision problem after observing his parent's current decisions.
Earnings Process
The agent's effective labor supply lj depends on his inherited and acquired ability before becoming an adult (earnings ability), his age (work experience), and a stochastic shock (earnings shock). Assume the following functional form for the effective labor supply:

where θ is the earnings ability, ϕ(j) is an age-dependent deterministic component, and ηj is the earnings shock.
The earnings ability, θ, captures all abilities inherited or acquired before becoming an adult, which would depend on his innate ability, nurture, education, and family and environments he grew up in, although none of these dependencies are explicitly modeled. θ is time-invariant throughout an individual's life, but it is correlated with his parent's earnings ability and follows the following stochastic process:
where θp is the earnings ability of his parent and ε is a stochastic shock to the process, which follows an i.i.d. normal distribution.9
Because decisions on human capital investment are not explicitly modeled, this process captures all the sources of the intergenerational correlation of earnings including genetic transmission of ability and effects of market incompleteness on human capital investment.
The time-varying earnings shock, ηj, captures all the shocks to earnings after an individual starts working, which would include changes in his employment status, his job performance, health condition, the performance of the company he works for, and so on. The shock is assumed to follow the following AR(1) process in logs,
where ηj−1 is the earnings ability in the previous period (at age j−1) and υj is a stochastic shock to the process, which follows an i.i.d. normal distribution.
Recursive Formulation
The above maximization problem is reformulated in a recursive way so that decision problems and state variables at every stage of life are stated clearly. This recursive formulation is used for solving the model numerically.
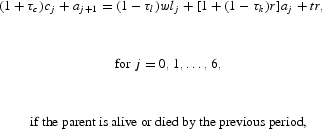
Young adult's Problem I (while his parent is alive).
A young adult, who is between age 0 and age 5 and has a living parent, earns labor and capital incomes, and may receive a bequest next period if his parent dies. His dynamic programming problem at age j (0≤j≤5) reads as follows,

In equation (9),
is his expected discounted welfare at age j;
and
are the next period's welfare when his parent is alive and dies, respectively; β is the discount factor on future utilities; pj+6 is the conditional probability that his age j + 6 parent survives the next period; and E is the expectation operator conditional on the information available in the current period. In the budget constraint (10), c is consumption, l is effective labor supply, a is assets (variables with superscript ‘′’ denote variables for the next period). The wage rate per effective labor supply is denoted by w and the interest rate is denoted by r. Tax rates on consumption, labor income, and capital income are expressed by τc, τl, and τk, respectively; and tr is a lump-sum transfer from the government. The effective labor supply l is dependent on the time-invariant earnings ability θ, the age-dependent deterministic component ϕ(j), and the stochastic component η, which follows an AR(1) process in logs [equations (11) and (13)]. The average effective labor supply up to this period,
, is a component of his state vector because the future social security benefit is dependent on it. A vector of state variables for his parent, sp, is needed to predict his bequest receipt (the exact component of the vector is explained later) and the transition function for this vector is denoted ϒ(·) [equation (15)]. Vector S represents the aggregate state of the world and
characterizes the evolution of the aggregate state [equation (16)].
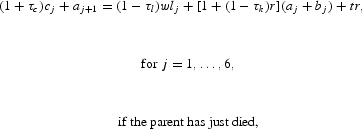
Young adult's Problem II (after his parent dies).
In the period his parent dies, the young adult at age j (1≤j≤5) receives a bequest and solves the following problem:
In this formulation,
is his welfare in the next period and b is the bequest received from his parent, which depends on his parent's state sp. Because the young adult is assumed to have enough information to know his parent's states after retirement, b coincides with the parent's optimal asset holding at age j+6 (determined at age j+5) when the parental state is sp.
From the next period on, the young adult solves the following problem:
Maximization problem at age 6.
In the next period (at age 7), he becomes a retiree, starts receiving a social security payment and facing a positive probability of death. By this age his parent is dead with certainty (see Figure 1), and now he has to care about the event of his child inheriting his assets.
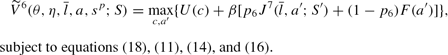
If his parent is dead before the previous period, he solves the following problem:

subject to equations (10), (11), (14), and (16), where p6 is the agent's conditional probability of surviving the next period,
is the welfare at age 7 if he is still alive, and F(a′) is the utility associated with leaving bequest a′ if he dies. Note that function J7 does not depend on θ and η anymore.
If his parent was alive in the previous period, he solves the problem below:
Old adult's problem.
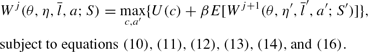
After retirement, the individual receives social security benefits, and faces a positive probability of death. An old adult at age j (7≤ j≤11) solves the following problem:

In the above formulation,
is the welfare in the next period when he is still alive and
denotes his social security receipt, which depends on his average earnings during his working life,
. Note that the individual dies before becoming age 12 with probability 1, so that p11=0.
From the formulation of the maximization problem, it is now clear that the vector of parental state variables needed for a child to predict the bequest from his parent is
where jp,
, and ap′ are the age, the lifetime average effective labor supply, and the next period's assets of his parent, respectively. The variable ap′ is the current state variable because the child makes decisions after observing his parent's decisions by assumption.
Final Goods Production
The firm hires capital and labor and solves the profit maximization problem,
where O(·) denotes the CRS final good production function, k and l denote aggregate capital and efficiency labor, respectively, and δ is the depreciation rate of physical capital. From the first-order conditions the real interest rate and the wage rate are expressed as functions of the capital-efficiency labor ratio.
Governmental Policies
The government taxes labor income, capital income, and consumption to finance the lump-sum transfer, social security, and the nontransfer policy, which is the consumption of the final good by the government and is assumed not to affect individuals' utilities. The government's budget constraint reads

where tr is the total lump-sum transfer, soc is the total social security payment, and cg is the consumption of the final good by the government.
RECURSIVE COMPETITIVE EQUILIBRIUM
The analyses in later sections focus on a stationary recursive competitive equilibrium in which decision problems are recursive, and the aggregate state of the world and governmental policies are time-invariant. The followings are definitions of a recursive competitive equilibrium and of a stationary recursive competitive equilibrium.
DEFINITION
A Recursive competitive equilibrium for the economy consists of
- value functions , and
- decision rules
- for a young adult with a living parent,
- for a young adult who has just lost his parent,
- for a young adult whose parent died by the previous period,
- for an old adult,
- price functions w and r,
- governmental policies τl, τk, τc, tr, , and cg,
- the law of motion for the parent's state of the world and
- the law of motion for the aggregate state of the world , Ψ, where SV is the joint distribution of and sp for young adults with alive parents; is that of the same variables for young adults who have just lost their parents; SW is the joint distribution of and a for young adults whose parents died by the previous period; and SJ is the joint distribution of and a for old adults, such that
- An age j (0≤j≤5) young adult with a living parent solves problem (9), with the maximized value function given by Vj and the decision rules by and ;
- An age j (1≤j≤6) young adult who have just lost his parent solves problem (17), with the maximized value function given by and the decision rules by and (when he is age 6, he solves problem 20);
- An age j (2≤j≤6) young adult whose parent died by the previous period solves problem (22), with the maximized value function given by Wjand the decision rules by and (when he is age 6, he solves problem 20);
- An age j (7≤j≤11) old adult solves problem (17), with the maximized value function given by Jj and the decision rules by and ;
- The law of motion for the parent's state of the world , is composed of the following set of equations:
A young adult's prediction of the future bequest in state sp is also determined by (27);

- The firm solves problem (24), with the first-order conditions given by r=O1(k, l)−δ and w=O2(k, l), where k and l are equal to
- The government's budget constraint is satisfied, i.e.
- The law of motion of the aggregate state of the world is consistent with the individual decisions, the firm's choices, and the governmental policies, and evolves according to


DEFINITION
A stationary recursive competitive equilibrium is a recursive competitive equilibrium in which
and the governmental policies are time-invariant.
COMPLETING MARKETS
In the baseline economy described earlier, an individual self-insures against earnings and lifetime uncertainties by accumulating wealth for a precautionary reason. When there are markets to insure against these risks, precautionary savings and accidental bequests disappear. In order to examine changes in the distribution of wealth and aggregate capital accumulation in the presence of such insurance markets, two hypothetical economies, the one with complete annuity markets, and the one without earnings uncertainty, are constructed in this section.
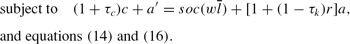
Economy with Complete Annuity Markets
Suppose that there are complete annuity markets so that an individual can insure against his uncertain time of death. Let
units of consumption of the next period be the gross return of one unit of the annuity security if the individual survives and nothing otherwise.10
In this way, the relative price of this security in terms of consumption is 1. Clearly, there are other equivalent ways to set up this market where the relative price is not one.
Then the budget constraints of an individual over age 6 become

The return of the annuity is higher than normal assets due to pj−1<1. Hence, in the absence of altruism, the individual will hold all of his assets in the annuitized form.
Economy with No Earnings Uncertainty
In addition to annuity markets being incomplete, the baseline model also has assumed the absence of markets in which consumers can purchase insurance against earnings uncertainty. In order to set up complete insurance markets for the earnings uncertainty, one could introduce contingent claims. However, because of computational difficulties we take a shortcut by considering the model economy where the earnings shock η always takes a common value. The constant value of η is set so that the aggregate efficiency labor of this economy is at the same level as in the original economy.11
Recall that the complete market economy will not be Pareto optimum because of distortionary taxation and the existence of the borrowing constraint. Therefore, solving the planner's problem will not deliver the market allocation.
CALIBRATION
In this section, the model's functional forms are specified and parameter values are set for numerical simulations. The parameters are set based on existing empirical works, if available. Otherwise, they are set so that the simulated economy produces statistics that resemble those of the U.S. economy when policy parameters are set based on actual policies.
Final Good Production and Preferences
Final good production function: The function is assumed to be of the standard Cobb-Douglas type:
The parameter α is set to 0.36, following most works in quantitative macroeconomics.
Depreciation rate for physical capital δ: The annual rate of depreciation is usually set between 0.08 and 0.10 in the quantitative business cycle literature. Choosing the midpoint of these estimates and noting that each period in the model corresponds to 5 years in real life, the depreciation rate for numerical simulations is set to be 1−(0.91)5.
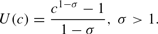
Utility functions: The utility function for final good consumption is assumed to be of the CRRA variety:
The bequest utility function is given by
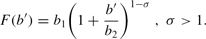
The presence of 1 in this expression permits some individuals to leave no bequests.
Preference parameters σ, b1 and b2, and the discount factor on future utilities β are set so that the simulated model economy delivers a good overall match of the U.S. wealth distribution. The parameter values chosen for simulations are presented in the next section, when simulation results of the baseline model are discussed.
Earnings Process
Remember that the effective labor supply of an individual at age j is given by the following function,

where θ is the earnings ability (time-invariant), ϕ(j) is the deterministic component at age j, and η is the time-variant stochastic component (earnings shock). The earnings shock η follows

The earnings ability θ is correlated across generations in the following manner,

where θp is the earnings ability of his parent.
The age-dependent deterministic component ϕ(j) is specified based on the empirical estimates by French (2000). He uses the PSID and the PSID validation study for the years 1978–1987 to estimate the stochastic process of labor earnings. His estimate of the deterministic component is

The AR processes for the innate ability and for the earnings ability are discretized based on the Tauchen (1986)'s procedure. The parameters ρ,
, ζ and
are difficult to set based on the existing empirical work; hence, they are pinned down so that the simulated model produces the distribution of earnings and intergenerational correlations of earnings close enough to the corresponding statistics of the U.S. economy. The chosen parameter values are presented in the next section.
Survival Probabilities
The survival probabilities are based on the 1997 U.S. life table for the total population in Anderson (1999). Because an individual lives until turning age 7 (age 60–64 in real life) with certainty and dies with probability 1 after age 11 (age 80–84 in real life) in the model, the conditional survival probabilities are adjusted accordingly.
Governmental Policies
Recall that the government collects its revenue by levying taxes on labor income, capital income, and consumption. The tax revenues are then used to finance lump-sum transfer, the social security system, and the nontransfer policy, which is the governmental consumption of the final good and is assumed not to affect individuals' utilities. The government's budget constraint reads

where tr is the total lump-sum transfer, soc is the total social security payment, cg is the spending on the nontransfer policy, and τc, τl, and τk are tax rates on consumption, labor income, and capital income.
Social Security System: The social security payment is based on average life-time labor earnings
. Therefore, agents with different earnings histories receive different amounts of social security benefits. Assume that the social security benefit of an old adult is determined by the following function:
The parameter ς is set to be 0.4. Then a retired worker gets 40% of the average of his lifetime labor earnings, which is close to the value (42%) people with average earnings would receive in the U.S. economy, according to the information of the Social Security Administration. However, the actual social security system is progressive, so that people with higher earnings receive less than proportionally. In order to take into account this feature of the actual system, the computed average lifetime effective labor supply
is adjusted accordingly.12
In particular,
is adjusted so that workers in particular positions of the earnings distribution receive the same proportions of their average lifetime earnings as they would when they retire before age 62 in the U.S. economy. The targeted workers are those who receive earnings at the national average level, 45% of the average earnings, and 160% of the average earnings steadily throughout their lives. These particular workers are chosen as their benefits examples are found in a document of the social security administration. The referred U.S. replacement ratios are the averages of the ratios for the years 1990–1999.
Tax rates: The tax rates on labor income τl, capital income τk, and consumption τc are set to be equal to 0.2887, 0.398, and 0.0523, respectively, following Mendoza, Razin, and Tesar (1994), who computed effective tax rates on factor incomes and consumption using national accounts and revenue statistics. The values are the averages of their estimates for the years 1980–1999.
Lump-sum transfer: The value of the lump-sum transfer to the working population tr is chosen so that the ratio of the transfer to GDP in the baseline economy becomes 0.031, which is the average of the ratios in the U.S. economy for the years 1980–1999. The U.S. transfers used to compute the ratios are sums of all the non-educational governmental transfers excluding social security, Medicare, and retirement benefits.
RESULTS
Baseline Model
In this subsection, the calibration procedures for the unset parameters of the earnings process and preferences are explained and the chosen parameter values are presented. Then simulation results of the baseline economy are presented and compared with the data of the U.S. economy.
Earnings distribution.
The parameters of the earnings process are chosen so that the distribution of earnings and the evolution of earnings across time and generations are reasonably close to those observed for the U.S. economy. In particular, attention is paid to the following statistics: (i) the “static” earnings distribution—the Gini coefficient, the proportion of the population without earnings, shares of earnings held by particular percentiles, the ratio of earnings of the highest 1% to the lowest 40% of the distribution,13
This is the ratio of average earnings that an individual in the highest 1% of the distribution would receive to average earnings that an individual in the lowest 40% would.
Remember that 1 period in the model corresponds to 5 years.
Actually, the Gini for people without college education is not available in the data. However, the Ginis for those with high school education and without high school education are available, the numbers being 0.554 and 0.733, respectively.

Table 2 presents the statistics of the earnings distribution of the baseline economy and of the U.S. economy. The statistics of the static U.S. earnings distribution are from Diaz-Gimenez, Quadrini, and Rios-Rull (1997), who used the 1992 Survey of Consumer Finances (SCF) as the data source. The proportion of the U.S. population without earnings is computed as the sum of the proportions with zero and negative earnings in the data, which are 24% and 0.42%, respectively. The range of values of the intergenerational correlation of lifetime earnings is based on Mulligan (1997), Solon (1992), and Zimmerman (1992). College graduates in the model are defined as those who are in the top 27% of the distribution of earnings ability θ. This value is the observed percentage of college graduates in the data used in Diaz-Gimenez, Quadrini, and Rios-Rull (1997).
It should be stressed that, with these few parameters, the overall shape, the shape for each education group, and the transitions of the earnings distribution are matched satisfactorily. The match is not so successful for the extreme upper tail of the distribution and the proportion of the population without earnings. In the model, the upper tail has lower concentration than in the data, and the proportion of the population without earnings is higher than observed. In the model, everyone retires when turning age 7 (age 60–64 in real life), but many retire at older ages in the actual economy, which would be a reason for this result.16
Another possible reason for the discrepancy would be that the basic economic unit in the data is a household that includes a person or a couple who live together and all other financially dependent individuals who live in the same household. As a result, there are cases in which the head of the household is retired but other individuals in the same household are still in the labor force.

Wealth and bequests distributions.
The preference parameters β, σ, b1, and b2 are of fundamental importance in determining the shape of the simulated wealth (assets) distribution. They are set so that the simulated economy matches the U.S. wealth distribution in (i) its overall distribution—the Gini, the proportion of people without wealth, shares of wealth held by particular percentiles, the ratio of wealth of the highest 1% to the lowest 40% of the distribution, and the mean to median ratio; (ii) its distribution within the working and retired population—the Gini and the proportion of people without assets for each group; and (iii) the distributions among college and noncollege graduates—the Gini for each group. Table 3 shows the chosen parameter values.17
The value of b1 is negative so that the marginal utility from leaving a bequest becomes positive. (Note that σ is greater than one.)
Table 4-I presents the statistics of the wealth distributions of the baseline economy and of the U.S. economy. The statistics for the U.S. wealth distribution are from Diaz-Gimenez, Quadrini, and Rios-Rull (1997).18
The presented U.S. statistic for the proportion of the population without wealth is the sum of the proportions of individuals with zero wealth (3.4%) and of those with negative wealth (3.5%). The presented Gini for retirees in the U.S. economy is the Gini for individuals aged above 65. The Gini for those aged between 61 and 65 is 0.744. The corresponding U.S. statistic for the Gini for noncollege graduates is the Gini for high school graduates (0.734) and for those without high school education (0.752).


The simulated economy delivers a tight match to the U.S. wealth distribution. In particular, the Gini coefficient for the whole population, the shares of wealth held by the top 10, 20, and 40% of the distribution, and the Gini for noncollege graduates are almost identical to the corresponding values of the U.S. data. By contrast, the proportion of the whole population without wealth is much lower than the corresponding U.S. statistic. The discrepancy is not so serious as the number suggests, as about 24% of the population in the U.S. data hold “almost” zero wealth.19
To be more accurate, in the histogram of the wealth distribution presented in Diaz-Gimenez, Quadrini, and Rios-Rull (1997), about 24% of the sample belongs to the same interval as individuals without wealth.
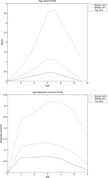
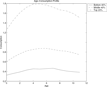
Figure 2 (top) displays the age-wealth profiles for average individuals in the top 20%, middle 40%, and bottom 40% of the earnings ability (θ) distribution.20
Wealth at each age is the average of wealth holdings at the beginning and at the end of the period.

Age-wealth (top) and age-bequests (bottom) profiles [baseline].
Individuals before middle age hold limited amounts of assets. However, they steadily increase wealth holdings over time primary because more of them receive bequests from their parents. This can been seen clearly from Figure 2 (bottom), which plots age against average inherited bequests.21
The averages are taken for all individuals in a cohort including those whose parents do not die at that age.
The values of discount factor β in Table 3 and the after-tax interest rate in Table 6 suggest that individuals are impatient in the sense that the optimal consumption profile under certainty is downward sloping, although the degree of impatience is weak:
under certainty.
According to the data used in Diaz-Gimenez, Quadrini, and Rios-Rull (1997), the average wealth held by a household is at the peak when the head of a household is between age 56 and age 60.
The percentage of the population without bequests seems reasonable. McGarry (1999) finds that the average reported probability of leaving inheritance greater than $10,000 is 0.55 among respondents with at least one noncoresident adult child in the Assets and Health Dynamics Study (AHEAD) surveyed in 1992 and 1993.
Consumption distribution.
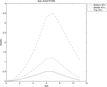
Table 5 shows the statistics for the consumption distribution. The consumption inequality is much lower than the earnings and wealth inequalities. The variance of log consumption for the whole population is equal to 0.464, which is close to the U.S. values (between 0.4 and 0.47) reported in Deaton and Paxon (1994), who used the 1980–1990 versions of the Consumer Expenditure Survey (CEX).
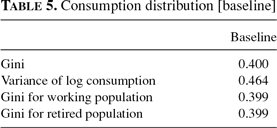
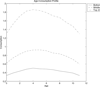
Figure 3 displays the age-consumption profiles. The profiles reproduce the empirically observed humped shape. When individuals are very young, their profiles are steep, reflecting earnings growth and the borrowing constraint, but gradually become flatter with the relaxation of the constraint through wealth accumulation. The peaks of their consumption levels are at age 4 (age 45–49 in real life) or age 5 (age 50–54) depending on the earnings abilities, which are earlier than the peaks of wealth accumulation. This matches the U.S. value (around age 50–55) reported in Cagetti (2003), who used the Consumer Expenditure Survey (CEX) for the years 1980–1995. After the peaks, consumption levels steadily decrease with age, reflecting impatience (a low value of the discount factor β) and a rising death probability.

Age-consumption profile [baseline].
Aggregate variables and prices.
Finally, Table 6 shows the statistics of the aggregate variables and the prices. {The U.S. ratio of the government revenues to GDP is computed from Tables 1.1 and 3.1 of National Income and Product Accounts Tables (as of May 21, 2001) by the Bureau of Economic Analysis, U.S. Department of Commerce,25
The number is the average of the current government revenues as percentage of GDP for the years 1980–1999.
The number is the sum of social security, Medicare, and other federal retirement and disability programs' expenses as a percentage of GDP for the years 1980–1999.
The higher value is the proportion of total intergenerational transfers in net worth and the lower value is the proportion after excluding college expenses by parents. Original values are adjusted for the model's assumption that 1 period corresponds to 5 years.

The aggregate variables and the prices get close to the data in like manner. The higher ratio of social security benefits to GDP may be explained by the higher proportion of retired people in the model economy because of the mandatory retirement at age 7 (age 60–64 in real life).
Complete Annuity Markets
Now the statistics of the baseline economy are contrasted with the hypothetical economies to see how market incompleteness and altruism affect the distributions of wealth and consumption, and overall capital accumulation. In this subsection, comparison is made with the economy in which annuity markets are completed.
Table 7-I presents the statistics for the wealth distribution of this economy in comparison to those of the baseline economy. The Gini coefficients for the whole population, for each age group, and for each education group all increase significantly. The hikes are caused by the concentration of wealth in very rich households, as can been seen from the massive increases in the share of wealth held by the top 1% of the distribution and the ratio of wealth held by the top 1% to that held by the bottom 40% of the distribution. In contrast, the proportions of people without wealth for the whole population and for each age group increase more modestly.28
Nishiyama (2002) also examines the effects of introducing complete annuity markets in a different setting. His finding is qualitatively similar but not quantitatively: the magnitude of the effects is much smaller. For example, the Gini of the distribution of wealth increases by mere 0.01.

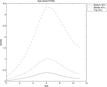
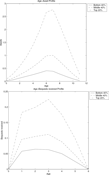
Figure 4 shows the age-wealth profiles for people who are in the top 20%, middle 40%, and bottom 40% of the earnings ability (θ) distribution. The profiles before retirement (age 7) have similar shapes to those of the baseline economy, although wealth accumulated before retirement is slightly lower than in the baseline economy. This suggests that, at this stage, savings are mostly motivated by precautionary concerns or preparation for income decrease after retirement. A notable difference is observed for the profiles after retirement; now they deplete their assets more slowly and therefore hold larger assets until their death. In the baseline economy, where there is no insurance for uncertain lifetime, people tend to spend their incomes for consumption while their death probabilities are relatively small, because they face the risk of leaving wealth not intended for their children at death. Now that they are insured against such events, they can smooth consumption after retirement. The age-consumption profiles (Figure 5) show clearly the effect of the presence of annuity markets on consumption smoothing after retirement. Demands for annuities are large indeed: the fraction of assets annuitized is almost close to 1 for those in the bottom 60% of the distribution of earnings ability (when they have positive wealth). By contrast, the fraction of annuitized assets is lower (about 0.74) for those in the top 10% of the distribution. As a result, the Gini coefficient of the bequests distribution is much higher than in the baseline economy (Table 7-II). This would be the main reason of the higher concentration of wealth in the rich population and the increase in no-wealth individuals observed in Table 7-I.

Age-wealth profile [complete annuity].

Age-consumption profile [complete annuity].
The availability of annuities affects consumption distribution through various channels. The higher wealth and bequests inequality tend to exacerbate consumption inequality, while the smoother after-retirement consumption path leads to an improved consumption distribution across age and the higher annuity demands by poor individuals tend to diminish inequality among different income groups. Table 7-III shows that the first effect dominates and consumption inequality goes up compared to the baseline economy.
Finally, Table 8 presents aggregate variables and prices. The equilibrium yearly before-tax interest rate increases to 5.45% from 4.95% of the baseline economy, which corresponds to a 7.9% decrease in aggregate capital.29
Nishiyama (2002) finds that the introduction of complete annuity markets increases the interest rate by 0.5% and reduces aggregate capital by 6.2%, similar to the present finding.

No Earnings Shock
In this experiment, earnings uncertainty is removed by assigning the same value of the earnings shock η to all the individuals. The value of the common η is set so that the aggregate efficiency labor in the economy is at the same level as in the baseline economy. This economy can be considered to approximate a hypothetical economy where complete insurance for earnings uncertainty is available.
As Table 9 shows, the earnings inequality decreases considerably compared with the baseline economy in almost all the dimensions; in particular, a drop of the Gini for log-lifetime earnings is worth mentioning. The exception is the earnings ratio of college graduates to the rest of the population, which is expected as the distribution of the earnings ability θ is kept constant.

This large decrease in earnings inequality translates into a large decline in wealth inequality, as can be seen in Table 10-I. However, the effect on the working population and on the retired population are different. The Gini for the working population decreases only slightly and the proportion of individuals without wealth in this group increases greatly, while both the Gini and the proportion of nonwealth individuals for the retired population decrease significantly. Removal of earnings uncertainty implies more equalized lifetime earnings, and thus less unequal life-cycle savings among middle age individuals in preparation for retirement, but it also leads to much smaller precautionary savings by young adults, which leads to the higher number of nonwealth young adults. The two opposing effects yield the smaller decline of the Gini for the working population. In contrast, for retirees, the equalized lifetime earnings distribution and the resulting more equal social security benefits both contribute to lower wealth inequality. The changes in the bequests distribution reflect those of the wealth distribution of retirees, as shown in Table 10-II. The age-wealth profiles (Figure 6) exhibit much lower wealth accumulation before middle age due to the much weaker precautionary savings motives. After around age 4 (age 45–49 in real life), the shapes of the profiles look very similar to the baseline economy, thus other savings motives seem to be dominant.


Age-wealth profile. [no earnings shock]
The consumption distribution improves greatly as well (Table 10-III). The equalized lifetime earnings and bequests tend to alleviate consumption inequality among people with different abilities or bequests receipts, while lower precautionary savings tend to ameliorate the consumption distribution between age groups. The shapes of the age-consumption profiles (Figure 7) show a noticeable difference in consumption behaviors after age 3, in particular for the rich. In the baseline economy, after the peaks around age 4 or 5, consumption steadily decreases with age. In contrast, in this economy, consumption is almost constant between age 3 and 7. Because of the disappearance of the earnings uncertainty, the consumption profiles become closer to the ones under certainty, which are almost flat when savings are positive (see also note 22).

Age-consumption profile. [no earnings shock]
Aggregate variables and prices are shown in Table 11. The yearly before-tax interest rate increases to 5.41%, which implies that aggregate capital decreases by 6.7% in comparison to the baseline economy. The effect of fully insuring earnings uncertainty on aggregate capital accumulation is a little weaker than the effect of fully insuring lifetime uncertainty. The differences of the effects are more striking in bequests, now aggregate bequests are almost the same as in the baseline economy. Whereas the lack of earnings uncertainty reduces precautionary savings greatly, the resulting decrease in the inequality of lifetime earnings makes it possible for more people to leave bequests. These two effects on aggregate bequests seem to cancel out each other.

No Altruism
Finally, the effect of altruism on savings and consumption decisions are investigated by simulating the hypothetical economy where people do not obtain utilities from leaving bequests. This case differs from the baseline economy only in the absence of the bequest utility function, F(b′). Accidental bequests are transferred to heirs as before.
Table 12-I shows the statistics for the wealth distribution of this economy in comparison to those for the baseline economy. Inequality declines in all the dimensions. In particular, concentration of wealth in the far right tail of the distribution and the inequality of wealth among the retired population decrease greatly, reflecting the disappearance of altruism. In contrast, improvement of the wealth distribution among the working population is more modest. In particular, the proportion of the working population without wealth is hardly affected.

Figure 8 (top) presents the age-wealth profiles for people who are in the top 20%, middle 40%, and bottom 40% of the earnings ability (θ) distribution. For those in the low- and middle-ability groups, the shapes of the profiles are very similar to those for the baseline economy, suggesting again that altruistically motivated savings have limited importance for them. But for those in the highest ability group, large differences are observed. First, the amount of assets accumulated at the peak (age 7) is much lower than that of the baseline economy. Furthermore, they deplete their wealth holdings much more rapidly after the peak, and at age 11 the differences in wealth holdings among different skill groups become very small. In this economy, people are concerned only about their own consumption. During periods when death probabilities are small, they keep large wealth for future consumption, but as the death probabilities increase with age, they decrease their assets holdings rapidly. This is the reason why the profile is much steeper for rich people after retirement, and wealth is much less concentrated in the rich.

Age-wealth (top) and age-bequests (bottom) profiles [no altruism].
Figure 8 (bottom) shows the age-bequests receipts profiles for young adults. Now all the bequests are accidental rather than altruistically motivated. The biggest difference from the baseline economy is the huge drop in the amount of bequests received after age 3. As they get older, death probabilities of their parents become higher, and as a result, the parents reduce their assets holdings, resulting in smaller bequests. At age 6 nobody receives any bequests because the parent is at age 11 and is going to die for certain. Table 12-II shows the distribution of bequests. The Gini coefficient is much lower than the baseline economy and the proportion of population without leaving bequests is a little lower.
The lower wealth inequality also translates into lower consumption inequality, as observed in Table 12-III, but the decrease is very small, especially for the working population and for the whole population. More equal bequests receipts tend to equalize the consumption distribution among the young, while the disappearance of altruism allows richer people to consumer more, and the result suggests that the two effects nearly cancel out each other. Figure 9 shows that the age-consumption profile for people with high earnings ability is much steeper after retirement compared to the baseline economy, reflecting the rapid depletion of wealth holdings seen in the age-wealth profile (Figure 8, top).

Age-consumption profile [no altruism].
Finally, Table 13 presents aggregate variables and prices. The equilibrium yearly before-tax interest rate increases to 6.48% from 4.95%, associated with a 20.4% decrease in aggregate capital. The disappearance of altruism in this economy also results in a 33.3% decrease in aggregate bequests.

Robustness
These results have been based on the calibration where the correlation coefficient of the AR(1) process for the earnings shock, ζ, is set 0.4 and the coefficient of relative risk aversion σ is 4.0. Although this calibration has produced good matches of the model economy to the U.S. economy, there are no U.S. statistics that directly pin down the values of these two parameters. Because they are crucial in determining the relative strength of the precautionary motive of savings, this section checks robustness of the results by choosing different values for the two parameters and recalibrating the model accordingly.
Comparisons of baseline economies under different parameterization.
The procedure of the recalibration is as follows. For parameter ζ, three different values 0.3, 0.4, and 0.5 are tried. Given ζ, the variance of the disturbance term to the earnings shock process,
, is adjusted so that the cross-sectional distribution of earnings remains unchanged. As for the coefficient of relative risk aversion σ, three values 3.0, 4.0, and 5.0 are tried. For a given value of σ, the parameters of the bequest function b1 and b2 are adjusted so that the baseline model under the new parameterization yields the same Gini coefficient for the wealth distribution of the whole population. Note that this does not mean that other dimensions of the wealth distribution remain unchanged with the new parameters. Table 14 shows the chosen values of the bequest parameters for 9 combinations of ζ and σ, including the original parameterization, ζ=0.4 and σ=4.0.

Table 15 presents selected statistics of the earnings distributions when the correlation coefficient of the earnings shock process, ζ, is set 0.3, 0.4, and 0.5. Because the unconditional distribution of the earnings shock is kept constant, the distributions of earnings for the whole population and for each skill group do not change. In contrast, the distribution of lifetime earnings becomes more unequal with larger ζ, since the earnings shock at age 0, which is drawn from the same unconditional distribution, becomes more crucial in determining the shocks at later ages. Obviously, the period-by-period correlation of log earnings rises and the intergenerational correlation of log-lifetime earnings falls with higher ζ.

Selected statistics of the distributions of wealth, bequests, and consumption for different values of ζ when σ=4.0 are summarized in Table 16. Similar qualitative results are found for σ=3.0 and 5.0 as well. Other things being equal, higher persistence of the earnings shocks (larger ζ) increases inequalities of lifetime earnings and, thus, life-cycle savings and decreases precautionary savings by the young, contributing to higher overall wealth inequality.30
Precautionary savings are relatively more important among the poor, who leave limited bequests and receive social security benefits more than proportional to earnings (see note 12). Thus, weaker precautionary motives raise wealth inequality between income groups as well as age groups.

Table 17 shows selected statistics of the distributions of wealth, bequests, and consumption for different values of σ when ζ is set 0.4. Qualitative results remain unchanged when ζ=0.3 and 0.5. Other things being equal, the higher value for the coefficient of relative risk aversion raises precautionary savings and thus reduces wealth inequality among the working population. The higher σ also implies a lower rate of intertemporal substitution and hence a flatter age-consumption profile, increasing life-cycle savings for post-retirement periods and savings for bequests.31
As explained in note 22, the optimal age-consumption profile under certainty is slightly downward sloping.

Robustness of results on distributions.
Changes in the distributions of wealth, bequests, and consumption in the three hypothetical economies in comparison to the baseline economy are qualitatively the same in almost all the dimensions under all the parameterization. Quantitatively, as detailed here, differences in the rates of change are observed.
Economy with complete annuity markets: In all the nine cases, almost all the measures of inequalities worsen compared to the baseline economy. When the coefficient of relative risk aversion σ is higher, rates of increase in wealth and bequests inequalities become smaller. By contrast, raising the correlation coefficient of the earnings shock process ζ has mostly ambiguous effects on rates of change of the distributional measures.
Economy without earnings uncertainty: In the economy without earnings uncertainty, the proportion of households without wealth goes up except for the retired population, and all the other inequality measures fall for all the parameter combinations. When σ is higher, rates of decrease of the inequality measures become smaller except proportions of individuals without wealth. In contrast, increasing ζ raises rates of decrease of the inequality measures aside from proportions of people without wealth (except for the retired population), whose rates of increase fall.
Economy without altruism: In all the cases, wealth and bequests inequalities decline compared to the baseline economy. In contrast, the effect on consumption inequality is ambiguous, declining when σ=3.0 and 4.0 but rising when σ=5.0, and the rates of change are very small. Rates of decrease of wealth and bequests inequalities are larger when the coefficient of relative risk aversion σ is higher, except for proportions of households without wealth or bequests. The rates of decline are greater when the correlation coefficient of the earnings shock process ζ is smaller.
Robustness of results on aggregate capital and bequests accumulation.
Finally, robustness is checked with respect to rates of change in aggregate capital and bequests of the three hypothetical economies in comparison to the baseline economy. Table 18 presents aggregate capital and bequests in the economy with complete annuity markets in all the nine cases. As before, the values are normalized so that capital and bequests in the baseline economy are equal to 1 for each parameterization. In all the cases, both capital and bequests decrease with the latter decreasing to a greater extent. When the coefficient of relative risk aversion σ is higher, the decrease in capital is greater and the decrease in bequests is smaller, except for one case. The decreases are larger when the correlation coefficient of the earnings shock process ζ is higher. The rate of capital decline ranges from 1.0%, when σ=3.0 and ζ=0.3, to 12.2%, when σ=5.0 and ζ=0.5, while the rate of bequests decline ranges from 25.7%, when σ=5.0 and ζ=0.3, to 42.3%, when σ=3.0 and ζ=0.5.

Table 19 shows capital and bequests in the economy without earnings uncertainty. Aggregate capital declines in all the cases, whereas bequests decrease in six cases and increase in three cases. Capital decreases more and bequests are more likely to decline when σ is greater except when σ=4.0 and ζ=0.3. As for ζ, there are no such clear-cut tendency. The rate of capital decline ranges from 3.8%, when σ=3.0 and ζ=0.5, to 10.4%, when σ=5.0 and ζ=0.5, whereas the rate of bequests decline ranges from −1.7%, when σ=4.0 and ζ=0.3, to 2.5%, when σ=5.0 and ζ=0.5.

Finally, Table 20 presents capital and bequests in the economy without altruism. Under every parameterization, both capital and bequests decline greatly, and the declines are larger when σ is larger and ζ is smaller. The rate of capital decline ranges from 9.9%, when σ=3.0 and ζ=0.5, to 30.0%, when σ=5.0 and ζ=0.3, while the rate of bequests decline ranges from 18.5%, when σ=3.0 and ζ=0.5, to 45.1%, when σ=5.0 and ζ=0.3.

Comparisons of the three hypothetical economies show that capital decline is always largest in the economy without altruism and bequests decline is always smallest in the economy without earnings uncertainty. Other rankings depend on parameter values, but in six out of the nine cases, capital decline is larger in the economy with complete annuity markets than in the economy without earnings uncertainty, and again in six out of the nine cases, bequests decline is larger in the economy without altruism than in the economy with complete annuity markets. Differences in the rates of change of aggregate capital among the three economies are smallest when σ=3.0 and ζ=0.5 and largest when σ=5.0 and ζ=0.3, whereas differences in the rates of change of bequests are smallest when σ=3.0 and ζ=0.3 and largest when σ=5.0 and ζ=0.3 or when σ=3.0 and ζ=0.5.
CONCLUSIONS
This paper has investigated the quantitative importance of different savings motives on the distributions of wealth and consumption and aggregate capital accumulation by solving an overlapping generations model with intra-generation heterogeneity. Agents differ in age, ability, earnings shocks, and inherited bequests. In the baseline economy, there are uninsurable idiosyncratic risks associated with uncertain lifetime and the earnings shocks. The model's parameter values have been chosen so that the simulated earnings and wealth distributions of the baseline economy match those observed in the U.S. data.
The allocations of the baseline economy have been compared with those of an economy with complete annuity markets, an economy without earnings uncertainty, and an economy without altruism. The numerical experiments have shown that different savings motives seem to affect savings behaviors of the heterogeneous population unevenly; hence, their effects on the distributions and capital accumulation are dissimilar. The effect of completing annuity markets is dominantly on the old population and results in a large increase in wealth and bequests inequalities through higher concentration of assets in the upper tail of the distribution. The results follow because poor people try to annuitize most of their wealth if such annuity securities are available. It also results in an increase in consumption inequality, although the rate of increase is smaller. Alternatively, taking out earnings uncertainty decreases savings by the young population, especially those in low-income groups, but lowers wealth inequality for the whole population because of the equalized lifetime earnings. Moreover, it improves the distribution of consumption significantly. Finally, the disappearance of altruism affects mainly savings behaviors of the old and rich population, and reduces wealth and bequests inequalities significantly by lowering the concentration of wealth in the upper tail of the distribution. However, it only slightly improves the distribution of consumption. Quantitatively, altruism seems to be most important in explaining the distribution of wealth, whereas the absence of insurance markets for earnings uncertainty appears to have greatest significance in determining the distribution of consumption.
The comparisons of aggregate capital and bequests in the three hypothetical economies with those in the baseline economy suggest that, aside from the pure life-cycle motive of savings, altruism is the most important factor affecting aggregate capital and bequests accumulation. Second in order of importance, especially in explaining aggregate bequests, is the absence of annuity markets that generate accidental bequests. The absence of insurance markets for earnings uncertainty, which generates precautionary savings among the working population, seems to have least significance, in particular, in explaining bequests accumulation.
APPENDIX. COMPUTATIONAL ALGORITHMS
ALGORITHM TO COMPUTE THE STEADY STATE DISTRIBUTION
Step 1: Enter the jth iteration with a guess for the real interest rate rj, and the wage rate wj. Also set the interval for assets to be [0, amax].
Step 2 (Solving the Dynamic Programming Problem): Solve the problem backward starting from the problem at age 11.
2–1 (Old Adult's Problem): Given the prices, solve the old adult's maximization problem (17) at age 11 and obtain the value function
and the corresponding decision rules. Given the value function at age 11,
, solve the old adult's maximization problem (17) at age 10 and obtain the value function
and the corresponding decision rules. Continuing in this way, solve the maximization problems up to age 7. The solution of the problem at age 7 gives the value function
and the associated decision rules.
2–2 (Problem at Age 6):
(a) When the parent died before the previous period: Given the value function at age 7,
solve the maximization problem (20) and obtain the value function
and the associated decision rules.
(b) When the parent has just died: Given the value function, solve the maximization problem (17) and obtain the value function
and the decision rules.
2–3 (Young Adult's Problem):
(a) When the parent died before the previous period: Given
(1≤j≤5), solve the problem (22) and obtain
and the corresponding decision rules.
(b) When the parent has just died: Given
(0≤j≤5), solve the problem (17) and obtain
and the decision rules.
(c) When the parent is alive: Given
(0≤j≤5) and
(0≤j≤4), solve the problem (9) and obtain
and the decision rules.
Step 3 (Monte Carlo Simulation): Pick an initial child-parent pair, who are at age 0 and age 6, respectively. Starting from this pair, perform a Monte Carlo simulation for one lineage based on the decision rules computed above. Continue the simulation for large enough numbers of generations. Based on the simulation, obtain the distribution of assets and efficiency labor. Because the model has an ergodic property, the computed distribution remains the same if the simulation is performed for many different lineages. See the next subsection for detailed procedures.
Step 4 (Adjustment of the interval for assets): Check if the distribution of assets does not have a large mass at the maximum level of assets, amax. If it has, increase the value of amax and resolve the maximization problems and redo the Monte Carlo simulation (go back to Step 2).
Step 5 (Update of the prices and the convergence check): Based on the distributions of the state variables, compute aggregate capital kj and efficiency labor lj. Substituting these values into the firm's first-order conditions, obtain the implied real interest rate rj and wage rate wj. Stop if the price differences from the last iteration are small enough. If not, go back to Step 1 with new guesses for the prices. For the updated prices, the weighted averages of the currently used prices and the newly computed prices might be used.
MONTE CARLO SIMULATION
Step 1 (Initial states of the initial child-parent pair): Start the simulation with the initial child-parent pair, whose ages are 0 and 6, respectively. Their initial states must be set.
Assume that the parent of the age 6 adult's parent is dead before the previous period. Then the age 6 adult's state variables are the only information needed to solve his maximization problem (20). His initial assets level
and average labor productivity
are set arbitrary,32
The subscript is an index for generation and the superscript is an index for age. The child's generation and the parent's generation are denoted generation 0 and generation −1, respectively.
are drawn randomly from the underlying (unconditional) distributions. Based on the initial state variables, the decision rules for his current consumption and next period's assets holdings,
, and the transition rules for his state variables are determined.
The state variables of the young adult are the ones needed to solve the problem (9). His initial asset level
is set to be zero, the variables θ0 and
are drawn randomly from the underlying (unconditional) distributions, and the average labor productivity \smash{
} is set to be
Because he is assumed to make decisions after observing his parent's decisions, his remaining state variables (the parental state) are the age of his parent,
and
. The parental state is needed to predict possible bequests receipt. Based on the initial state variables, the decision rules for his consumption and assets
, and the transition rules for the states are determined.
Step 2 (Determination of the initial old adult's living status): Because the old adult faces a positive death probability, his living status for the next period must be determined. His living status is set based on the survival probability. If he dies when turning age 7, the amount of bequest left to the young adult is equal to
.
Step 3 (Initial young adult before age 6 and his parent): One period has passed. If the old adult is still alive, he solves the same maximization problem as in the previous period. Given his current states
and
the decision rules and the transition rules for his states are set.
If the old parent is still alive, the young adult solves the same problem as in the previous period. If not, he receives bequest
and solves the problem (17). The value of
is drawn randomly from the underlying unconditional distribution, which together with the stochastic process (13) determines
. His new average labor productivity
is determined based on (12). The other state variables are set as in the previous period. Given his states, the decision rules and the transition rules for the states are determined. A similar process is continued until the young adult reaches age 6.
Step 4 (Initial young adult after age 6 and his child): Now the young adult is at age 6. At this age, he has a child (age 0) and his parent is already dead. He solves the problem (20) if his parent died before this period and solves the problem (17) if his parent has just died. His child's initial state variables must be set. The initial value for assets
is zero, the variable
is drawn randomly from the underlying unconditional distribution, and the initial ability
must be determined based on the parent's ability
and the stochastic process (\ref{Innate ability}). The initial average labor productivity is given by
The new age 0 individual solves the problem (9).
Step 5 (Remaining generations):Step 3 and Step 4 are repeated for a large enough number of generations, say 150,000 generations. The state variables of the first 15,000 generations are discarded in order to remove effects of initial conditions, and by using the variables for the remaining generations, the distributions of the states over the population are computed.
The views expressed in this paper are those of the authors and do not reflect the official position of Goldman Sachs. We would like to thank Mark Bils and Hugo Hopenhayn for their continuous advice. Useful comments are also provided by Per Krusell. All remaining errors are ours.