


Current food shopping trends indicate an increasing demand for local foods that is presenting new marketing opportunities for small-scale agricultural producers. Some indicators of this growing demand are reflected not only in the increased availability of local foods at traditional retail channels such as supermarkets or through wholesalers but also in the growth of direct marketing channels such as farmers' markets (FMs) and community supported agriculture (CSA) operations. US Department of Agriculture (USDA) estimates that the total US sales at FMs grew 13% from 2000 to 20051, and the number of FMs increased from 1775 in 1994 to nearly 4700 in 20082. Likewise, the total number of CSAs in the US was only about 50 in 1990, but now that number exceeds 22003.
Wholesale channels typically have the ability to move large quantities of produce quickly and usually (but not always) at a lower price than through direct channels. Direct channels often feature higher prices, but require more customer interaction and time requirements of the producer. As such, producers are faced with the decision of whether to move larger volumes of produce through wholesalers at relatively lower prices or seek higher prices in direct markets and run the risk of lower volumes or unsold leftovers. Perhaps more important, given the nature of highly perishable crops, optimizing sales likely requires the flexibility of combining different channels capable of accepting alternative sizes and types of products, and/or absorbing potential unpredictable volumes.
While a great deal of research has investigated consumer responses and preferences for local foods, less attention has been focused on the producer side, particularly in identifying how producers identify their appropriate marketing strategiesReference Brown and Miller4. The existing literature has shown some potential for increases in farm returns through direct marketing; however, the evidence is mixed and depends on a host of spatial, market and demographic factors, as well as firm preferences that may not be financially basedReference Monson, Mainville and Kuminol5. Common generalizations are problematic given that producers marketing through direct channels are a heterogeneous group with wide variation in farm characteristics, including farm size, employment status, labor resources and risk preferences.
Accordingly, the objective of this paper is to develop and illustrate an analytical framework and decision-making tool to improve decision-making acuity for small-scale diversified fruit and vegetable crop producers considering changes in their marketing strategies. Similar to HardestyReference Hardesty6, the relative performance of wholesale and direct marketing channels is considered, including how the factors of owner and hired labor, prices and sales volume interact to impact profitability across channels, as well as the roles that risk preferences and lifestyle choices play when making farm marketing decisions. The decision-making tool is applied to data collected from four case-study farms in Central New York to highlight the relative costs and benefits of various marketing channels and illustrate the usefulness of the model in improving producer marketing decisions.
We continue now with a description of the conceptual model and its adaptation into a case-study framework. This is followed by a description of the data collected and alternative marketing channels utilized by the case-study farms. The channel assessment tool and its components are then described and applied to the set of case-study data collected. We close with a discussion of the empirical results, relevant conclusions and identification of areas for future research.
Methodology
Conceptually, economic theory tells us that to maximize net returns the producer should allocate output to each market channel such that marginal net returns are equal across channels. For example, consider the simple case of one crop with total farm output Q, and two marketing channels, direct (d) and wholesale (w). The producer's problem can be expressed as
where NR is the total net returns, P d and P w are the expected output prices for the direct and wholesale channels, respectively, C d and C w are the respective marketing cost functions, and C(Q) represents all other costs that do not vary across channels. Solving the first-order conditions for Equation 1 yields the familiar equi-marginal result:
where (∂C d/∂Q d) and (∂C w/∂Q w) are the marginal marketing costs for the direct and wholesale channels, respectively. Equation 2 highlights the importance of considering differences in both output prices and marketing costs when evaluating alternative channels. In addition, marginal marketing costs are likely to decrease as the total output allocated to a channel increases, reflecting economies of scale in marketing. As will be shown below, marketing costs can vary considerably across channels, so a producer's interest in getting higher retail prices in one channel may well be offset by higher marketing costs.
Small-scale producers oftentimes fail to account for their own or others' unpaid labor when making production and marketing decisionsReference Tegtmeier and Duffy7–Reference Biermacher, Upson, Miller and Pittman9. When these costs are not well understood or considered the result can be a marketing channel portfolio that does not accurately reflect the optimal decision for that producer. This practice is particularly problematic for small-scale fruit and vegetable producers because labor requirements and costs have the biggest impact on profitability when comparing different channelsReference Hardesty6, Reference Uva10.
While the producer's problem posed above is straightforward, it is deficient for our analysis for two primary reasons. First, the model fails to account for the perishable nature of many of the crops marketed. The level of perishability will affect the length of the marketing windows for many of the crops and oftentimes necessitates the use of multiple channels to avoid losses due to spoilage. The second limitation of the model is that it fails to account for such factors as a producer's level of risk aversion, lifestyle preferences and other similar attributes. These types of factors are often a vital part of the decision for smaller producers who grow and market fresh vegetablesReference Tegtmeier and Duffy7, Reference Hendrickson11, Reference Hunt12.
A more complex model factoring in these limitations is beyond the scope of this study. In addition, cost and returns data collected for this study were limited to four case-study farms over a typical peak-season week. Further data would be necessary to accurately reflect timing effects throughout the season and to estimate the marketing cost functions. Furthermore, the problem could be more appropriately framed within a household production function and utility maximization framework that values and accounts for household labor decisions dedicated to production, marketing and leisure. To accommodate these issues, an alternative case-study approach is presented.
Case-Study Farm Data
Information on costs and returns were collected from four successful small-scale fruit and vegetable farms in Central New York. The farms were intentionally selected to illustrate a diverse array of marketing channels. Given the limited number of farms, we do not purport that the channel-specific data are necessarily representative of typical channel performance for the larger underlying population. However, the use of the data remains useful in highlighting the important inputs needed and outputs generated from the channel assessment tool.
Wholesale marketing channels are defined as those channels for which sales are to a buyer who is not the ultimate end user. Wholesale channels utilized by the case-study farms included selling to restaurants, grocery stores and distributors. Direct marketing channels are defined as those channels for which sales are made directly to the end user. Direct channels utilized on the case-study farms included CSA, farm stand (unstaffed), FM and u-pick (staffed) operations. A summary of the farms and the marketing channels utilized are shown in Table 1. All of the farms have been in operation for over 5 years, and have between 7.3 and 8.1 ha in diverse vegetable and small fruit production.
Table 1. Case-study farm comparison and marketing channels utilized.
a CSA, community supported agriculture.
Labor data for specific marketing activities were collected from each farm, as well as distances traveled, employee labor rates and gross sales. Each item was categorized by marketing channel in order to assess the channel-specific costs and returns. To get a better sense of the farm production and marketing operations, multiple interviews were conducted with the farm owners and employees. In addition, a survey was conducted among 14 local diversified fruit and vegetable growers to gain a more complete understanding of farmers' perceptions regarding marketing channel risks.
Consistent with HardestyReference Hardesty6 and in interviews with the farm operators, it was clear that, regardless of channel, the major marketing cost for each farm was labor. This is also consistent with UvaReference Uva10, who found that labor constraints were the main barrier to direct marketing by vegetable farms surveyed in New York. While each channel has additional costs, such as packaging materials and market fees, labor is by far the largest cost component.
During 1 week of the study (August 4–10, 2008), the owner(s) and employees of each farm were asked to keep daily activity logs to determine how labor was devoted to various marketing activities during a ‘typical’ peak-season week. Logs were completed by all farm staff, including owners, hired staff, unpaid family members and volunteers. The particular week was chosen through interviews with the farmers. August is the beginning of ‘peak season’ for many specialty crops and the August–October period represents the highest gross sales volumes and largest diversity of marketable crops for specialty crop growers in the area. In addition, the proportion of sales through each marketing channel was consistent with the previous year. Finally, each farmer was interviewed at the conclusion of the week to learn if there had been any unusual incidences that might skew the data, such as key employee absences, severe weather affecting either activity on the farm or at a market, unusually high or low sales, or crop failures.
Only labor activities from harvest to market were tracked. Production activities are expected to be the same across channels and were excluded. In interviews, farmers stated that their production activities (i.e., planting, cultivating, fertilizing, irrigating, weeding, etc.) did not vary for a crop based on its marketing channel destination. In fact, most crops were grown with more than one market destination in mind, but all were treated the same until the point of harvest. Harvest activities are included in marketing labor because it was determined through these same interviews that harvest activities vary depending on the marketing channel (e.g., bunching and tying beets in the field for wholesalers versus harvesting loose for a FM).
The average hourly rate paid to hired staff was US$8.46 (median=US$8.25) and ranged from US$6.50 to US$13.89 across all farm employees. To assign a labor value for unpaid volunteer, family member and owners' time, a conservative hourly rate of US$8.50 was used.
For purposes here, profitability is defined as gross sales minus marketing labor and travel costs. Wholesale prices received by farmers are prices for goods delivered by the farm. For the CSA marketing channel, farms are paid at the beginning of the growing season in exchange for a weekly share of produce, which made the week's gross sales value difficult to assess. As such, we relied on values assigned by the farmer for produce marketed through CSAs, which were the same or similar to the farms' wholesale prices received.
It should be noted that the sales and cost values for the u-pick channel represent data from just one farm since only one of the four farms offered u-pick. Similarly, the farm stand channel is represented by only one farm, and operates unstaffed with an honor system for payment. Given the small sample size of farms (N=4) and even smaller number of farms participating in each of the channels outlined here, it is important to re-emphasize that the empirical results are not assumed to be representative of each channel's performance, but are used to facilitate the discussion and usefulness of the firm decision-making tool developed.
Marketing Channel Activities
Small farm marketing can generally be divided into four activities: harvest, process and pack, travel and delivery, and sales time. Given that two of the four farms utilized all three wholesale channels with similar product requirements, it was difficult to separate the harvest and processing activities for these channels. Accordingly we combine all three wholesale channels into one composite channel.
Harvest
Harvesting is the process of gathering saleable produce from the fields and, for a diverse group of fruits and vegetables, can be a very time intensive activity. In particular, for small-scale farms hand-harvesting tends to be conducted on all or nearly all of the crops harvested. The amount of labor devoted to harvest varies depending on the marketing channel but, in general, is higher for the wholesale channels. Wholesale markets typically require products of a consistent size and quality and packing to standardized case weights. Additional labor is also required to sort and bunch crops for wholesalers as they are harvested in the field.
Processing and packing
Process and pack activities include: culling, grading, sorting, washing, bagging, packaging, and packing orders and boxes. Processing produce, like harvesting, varies depending on the marketing channel. Produce destined for wholesale buyers requires a higher degree of washing, culling, grading and packaging than does the same produce destined for direct sales. In particular, wholesale customers demand produce of consistent size, while farmers report that direct marketing customers are satisfied with irregularly shaped and sized produce.
Travel and delivery
Transport time includes travel to and from FMs, satellite farm stands, and deliveries to restaurants, grocery stores and distributors. Also included is time spent loading and unloading produce. Grocery stores, restaurants and most distributors require delivery. While many CSAs have a member pick-up day at their farm, customers are sometimes offered additional locations, or delivery is available for an extra fee.
Sales
Sales time includes ‘face time’ with customers, time spent invoicing, making sales calls, creating daily harvest sheets or price lists, and doing other administrative tasks. Direct sales channels generally require a higher level of customer service and a positive, friendly attitude; however, they can also provide producers with valuable customer feedback on buying preferences and price sensitivity. Some farmers enjoy interacting with consumers and consider selling in the direct channels a rewarding community event and an opportunity to build their farm's brand. While some view customer interaction as a bonus, not everyone is skilled at interfacing with customers in this way.
Marketing Channel Results
Data collected from the farms were used to analyze each channel's performance with regard to sales volume, profit, labor requirements and risk preferences. All metrics are then integrated together to consider the aggregate performance across a suite of channels utilized.
Sales volume
The volume that can be sold through a given channel has a large impact on profitability. The more perishable the crop, the more important it is to have a channel that can absorb the volume harvested as quickly as possible. Optimizing sales of perishable crops requires the flexibility of combining different channels capable of absorbing unpredictable volumes. The general trade-off between relatively high- and low-volume marketing channels is price. However, despite lower prices, high-volume channels offer the benefit of increased efficiency in the harvest and production process.
The total volumes sold by the case-study farms during the studied week illustrate the relative volume capacity of each marketing channel. The average volumes sold for each channel were derived from the group's total gross sales for the week and normalized relative to the FM sales volume average. For this group of farms, wholesale channels were able to sell roughly 3.4 times as much (in value) as FMs even though they offered the lowest price (Table 2, column 2).
Table 2. Market channel evaluation and ranking (four case-study farms).

a Normalized volume index scores based on computed dollar volume sales. The scaled rankings range from 1 to 5 (the number of channels evaluated), where 1 is the ‘best’ and 5 is the ‘worst’. The scaling considers how far apart the factor scores results are from each other.
b Average profit percentages per dollar of gross sales are calculated as 100*[(sales−(labor+mileage)/sales].
c Normalized labor index scores based on computed labor hours per sales dollar.
d Risk ranking based on farmer survey overall rankings.
e Final scores represent average scaled rankings across factors, either un-weighted or factor-weighted. The lowest score represents the highest performing channel. Channels scoring low and near to each other indicate preferred multiple-channel options.
f The factor weights used here are for illustrative purposes only, where sales volume is the most important factor (0.40), risk is the least important factor (0.10), and labor requirements and per unit profits are somewhere in between (0.25). Individual factor weights should be from 0 to 1, and the sum over all weights must equal 1.
CSA, the next highest volume, offered the same or slightly higher prices than wholesale outlets. Given an adequate number of shares sold up front, CSAs can consume large volumes. In addition, it is always possible to give members more in their share if a particular crop is plentiful, but this does not translate into more income, just less wasted produce. U-pick, the third highest volume marketing channel, also offers a relatively low price compared with other direct marketing channels.
Profits
While sales volumes are important, returns relative to costs are also important for long-run firm viability. From our case-study farms, we compute the average profit percentages by market channel, calculated as net returns relative to gross sales (i.e., gross sales less marketing labor and mileage costs, then divided by gross sales). The results are shown in Table 2 (column 4).
In this case, the CSA channel was shown to have the highest profitability percentage, followed closely by the unstaffed farm stand. As expected, per dollar of gross sales, the profitability of the wholesale channel was the lowest. This highlights the trade-off in volume versus unit profits, but both should be considered in making marketing channel choices.
Risks preferences
In addition to the normal production risks of weather and pests, each marketing channel offers a set of risks to the producer. Marketing risk comes in many forms, including market demand for a crop, price, competitors, failure to offer a diverse selection and low volume sales. Additional risks include the possibility of low customer turnout resulting in unsold product.
In a survey conducted with the case-study farms, as well as additional Central New York vegetable farms, farmers were asked what they felt were the primary risks associated with each channel. When asked open-ended questions about risks, respondents did not adhere to the strict meaning of risk, but also listed drawbacks and challenges. In any event, the responses were categorized into seven basic challenges: low volume sales, high labor and marketing costs, the ability to provide product of consistent quantity and quality, buyer failure to fulfill commitments, competition, unpredictable customer turnout, and low prices and profits. Table 3 illustrates the frequency that each challenge was mentioned.
Table 3. Number of risks and challenges associated with marketing channels, survey of 14 Central New York vegetable producers.

The results show that fear of low sales volume was an issue with the restaurant channel and most often for FM (Table 3). As an example, interviewed farmers indicated that approximately 20% of produce harvested and brought to a FM goes unsold. Low prices are a risk created by competition from other farms, other channels, or result from a market flooded with a certain item.
Farmers revealed their fear of commitments with wholesale buyers when they identified the risks of buyer-back-out and crop failure (Table 3). While crop failure is a concern for all channels, the case-study farmers clarified that they are more stressed over crop failure with wholesale channels due to the commitments they have with buyers. Farmers were also concerned about wholesale customers backing out of orders if their needs change suddenly, if they refuse produce due to poor quality, or if they turn to another supplier.
The two main reasons given for avoiding a particular marketing channel amongst the case-study farms were lifestyle preferences and stress aversion. Wholesale channels tended to create stress because they required higher levels of product preparation, product specifications and volume commitments. Distributors were also perceived to be very demanding, where producers must accept dictated prices, deadlines and delivery logistics. Alternatively, direct marketing channels were perceived as relatively low stress. This was particularly mentioned with the CSA channel that may have lower expectations in terms of processing and packaging.
Each of the direct marketing channels, except for the CSA, aroused concerns over customer turn out (Table 3). Factors such as weather, location, competing events and the availability of parking were all mentioned as risks when direct marketing. Low customer turn out implies the possibility of increased wasted produce due to non-sales. However, the case-study farms indicated that having a marketing strategy that combines wholesale and direct channels minimizes wasted product.
The most frequently cited concern regarding all marketing channels was high labor and marketing costs (Table 3). Of the direct channels, high marketing costs were most frequently mentioned for FMs that tend to be labor intensive and carry additional marketing costs, such as market fees, advertising and travel. The wholesale channel cited as having the highest marketing costs was the distributor. Respondents mentioned a high level of labor needed to solve the ‘logistical headaches’ of delivery, the high level of quality control work and the added ‘time and energy for good service’ when selling wholesale.
Labor requirements
While surveyed farmers perceived that wholesale channels were generally more labor intensive than direct channels, data from the case-study farms demonstrate that in wholesale, the return in gross sales for each hour worked is about the average of all channels evaluated. This is shown in Table 2 (column 6), where the hours of marketing labor per sales dollar are normalized on the CSA channel.
The FM and u-pick (staffed) channels required higher than average levels of labor to achieve the same level of sales. FM, farm stand and u-pick channels generally require a high degree of customer interaction and are channels that reward a tidy appearance and welcoming display. Of course, farm stands and u-pick sales can be conducted using honor system payment, but some minimal level of customer interaction is inevitable. CSAs require relatively little customer interaction except during weekly pick up times, but they may have newsletters or email updates for their members.
Wholesale customers require less interaction, except when discussing orders or making deliveries. Also, once a relationship is established with a wholesale buyer, sales calls take less time. Wholesale accounts allow more anonymity; however, promotion in the form of cases of free sample product is common.
Other channel-specific costs
While some operational costs are common among all marketing channels (utilities, equipment, insurance, licenses and certifications, vehicles, buildings, etc.), each channel has additional costs and requirements that are specific to that channel. A list of associated costs by marketing channel is summarized in Table 4. It is important to consider these associated costs when determining marketing channel choices; however, due to the potential for large variations in the scale of sales through each channel, the operator's chosen level of marketing management, and staffing, it is not useful to compare the channels in regard to these costs here. For more information on these costs see LeRouxReference LeRoux13.
Table 4. Summary of marketing channel associated costs.Footnote a

a X=necessary, R=recommended, O=optional, NA=not applicable, R/G/D=restaurant, grocery store or distributor.
Assessing a Marketing Channel Strategy
As discussed above, choosing the appropriate marketing mix includes consideration of many factors, including sales volume, profit, risk, lifestyle preferences, labor requirements and channel-specific costs. The weights (or importance) assigned to each of these factors is unique to the individual or firm. Additionally, the nature of highly perishable crops, along with the risks and potential sales volumes of particular channels, requires combining different channels to maximize firm performance.
Multiple channel strategies were utilized by all of the case-study farms. Figure 1 illustrates the different marketing channel strategies used by the farms that allowed them to diversify the sources of their income, as well as optimizing sales of unpredictable levels of harvest. Each farm has a ‘steady’ marketing channel with a relatively consistent demand, and represents the farm's first priority for the weekly harvest. Once that channel is satisfied, the farm's other channels can be supplied with additional harvest. Case studies in California similarly found that direct marketing, when used along with wholesale, can increase producers' overall profitabilityReference Hardesty6.
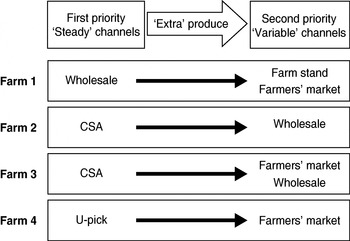
Figure 1. Marketing channel combinations used by case-study farms.
Channel ranking
To overcome the difficulty of comparing channels, a ranking system was developed to summarize four major factors influencing the performance of a channel (i.e., labor requirements, sales volume, profit percentage and risk preferences). Table 2 shows each channel's factor scores along with their relative rankings for this set of case-study farms. While the results reflect the combined information from all four farms, the tool is developed such that individual farm data are entered and evaluated across the specific channels utilized.
Each set of factor scores across channels is ranked from one (i.e., the highest rated channel for that factor) to five (i.e., the lowest rated channel for that factor) and scaled to reflect the relative distance between factor scores. The ranking of channel riskiness comes from the results of the 14-farm survey (Table 2, column 8). The scaled factor rankings for each channel are averaged in Table 2 to determine the final channel scores, either un-weighted (column 9) or factor-weighted (column 10). The use of factor weights allows individuals to give greater weight to those factors that may be more important to them than others. The lowest overall score is defined as the top performing channel; however, channels scoring low and close to each other provide some indication of preferred multi-channel strategies.
For our general case (assuming equal factor weights), the top performing channel across these four farms was the CSA, including top rankings for profit percentage, risk and marketing labor requirements. While individual farm results are likely to vary, the results are consistent with similar studies conducted in Wisconsin and CaliforniaReference Hardesty6, Reference Hendrickson11. Wholesale channels ranked in the middle, primarily due to differences in labor requirements across the direct channel options.
The FM had the lowest overall ranking for this set of farms, although not the least profitable, suffering from a combination of higher labor demands and low sales volumes. Farmers participating in the case study ranged from $21.05 to $30.74 gross sales per hour of marketing labor when selling at FMs. While total hours of labor for FMs represented 30–37% of participating farms' labor during the case-study week, the channel only produced 28–30% of the same farms sales that week. That said, the FM can still be a useful resource for small-scale farmers, particularly new farmers, in terms of enhancing farm exposure and advertising for other channels utilized (e.g., wholesaling with chefs and other buyers). In fact, while the FM channel was ranked as one of the more risky channels, the producer survey revealed that producers enjoyed the experience and connection to their consumers and, thus, continued to participate.
Changes in channel rankings are evident when we assume differing weights across factors. In the example presented, more weight is placed on sales volume and less on perceived risks. In this case, the wholesale channel improves its ranking relative to the equal weight scenario, more readily suggesting a strategy that incorporates both CSA and wholesale channels.
Conclusions
Conducting accurate assessments of marketing channel choices by small-scale farmers requires increased attention toward proper record-keeping to properly account for sales, labor requirements and other associated costs. In addition, failure to account for owner/family unpaid labor contributions can result in channel selections that reduce overall firm performance. In fact, the ‘hidden operator labor costs’ can go a long way in explaining farmer misconceptions regarding the profitability of various channels.
A marketing channel assessment tool was developed and applied to a set of four small-scale fruit and vegetable farmers in Central New York. For this set of farms, it was revealed that the CSA was the top performing channel, based on ranked factors of volume, unit profits, labor requirements and risk preferences. However, given the perishability of many of the crops marketed and potentially unpredictable harvest volumes, optimizing sales requires the flexibility of combining different channels. For our group of case-study farms, augmenting the direct channel CSA with wholesale outlets was preferred.
The relative performance of marketing channels may be different for other firms based on their specific farm marketing activities and market areas operated in. Combined with careful data collection of channel-specific marketing labor activities and sales, the channel assessment tool aids in informed decision-making for producers wishing to change their marketing mix, increase profitability or decrease the amount of labor involved in their current marketing activities.
While the approach offered here presents a useful method for evaluating market channel choices, the analysis would benefit from increased data collection from a larger variety of fruit and vegetable producers, differentiated by firm size, location and channels utilized. Such additional information will allow for refinement of market factors most important in optimal channel decisions, provide additional information on a larger set of wholesale and direct marketing channels, and facilitate the development of channel-specific, representative benchmark estimates. Paying careful attention to these issues is a top priority for our continuing research.
Acknowledgements
This research was supported in part by the US Department of Agriculture, Northeast SARE Partnership Grant Program and the New York Farm Viability Institute Education Innovation Grant Program. Any opinions, findings, conclusions or recommendations expressed in this publication are those of the authors and do not necessarily reflect the views of the US Department of Agriculture, New York Farm Viability Institute or Cornell University.


