


White micas are the most abundant phyllosilicates in sedimentary and very low-grade metamorphic environments, muscovite and illite with K as the interlayer cation being the most common members of this group. The occurrence of NH4 micas and NH4 illites with ammonium substituting for K in interlayer sites in nature has also been described (e.g. Duit et al., Reference Duit, Jansen, van Bremen and Bos1986; Juster et al., Reference Juster, Brown and Bailey1987; Daniels & Altaner, Reference Daniels and Altaner1990; Wilson et al., Reference Wilson, Parry and Nash1992; Guidotti & Sassi, Reference Guidotti and Sassi1998; Nieto, Reference Nieto2002; Bauluz & Subias, Reference Bauluz and Subías2010; Bobos, Reference Bobos2012).
The presence of NH4-micas was first noted by Yamamoto (Reference Yamamoto1967) in some pyrophyllite schists and then by Kozac et al. (Reference Kozac, Ocenas and Derco1977) in metamorphic rocks associated with aluminium hydroxides and mullite. The NH4-dominant mica was later described as a new mineral, tobelite (Higashi, Reference Higashi1982).
In very low-grade metapelites, tobelite is associated with organic-rich environments. Tobelite originates from the release of NH4 from organic matter, migration associated with oil, and then incorporation in phyllosilicates, with a maximum fixation coincident with the “oil window” (Williams et al., Reference Williams, Ferrell, Chinn and Sassen1989, Reference Williams, Wilcoxon, Ferrell and Sassen1992). Šuchá et al. (Reference Šuchá, Kraus and Madejová1994) observed NH4-rich illite, along with K- and Na-illite, in shales associated with meta-anthracite coalfields in the Western Carpathians and estimated a temperature of formation of 200–270°C from vitrinite reflectance. In the very low-grade metamorphic rocks of Pennsylvania, Juster et al. (Reference Juster, Brown and Bailey1987) identified minor amounts of mixed-layer NH4/K, although the majority of the micas studied were discrete NH4- or K-illites.
In contrast to the lower-temperature cases reported (Juster et al., Reference Juster, Brown and Bailey1987; Drits et al., Reference Drits, Lindgreen and Salyn1997), Nieto (Reference Nieto2002) observed NH4 and K areas being segregated into well separated mica packets with only minor intergrowths and almost no interlayering. Thus, the evolution of tobelite during low-grade metamorphism follows a path of metastable mixed compositions which increase in terms of segregation as the grade increases.
In the present study, the improved spatial and analytical resolution of new techniques of electron microscopy were utilized to analyse the micro- and nano-texture and composition of co-existing ammonium-bearing and pure-K micas in very low-grade metamorphism black shales. The XRD, IR, high-resolution TEM (HRTEM), AEM and EELS were used to assess the possible existence of a solid solution, interlayering or intergrowths between K- and tobelitic components in very low-grade metamorphism micas as well as their spatial relationships at the nanoscale.
MATERIALS AND METHODS
The black shales selected for the present study came from Silurian outcrops in the Iberian Range (NE Spain). In some of these outcrops the black shales were intruded by andesitic sills that produced hydrothermal alteration with crystallization of pyrophyllite (T = 224–270°C) and later mixed-layer I-S R1 (T < 200°C) (Bauluz & Subías, Reference Bauluz and Subías2010). Subsequently, during the late Variscan, the shales and sills were folded and penetrative schistosity was developed. The overall mineralogical composition of these black shales, including the two parageneses, includes mainly pyrophyllite, NH4- and K-illite, mixed-layer I-S R1, quartz and minor paragonite (Bauluz & Subías, Reference Bauluz and Subías2010). One of the samples analysed in the present work corresponds to these shales (Checa-7). Black shales located farther from the intruded sills (sample ON-1) have a simpler mineralogy, being characterized by NH4- and K-illite and quartz. In addition to their different mineralogy, according to previous XRD data, the two shales selected show NH4-rich micas with different proportions of NH4 in the mica interlayer. The typical anchizonal texture of the Silurian black shales is shown in Fig. 1. Kübler Index (KI) values ranging from 0.24 to 0.44°2θ and an average of 0.34°2θ characteristic of low anchizone grade were noted by Bauluz & Subías (Reference Bauluz and Subías2010).

Fig. 1. Representative back-scattered SEM images showing the anchizonal textures of the black shales corresponding (a) to areas with intruded sills (modified from Bauluz & Subías, Reference Bauluz and Subías2010) and (b) to areas far away from the intruded sills. I-S: mixed-layered illite-smectite, Ms: muscovite, OM = organic matter, Py: pyrophyllite, Qtz: quartz.
X-ray diffraction studies were carried out on randomly oriented powder mounts and oriented <2 µm fractions separated by centrifugation. Air-dried and ethylene-glycol oriented samples were analysed to detect any expandable components. A Philips P1729 diffractometer (sample Checa-7) and an X'Pert Pro diffractometer equipped with an X'Celerator solid-state linear detector (sample ON-1), with Cu-Kα radiation in both cases were used. In sample ON-1, which has superimposed peaks, the identification of phases and the measurement of d spacing of each individual peak were carried out using decomposition routines included in the MacDiff software (Petschick, Reference Petschick2010). Quartz was used as internal standard for calibration of the d spacings.
Additionally, the <2 µm fractions of sample ON-1 were saturated with Mg, Ca, Sr and Na by dispersion of the solid in 1 M chloride solutions of each cation to verify if they contained smectite or vermiculite layers. These treatments were repeated twice. The solids were then washed with chloride solutions of decreasing concentration (0.1 and 0.01 M) and, finally, were rinsed four times with Milli-Q water to eliminate any possible remaining chlorides. Fourier-transform Infrared (FTIR) spectra were obtained using a JASCO 6200A spectrophotometer with an Attenuated Total Reflection (ATR) accessory at the Centro de Instrumentación Científica (C.I.C.), University of Granada, Spain, over the range 4000–400 cm–1 using wafers with 2.0 mg of the <2 µm fraction and 200 mg of KBr in the two selected samples.
Sample preparation for TEM study involved impregnation of the samples in L.R. White resin (Kim et al., Reference Kim, Peacor, Tessier and Elsass1995; Bauluz et al., Reference Bauluz, Peacor and González-López2000; Vazquez et al., Reference Vazquez, Bauluz, Nieto and Morata2016), to avoid collapse of expandable interlayers under high vacuum, which would make it impossible to distinguish smectite and illite layers in I-S.
Low-magnification and high-resolution (HR) TEM images were obtained using a JEOL-2000 FXII microscope equipped with an Oxford instrument detector (EDS) at the University of Zaragoza, Spain, operating at 200 kV, with a beam current of 20 mA, using sticky wax-backed thin sections. Typical areas were removed for TEM observation via attached Cu washers, thinned in an ion mill, and finally coated in carbon. In order to obtain the imaging conditions described by Guthrie & Veblen (Reference Guthrie and Veblen1989, Reference Guthrie, Veblen, Coyne, McKeever and Blake1990a, Reference Guthrie and Veblenb), through-focus series of images were obtained from 1000 Å underfocus (approximate Scherzer defocus) to 1000 Å overfocus, in part to obtain optimal contrast in I-S ordering (overfocus). The mixed layer I-S observed by TEM was named according to the nomenclature proposed by Bauluz et al. (Reference Bauluz, Peacor and González-López2000), using the notation where n is the number of illite-like layers associated with a given smectite-like layer (i.e. IS-IS- layers are denoted as I1 units, ISI-ISI- as I2 units).
The scanning transmission electron microscopy (STEM) study was performed with an Analytical Titan Low-base FEI with a beam current of 1 nA, operating at 200 kV. Previously, some EELS spectra were taken of clay particles of both samples. Because the N peak was only observed in mica particles of Checa-7, the rest of the EELS study was performed on this sample. Lamellae were extracted from the Checa-7 impregnated with LR White resin using a Dual Beam Helios 650 model with a Focused Ion Beam (FIB) column. The lamellae obtained were ~3.5 µm × 3 µm and ~50–80 nm thick. Working under STEM conditions, AEM analysis was performed and EELS spectra were collected on nm-sized rectangular areas. For EELS experiments, the microscope was fitted with a Gatan Energy Filter Tridiem 866 ERS and a monochromator. The EELS spectroscopy allows detection of light elements such as nitrogen, which is not detectable by AEM, and the detection limit for this element using this method is 1%.
Powdered samples of the original ON-1 specimen and those treated with Sr were deposited on holey, C-coated Cu grids. A Philips CM20 instrument, operating at 200 kV, was used for quantitative chemical analyses in STEM mode, with an EDAX solid-state energy dispersive X-ray (EDX) detector; a scan window of ~20 nm × 100 nm was used for the analysis of individual clay particles. Loss of alkalis, especially K, is a significant problem in the analysis of defect-rich minerals and short counting times were used as a compromise for K analyses (Nieto et al., Reference Nieto, Ortega-Huertas, Peacor and Arostegui1996). Albite, biotite, muscovite, spessartine, olivine and titanite standards were used to obtain K-factors for the transformation of intensity ratios to concentration ratios according to Cliff & Lorimer (Reference Cliff and Lorimer1975). The AEM analyses of micas were normalized to six cations in tetrahedral and octahedral sites to minimize the effect on the calculated formula of the lack of data on NH4 which is not detectable by AEM. The data are expressed as atoms per formula unit (a.p.f.u.) in relation to O10(OH)2.
The analyses by XRD, IR and HRTEM were performed on both selected samples. The STEM study of lamellae was carried out on Checa-7, which is richer in NH4 than sample ON-1, according to the XRD study. Microanalyses of particles of sample ON-1 were performed to prevent misinterpretation of the data, because it contains only mica phyllosilicates, unlike Checa-7, which also contains I-S and pyrophyllite.
RESULTS
X-ray diffraction
The oriented XRD traces of the <2 µm fraction of the two samples are shown in Fig. 2. In sample ON-1, the only peak present in the low °2θ region is the (00l) basal reflection of mica (~10.15 Å); the XRD trace of Checa-7 contains the (001) reflection of mica (~10.10 Å) along with that of the pyrophyllite (~9.21 Å) and those corresponding to R1 I-S (~22.79 Å and ~11.16 Å). After ethylene glycol treatment, the mica peak shows no significant changes; in contrast the peaks of R1 I-S shift to lower angles (~26.69 Å and ~13.27 Å, respectively) due to the presence of an expandable component. Saturation of the ON-1 sample with Mg, Ca, Sr and Na caused no changes in the d spacings, widths or shapes of mica peaks in the XRD patterns, indicating that the micas do not contain expandable components.
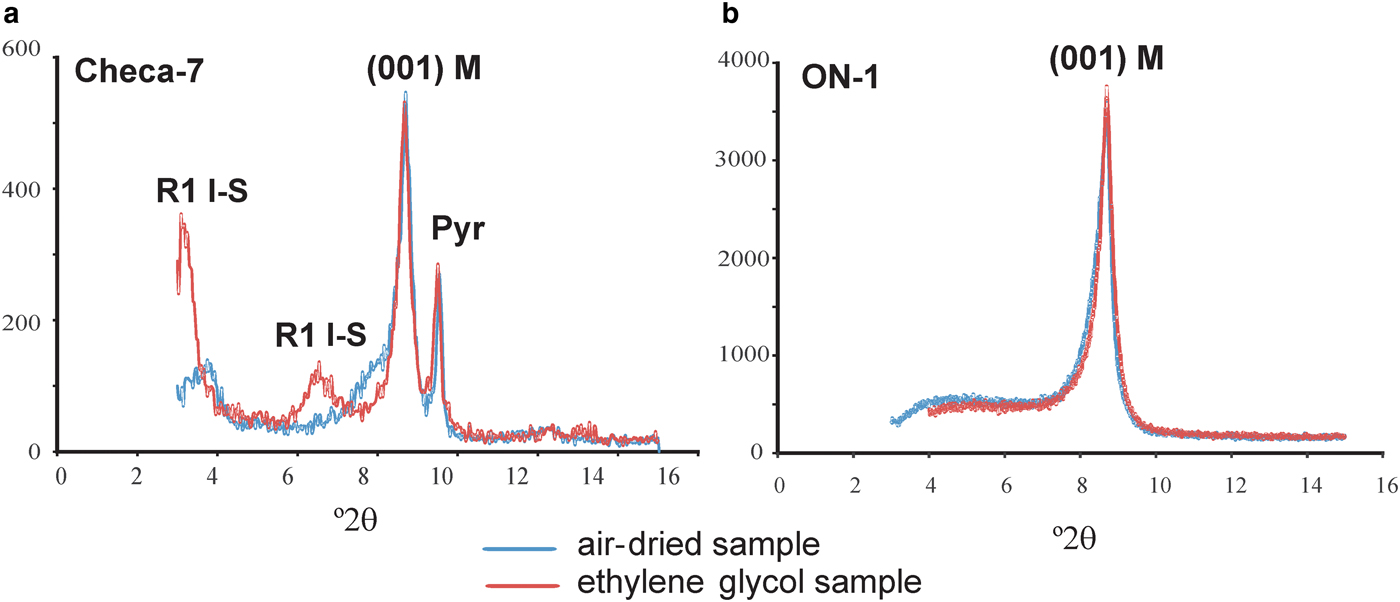
Fig. 2. XRD traces of oriented <2 µm fractions of Checa-7 (left) and ON-1 (right). R1 I-S: mixed-layer illite-smectite, M: mica, Pyr: pyrophyllite.
The positions of the 003 and 005 reflections of micas allowed calculation of the exact d 001 spacing, 10.08 Å, for sample Checa-7 and 10.05 Å for sample ON-1. The decompositions of the 003 and 005 reflections are shown in Fig. 3 (which are different for Checa-7), were necessary to determine these parameters for sample ON-1. The d 001 spacing of K-illite was 9.9–10.0 Å and that of tobelite was 10.3 Å.

Fig. 3. XRD traces of sample ON1 and decomposition of 003 (a) and 005 (b) reflections of mica: (1) ammonium-bearing mica peak; and (2) potassium mica peak.
Appplication of the equations of Higashi (Reference Higashi2000) to the d 001 spacing of NH4-bearing micas in samples ON-1 (10.05 Å) and Checa-7 (10.08 Å) yielded 13% and 21% of ammonium in their corresponding interlayers, whereas using the equations of Drits et al., (Reference Drits, Lindgreen and Salyn1997) yielded 20% and 29% NH4, respectively. These values imply the presence of 0.13–0.20 atoms per formula unit (a.p.f.u) of NH4 in the mica interlayer in ON-1 and 0.21-0.29 a.p.f.u in that of Checa-7. Repetition of the procedure after the subtraction of Kα2 produced no change, as the difference in angular position between the two Kα radiations is much smaller than that between the peaks of the two micas.
Infrared spectroscopy (IR)
A characteristic absorption band at ~1426 cm–1 is evident in the IR spectra in both samples, indicating the presence of NH4 in the mica interlayer (Fig. 4), in accordance with the XRD results. The NH4 content in sample ON-1 was calculated, using the relative intensities of NH4 (1430 cm–1) and OH– (3620 cm–1) absorption bands (Higashi, Reference Higashi2000). As the OH– band is common in all the phyllosilicates, application of the approach to the Checa-7 sample was precluded by the presence of pyrophyllite and R1 I-S. Application of the equation of Higashi (Reference Higashi2000) to sample ON-1 (0.41) suggests 0.27 a.p.f.u. of NH4 in the mica interlayer.

Fig. 4. IR spectra (samples ON-1 and Checa-7) showing the characteristic absorption band of NH4 in the mica interlayer.
Transmission electron microscopy (TEM) study
Representative low-magnification images of the general texture of the black shales analysed are shown in Figs 5 and 6. The areas formed by phyllosilicates are composed of parallel to sub-parallel mica packets 100–250 Å long. In the case of sample Checa-7 the mica packets are separated by other packets composed of mixed-layer I-S.

Fig. 5. Representative TEM images of sample Checa-7. (a) Low-magnification image showing subparallel to parallel phyllosilicate packets; (b) mixed-layer I-S area showing the typical contrast and spacings of I1 (22 Å) and I3 units (42 Å); (c, d) mica packets that, on average, show 9.8, 10 and 10.2 Å lattice fringes. The corresponding insets show typical SAED patterns of 1Md polytypes.

Fig. 6. Representative TEM images of sample ON-1: (a) low-magnification image showing subparallel to parallel mica packets; (b, c) mica packets formed, on average, by 10–10.3 Å fringes; (d) SAED pattern characteristic of 1Md polytype; 00l reflections show a split from the 004 reflection that may correspond to potassium- and ammonium-bearing micas.
Representative HRTEM images of sample Checa-7 are shown in Fig. 5. The shale is composed of mica packets with nearly straight lattice fringes, constant 10 Å spacings and relatively well defined boundaries typical of K-micas. Packets with spacings of 9.8 or 10.2 Å, on average, have also been observed. Their corresponding selected area electron diffraction (SAED) patterns are consistent with those of typical 1Md polytypism. Fringes in mixed-layer I-S areas show alternate dark and light contrast typical of interstratified I-S (Guthrie & Veblen, Reference Guthrie and Veblen1989, Reference Guthrie, Veblen, Coyne, McKeever and Blake1990a,Reference Guthrie and Veblenb; Veblen et al., Reference Veblen, Guthrie, Livi and Reynolds1990). These fringes have spacings with 21–22 Å periodicity (I1 units as described above) characteristic of the sum of illite-like and partially collapsed smectite-like layer spacings in R1 I-S (Kim et al., Reference Kim, Peacor, Tessier and Elsass1995; Dong et al., Reference Dong, Peacor and Freed1997; Bauluz et al., Reference Bauluz, Peacor and González-López2000; Vazquez et al., Reference Vazquez, Bauluz, Nieto and Morata2016). Occasionally, lateral transitions between I1 I-S and I3 I-S units were observed.
The coexistence of K micas and NH4-bearing micas was observed in sample ON-1. Packets with 10 Å spacings typical of pure K micas and other packets with larger d 001 spacings, 10.2–10.4 Å on average, corresponding to NH4 micas have been observed (Fig. 6b,c). The SAED patterns of these areas (Fig. 6d) which correspond to the 1Md polytype, show splits in the 00l reflections. No differential behaviour in terms of stability under the electron beam was detected between the two types of micas.
Analytical electron microscopy (AEM)
The structural formulae of micas obtained by AEM on powdered portions of the original and Sr-treated ON-1 are listed in Table 1. The analyses indicate dioctahedral phases with AlVI>AlIV consisting mainly of Si, Al and K with minor proportions of Fe and Mg. Sr was not detected in the Sr-treated sample.
Table 1. Structural formulae (a.p.f.u) of micas determined by AEM.

Note: Normalized to six cations in tetrahedral and octahedral sites. Analyses 1b to 9b correspond to the Sr-saturated sample.
Projection of mica compositions onto a Si vs. K graph shows some scattering of the chemical composition of micas (Fig. 7). This is attributed, in part, to the analytical technique, but might also indicate a lack of chemical homogeneity, which is common in very low-grade metapelites. The variations in the K content are probably due to the variable NH4 occupancy in the mica interlayers. No significant differences were found between the AEM analyses of the Sr-treated particles and those without treatment, confirming that the micas do not contain expandable components, in agreement with the XRD results.
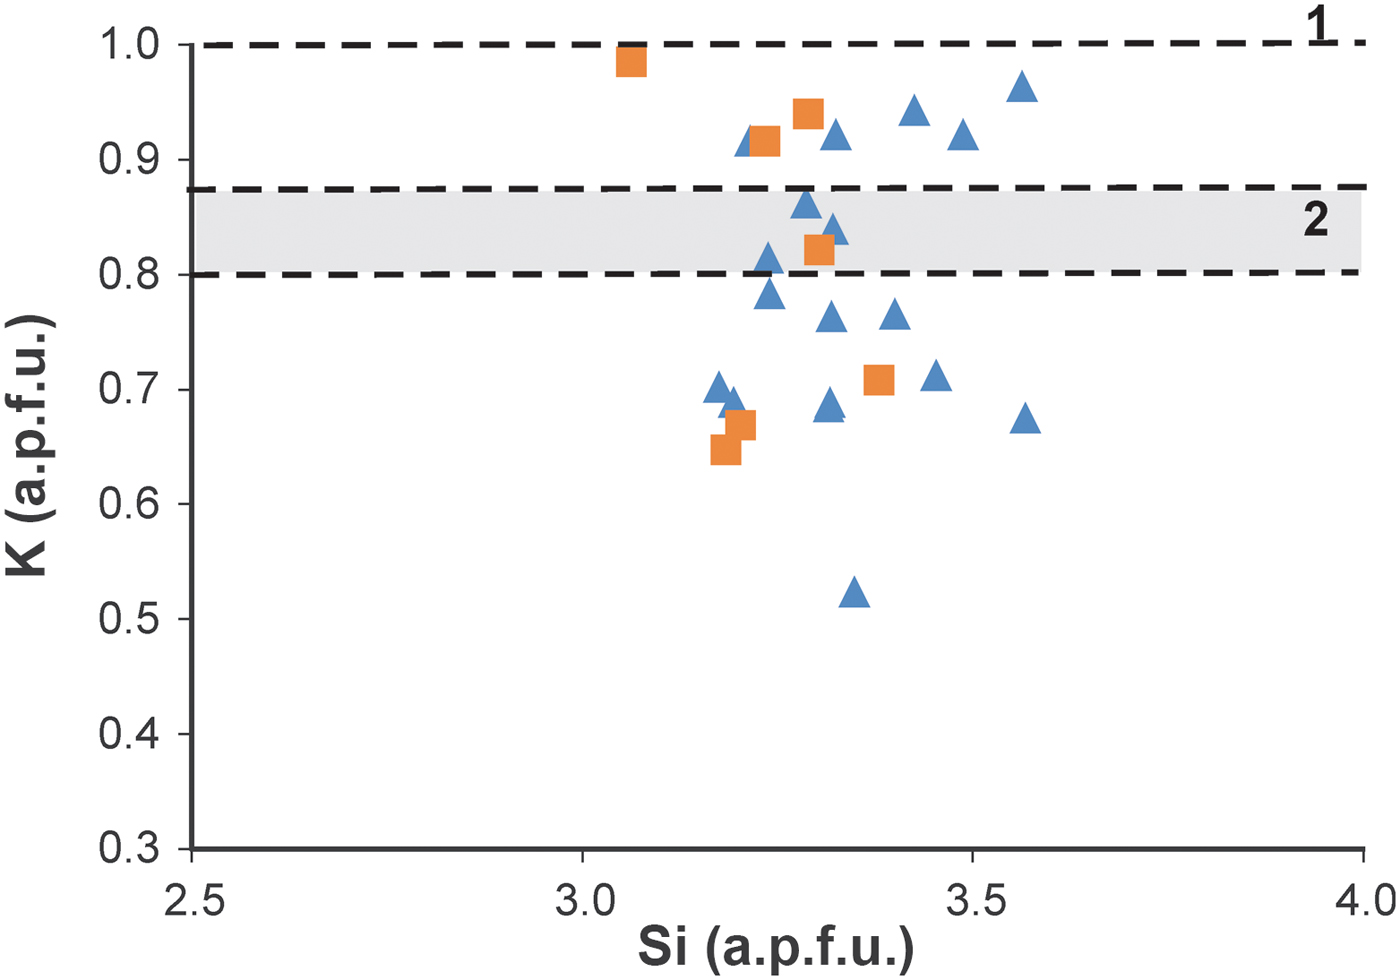
Fig. 7. Si vs. K graph showing AEM compositions of micas on single particles of sample ON-1). Triangles: original sample, squares: Sr-saturated sample. Line 1 corresponds to K content in pure K micas (d 001 = 9.99 Å) and zone 2 corresponds to K range in ammonium-bearing micas (d 001 > 10 Å) to compositions calculated from the two decomposed peaks in the mica 005 reflection (see Fig. 3) using the equations of Higashi (Reference Higashi2000) and Drits et al. (Reference Drits, Lindgreen and Salyn1997). Formulae were calculated on the basis of six tetrahedral + octahedral cations.
Dark field images (STEM) taken on lamellae that maintain the original texture of the shales show variable grey contrast along mica packets, suggesting that they do not have homogeneous compositions (Fig. 8a,b). The combination of AEM and EELS to analyse mica compositions allows us to confirm compositional variations in mica packets at the nanometer scale (Fig. 8c). The AEM analyses on 15 nm × 25 nm areas yielded variable K contents (0.08–0.64 K a.p.f.u) in the same packet. Some of the EELS spectra acquired show a weak N peak in the areas with low K contents; the presence of N in area number 5 in which the K content is 0.08 K a.p.f.u. is shown in Fig. 8. Nitrogen was always detected along with K.

Fig. 8. (a) Representative dark field image of a lamella in sample Checa-7. (b) Areas analysed on the lamella by EELS and AEM. (c) EELS spectrum showing a N peak from area number 5 and K contents (a.p.f.u.) detected by AEM on the analysed areas. Formulae were calculated on the basis of six tetrahedral + octahedral cations.
DISCUSSION
Conditions of formation
The black shales in the present study have similar textural characteristics and mineral paragenesis to other tobelitic shales (Juster et al., Reference Juster, Brown and Bailey1987; Daniels & Altaner, Reference Daniels and Altaner1990; Ward & Christie, Reference Ward and Christie1994; Šuchá et al., Reference Šuchá, Kraus and Madejová1994), except for the organic-matter content. It is assumed, therefore, that these rocks were formed by the generally accepted process in which NH4 comes from the thermal maturation of organic matter and subsequent migration of N2 present in the pelitic rock itself. The presence of mixed-layer I-S in sample Checa-7 is associated with a low-temperature hydrothermal alteration as suggested by Bauluz & Subias (Reference Bauluz and Subías2010); its complete absence from sample ON-1, which shows textural and chemical characteristics similar to the NH4-micas, suggests that the mixed-layer I-S is not related to the origin of the latter.
Ammonium contents
The combined use of XRD and IR confirmed the presence of micas with NH4 in their interlayers in the black shales analysed. Although the XRD patterns do not show a composite 001 mica reflection, the calculated d 00l spacings (from 003 and 005 reflections) suggest the presence of ammonium-bearing micas and pure K micas in both samples. The NH4 content deduced from the d 001 spacing depends on the equation used. According to the equation of Higashi (Reference Higashi2000) the NH4 content in the interlayer space of ON-1 and Checa-7 is 0.13 a.p.f.u. and 0.21 a.p.f.u. respectively, whereas according to the equation of Drits et al. (Reference Drits, Lindgreen and Salyn1997) the NH4 contents are 0.20 and 0.29 a.p.f.u., respectively. The IR spectrum of sample ON-1 yielded an NH4 occupancy of 0.27 a.p.f.u., suggesting that the XRD and IR methods are useful for detecting the presence of ammonium in mica interlayers and for giving an approach to the mean value of each sample. Differences in the NH4 content obtained from XRD and IR are probably due to the influence of other chemical variables on the d 00l spacing (Guidotti et al., Reference Guidotti, Mazzoli, Sassi and Blencoe1992; Nieto, Reference Nieto2002), and/or to the mixing effect of pure K micas on the IR data.
The HRTEM images show that both black shales have similar textures and similar ranges in size of the mica packets typical of an anchizonal grade. The TEM images also display the coexistence of ~10 Å layer packets and 10.2–10.3 Å layer packets suggesting the presence of ammonium interlayers, which in places, may produce some splits in 00l reflections in the SAED pattern. Stacking in mica is always characteristic of disordered polytypes (1M d). Finally, intergrowths among mica and I-S packets have been observed in Checa-7. However, the typical contrast of mixed-layer I-S in the mica crystals was not observed either in Checa-1 or in ON-1.
The K content of individual particles analysed in situ by AEM is shown in Fig. 7. These analyses contain indirect data on the NH4 content of various particles and show a significant scattering of data between 0.5–0.6 and 1.0 K a.p.f.u. This scattering is due to: (1) real differences in the NH4 content among individual packets, as was demonstrated by various spacings in the HRTEM images (Figs 5, 6) and differences in terms of contrast in dark field STEM images (Fig. 8a), produced by variable K contents (Fig. 8b); (2) mixing of the particles analysed of variable proportions of packets having lesser or greater K contents; (3) analytical uncertainty, which is expected to be significant, due in part to K loss during analysis. The K content varies continuously between 0.6 and 1 a.p.f.u., in apparent contradiction with the XRD results, which predict the existence of two populations of packets, NH4-free (d 001 = 9.98 Å) and NH4-bearing (d 001 = 10.05 Å). Nevertheless, reasons 2 and 3 would produce a significant scattering of the data corresponding to each population precluding the distinction of the two populations based on the AEM data of the particles.
Mica compositions
The composition of the micas analysed varies between crystals, but lies within the usual range of dioctahedral micas. Although some of this variability might be due to the AEM method, the heterogeneity in the chemical composition of minerals formed during diagenesis and very low-grade metamorphism is a well known fact (e.g. Li et al., Reference Li, Peacor, Merriman and Roberts1994; Merriman et al., Reference Merriman, Roberts, Peacor and Hirons1995; Dalla Torre et al.; Reference Dalla-Torre, Livi, Veblen and Frey1996; Nieto et al., Reference Nieto, Ortega-Huertas, Peacor and Arostegui1996; Livi et al., Reference Livi, Veblen, Ferry and Frey1997; Giorgetti et al., Reference Giorgetti, Memmi and Nieto1997).
The variations in K contents might also imply variation in the NH4 content. The dark-field images and the analyses on lamellae of mica packets reflect compositional variations at the nanometer scale, suggesting the existence of K-rich domains inside the packet and, comparatively NH4-richer domains in the same crystal. The small N contents in the micas analysed make it difficult to detect and measure by EELS and only weak N peaks were detected in some EELS spectra, in areas with low K contents. The fact that N was detected along with K suggests that there are, apparently, no pure NH4-domains within the mica crystals. Finally, the N and K are not distributed homogeneously in mica interlayers but are segregated into nanometre domains.
The K contents reported here (K ≥ 0.52 a.p.f.u.) from analyses on powdered samples, along with the XRD and IR data, suggest that there are pure K-micas, with d 001 = 9.98 Å and micas which contain K and NH4 in the interlayer with d 001 ≥ 10 Å, but they probably have larger K than NH4 contents on average. However, the existence of K-rich and K-poor domains of nanometer size inside the mica crystals reflects a segregation in the distribution of the K and NH4 in the interlayer.
Drits et al. (Reference Drits, Lindgreen and Salyn1997) noted that mixed-layer I-S in diagenetic shales from North Sea have differentiated K and NH4 end-member illite layers in the mixed-layer I-S. Nieto (Reference Nieto2002) reported that NH4- and K-dominated micas in low-grade temperature conditions have been segregated into well-separated packets with scarce intergrowths and almost no mixed layers.
In the very low-grade Silurian shales of the present study, segregation domains in the same mica packet, with variable proportions of K/NH4, might represent a previous, less evolved, stage than that reported by Nieto (Reference Nieto2002) for higher-temperature environments. This path is similar to the evolution of paragonite, margarite and muscovite (Livi et al., Reference Livi, Veblen, Ferry and Frey1997, Reference Livi, Christidis, Arkai and Veblen2008). Livi et al. (Reference Livi, Christidis, Arkai and Veblen2008) reported STEM images of (00 l) white mica planes with ordered domains of paragonite, margarite and muscovite within the basal plane; the domain boundaries may be sharp and structurally controlled or diffuse and irregular. A similar distribution model for tobelite and muscovite might occur in this study, with the mixture of domains of NH4-bearing micas and pure K-micas producing mixed intermediate compositions, similar to the widely described Na-K mica case. The relatively high K contents reported by AEM on powdered samples, indicate that the K-poorer packets also have higher K than NH4 contents; hence they are not tobelitic but NH4-bearing muscovitic packets, in agreement with the d 001 spacings and the IR spectra.
Therefore, the Sierra de Albarracín black shales are different from previously described cases of NH4-rich micas because of the absence of the tobelitic part of the compositional gap between tobelitic and muscovitic micas, described by Nieto (Reference Nieto2002). The compositions correspond to the muscovite part of the gap, perhaps motivated by a lower activity of the NH4 ion. Thus, the evolution of mica and tobellite during low-grade metamorphism might follow a path of metastable mixed compositions increasing in segregation with the increase of the metamorphic grade (Nieto Reference Nieto2002).
CONCLUSIONS
The combination of XRD, IR, TEM, AEM and EELS shows the presence of two populations of micas in the very-low grade black shales analysed from the Silurian in NE Spain. One population consists of pure K micas with 9.98 Å basal spacing and the other of NH4- and K-bearing micas with basal spacings >10 Å. Both types of micas show similar textures and crystal sizes characteristic of anchizone shales.
The ammonium and potassium micas have NH4 and K distributed heterogeneously in the interlayer, and they are segregated, forming nm-sized domains. The compositional and textural relationships between NH4 and K micas in the evolution of very low grade metamorphism reproduce the same trends previously described for Na, Ca and K micas.
ACKNOWLEDGEMENTS
This research has been funded by the Spanish Ministerio de Economía y Competitividad (CGL2013-46169-C2-1-P) and the Gobierno de Aragón and the European Social Fund (Grupo Consolidado, Recursos Minerales E45). The authors are grateful for comments and suggestions by two anonymous reviewers which significantly improved a previous version of the manuscript. The authors also acknowledge the use of the Servicio de Apoyo a la Investigación-SAI, University of Zaragoza (Spain) and the “Laboratorio de Microscopías Avanzadas” at Instituto de Nanociencia de Aragón-University of Zaragoza (Spain) for offering access to their instruments and expertise.


