


Introduction
Height has been used in several studies to assess variations in social and environmental factors of humans, such as education, access to health care, sanitary conditions, income level and social class (Silventoinen et al., Reference Silventoinen, Kaprio, Lahelma, Viken and Rose2001; Cardoso & Caninas, Reference Cardoso and Caninas2010; Blum, Reference Blum2014; Huang et al., Reference Huang, Van Poppel and Lumey2015; Krzyżanowska & Borysławski, Reference Krzyżanowska and Borysławski2015; Grasgruber et al., Reference Grasgruber, Sebera, Hrazdíra, Cacek and Kalina2016; Borrescio-Higa et al., Reference Borrescio-Higa, Bozzoli and Droller2019). It has been widely accepted that height can either increase or decrease in a given population, mainly depending on the scarcity or abundance experienced by those particular populations, thus communicating the overall outcome of a society’s state of development (Tanner, Reference Tanner and Demirjian1986). For example, height is often used to study the impact of living conditions during childhood, which, when adverse, can decrease adult height (Cole, Reference Cole2003). Additionally, changes in anthropometric dimensions emphasize health-related living conditions that traditional monetary indicators cannot entirely cover (Koepke et al., Reference Koepke, Floris, Pfister, Rühli and Staub2018).
There are several factors that are related to human growth, some of the most relevant being nutrition, exposure to infectious diseases and mother–child interaction (Cole, Reference Cole2000). Even though these relationships are complex in nature, they are often inter-dependent with other social variables, such as having more education, better jobs and better opportunities in general (Enjezab et al., Reference Enjezab, Farajzadegan, Taleghani, Aflatoonian, Enjezab, Farajzadegan and Taleghani2015; Wronka, Reference Wronka2015; Blackstone, Reference Blackstone2017; Kheirouri & Alizadeh, Reference Kheirouri and Alizadeh2017).
It is estimated that approximately 20% of human growth is driven by the cumulative net nutritional history of a population (Silventoinen, Reference Silventoinen2003; Deaton, Reference Deaton2007; Mcevoy & Visscher, Reference Mcevoy and Visscher2009); therefore, not only biological preconditions but also socioeconomic and cultural factors, including females’ situation in society, have to be taken into account to understand the mean height outcome of a population and the potential changes in health-related well-being (Koepke et al., Reference Koepke, Floris, Pfister, Rühli and Staub2018).
These changes over time in height and other variables across populations are called secular trends (Hauspie et al., Reference Hauspie, Vercauteren and Susanne1996). Secular trends in anthropometric dimensions, such as height, have been experienced by several populations (Hauspie et al., Reference Hauspie, Vercauteren and Susanne1996; Barroso et al., Reference Barroso, Arezes, da Costa and Sérgio Miguel2005; Arcaleni, Reference Arcaleni2006; Matton et al., Reference Matton, Duvigneaud, Wijndaele, Philippaerts, Duquet and Beunen2007; Webb et al., Reference Webb, Kuh, Pajak, Kubinova, Malyutina and Bobak2008; Baynouna et al., Reference Baynouna, Revel, Nagelkerke, Jaber, Omar and Ahmed2009; Cardoso & Caninas, Reference Cardoso and Caninas2010; Schwekendiek & Jun, Reference Schwekendiek and Jun2010; Tomkinson et al., Reference Tomkinson, Clark and Blanchonette2010; Bielecki et al., Reference Bielecki, Haas and Hulanicka2012; Dos Santos et al., Reference Dos Santos, Maia, Gomes, Daca, Madeira, Katzmarzyk and Prista2014). In the case of Chile, positive secular trends in height have been observed in school children (Castellucci et al., Reference Castellucci, Arezes, Molenbroek and Viviani2015) and the general population (Borrescio-Higa et al., Reference Borrescio-Higa, Bozzoli and Droller2019), where improvement in overall living conditions is the most likely cause. Secular changes have been shown to be associated with overall social well-being indicators, such as gross domestic product (GDP) per capita increments and child mortality decrements (Bozzoli et al., Reference Bozzoli, Deaton and Quintana-Domeque2007; Borrescio-Higa et al., Reference Borrescio-Higa, Bozzoli and Droller2019). Both indicators have accordingly improved in Chile; in fact, this country has experienced the worldwide trend of developed countries, whereby undernourishment has been replaced by obesity and a high prevalence of obesity-related chronic illnesses (Muzzo et al., Reference Muzzo, Burrows and Cordero2004).
In general, it is assumed that women are shorter than males and that their secular height increase is lower (Cole, Reference Cole2003). It is believed that genetics plays only a part in the overall growth of a person, since, for example, it has been observed that affluent children in developing countries grow similarly to those in developed countries (Cole, Reference Cole2000). Evolutionary theories (i.e. that males are taller to compete over fewer females) have also been questioned, since it has been suggested that other ecological factors can contribute more to height dimorphism, such as social gender equality and the behaviours of certain societies that have a larger impact on height differences between the sexes (Touraille, Reference Touraille and Ah-King2013). The impact of female living conditions on development and overcoming poverty in patriarchal societies has been recognized as highly relevant, as in these societies a potentially powerful reason for female discrimination is that investment in sons brings greater market returns (Strauss & Thomas, Reference Strauss, Thomas, Behram and Srinivasa1995), meaning that, for example, sending a male child to school or university will increase the chances of a family’s success (ComunidadMujer, 2018). Therefore, in some cases, even female physical work in the household is not considered as deserving particular food support (Koepke et al., Reference Koepke, Floris, Pfister, Rühli and Staub2018). Chile has experienced several changes in gender equality, starting in the last 20 years with an explicit policy of gender equality promotion that has been mainly mediated by the role of women’s organizations at the end of the military regime, which had the capacity to install in the public agenda the idea that real democracy was not possible without promoting gender equality at the same time (PNUD, 2010).
Height can also highlight inequality within a society, and it has been used to show that when there is a height divergence between different ethnic groups, there is probably an imbalance in living conditions (Uvin, Reference Uvin1999). Moreover, since health inequality variables are intrinsically essential (Deaton, Reference Deaton2003), where humans groups have particular and diverse characteristics that can impact health and well-being differently, so height dimorphism is a useful common outcome indicator to address those differences. As an outcome measure, mean height allows comparisons of different groups, such as between females and males (Koepke et al., Reference Koepke, Floris, Pfister, Rühli and Staub2018). Distribution of height is used as an approximate determinant of inequality where monetary measurements are hard to find or definitively do not exist, as this measure complements conventional inequality indicators. Final average height and height inequality reflect a birth cohort’s net nutritional intake during childhood and youth; hence, it is a primary indicator of the nutritional and health statuses of a population (Blum, Reference Blum2014), so average values give a clear illustration of well-being, while inequality measures highlight differences in living standards (Silventoinen, Reference Silventoinen2003; Blum, Reference Blum2014; Mark, Reference Mark2014). Conventional income data from earlier time periods and from developing countries are often weak in quality and low in availability – two reasons for the popularity of anthropometric data among economic historians and development economists – and while a correlation between income inequality and height inequality does exist, it is not perfect, since some important inputs to biological living standards such as public health measures, for example, are often financed by public funds or statutory insurance (Blum, Reference Blum2014). Height inequality captures important biological aspects of inequality and may lead to new insights while serving as a countercheck for conventional indicators (Blum, Reference Blum2014). Sexual height dimorphism has been used by many authors in order to address gender inequality and its expression through anthropometrics, since it can measure multiple contributions to the improvements in living conditions, both formal and informal (Smith, Reference Smith1999; Silventoinen et al., Reference Silventoinen, Kaprio, Lahelma, Viken and Rose2001; Silventoinen, Reference Silventoinen2003; Blum, Reference Blum2014; Mark, Reference Mark2014; Som et al., Reference Som, Ulijaszek, Pal, Bharati, Bharati and Som2014; Wronka, Reference Wronka2015).
Several indicators have been created to measure gender equality across nations, whereby some countries, such as Sweden, Finland and Denmark, often rank high, while others, such as Yemen, Afghanistan and Lesotho, rank low (Mark, Reference Mark2014). From a regional perspective, Latin America takes third place in gender parity (70.8%), after North America (72.5%) and Western Europe (75.8%) (WEF, 2018). Chile has experienced substantial improvements in its economy and overall living conditions in the last 30 years, with poverty rates famously decreasing and household income, school and higher education assistance rates increasing, together with having a fairly stable democratic system (PNUD, 2017). However, even though relevant development indicators of the country have improved, Chile is still a very unequal country, especially when considering gender differences in income, paid and formal work as well as financial independence (PNUD, 2010; ComunidadMujer, 2018; WEF, 2018).
The aim of this study was to analyse sexual height dimorphism across time in Chile based on four samples and to establish possible explanations for the differences using two dimensions, namely, gender equality and general welfare indicators.
Methods
Four samples were used. The data were published in 1974, 1990, 2012 and 2016. The first three corresponded to data from school populations and the latter from workers, all of them collected by independent research groups. All of the included samples were part of larger projects aiming to obtain anthropometric measurements, with a focus on health or ergonomics and design. They all obtained data through direct measurements performed by teams of two or three evaluators.
Samples
The 1974 sample was extracted from a study conducted in Santiago de Chile, with 1238 females and 1347 males aged 6–20 years, to obtain anthropometric data to assess growth and health (Avendaño et al., Reference Avendaño, Valenzuela, Patri, Cerda, Figueroa and Villalon1974). The average heights of those aged 17 and older were considered in the current study (n = 288; 144 males and 144 females). Little additional information useful for the current study was reported; however, regarding socioeconomic background, the authors reported that 32% of the females and 33% of the males had fathers whose occupation was an ‘employee’ and a mother who was a ‘housewife’. The rest of the groups fell into the ‘operator–housewife’ and ‘small business owner–housewife’ categories. No information on sampling strategies was provided. Specific average heights can be seen in detail in Table 1.
Table 1. Mean adult heights by birth year and corresponding sample
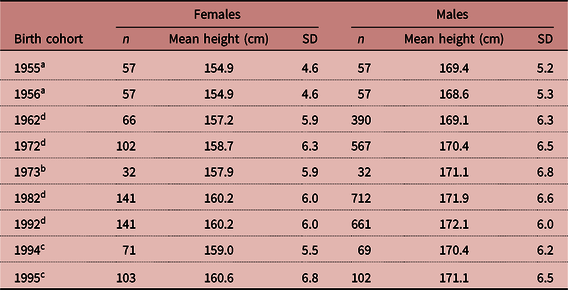
a Sample from 1974.
b Sample from 1990.
c Sample from 2012.
d Sample from 2016.
The 1990 sample consisted of a total of 842 participants (415 females and 427 males) aged between 6 and 18 years from the city of Concepción, with the aim of collecting child dimensions to design school furniture. In this study, the authors reported that 20% of the sample had a high socioeconomic status, 46% were of middle socioeconomic status and 34% were of lower socioeconomic status (Gutiérrez & Apud, Reference Gutiérrez and Apud1992). The average height of those aged 17 and older was considered in the current study (n = 64; 32 males and 32 females). It was reported that evaluators spent considerable time practising until measurements were consistent and followed a standardized procedure. Specific average heights can be seen in detail in Table 1.
The 2012 sample was a stratified representative sample of 1397 females and 1681 males with ages ranging from 5 to 19 years (11.7 ± 3.5) collected in the Valparaíso region for designing school furniture (Castellucci et al., Reference Castellucci, Arezes, Molenbroek and Viviani2015). The sample was composed of 26.5%, 63.2% and 10.3% of participants from low, medium and high socioeconomic backgrounds, respectively. The 2012 sample was collected by the authors of the current paper. The average height of the subjects who were between 17 and 18 years of age was used (n = 345; 171 males and 174 females). Evaluators spent considerable time practising until measurements were consistent and followed a standardized procedure. Specific average heights can be seen in detail in Table 1.
The 2016 sample was collected by the authors of this article as part of a larger research project and included the collection of a total of 32 anthropometric measures with a focus on ergonomics. Data were collected on 2946 workers (600 females and 2346 males) from two of the most populated regions of Chile (Valparaíso and Metropolitana) distributed across nine economic activity sectors (agriculture and fishing; mining; manufacturing; electricity; construction; commerce; transport and communications; financial services; and communal and personal services).
The measurement process was carried out by a team of six physiotherapists divided into two teams. Before starting the survey, the measurement teams underwent a one-week training session, including a theoretical approach to anthropometrics and practical instruction lectures. Specific average heights can be seen in detail in Table 1.
Statistical analysis
First, data corresponding to the average height of subjects aged 17 and above were extracted from the 1974, 1990 and 2012 samples. This was done since at those ages the subjects were probably closer to their definitive adult height; girls usually reach adult height when they are close to 15 years old and boys at 17 years (Susman & Rogol, Reference Susman, Rogol, Lerner and Steiberg2004; Papalia et al., Reference Papalia, Wendkos Old and Duskin Feldman2009). Although it varies among countries, the beginning of puberty and thus of the final growth spurt can be recognized as being initiated by menarche in girls and secondary sexual characteristics in boys and lasting for nearly 2 years (Cole, Reference Cole2000, Reference Cole2003; Wells, Reference Wells2012; Ezzati & NCD-RisC, Reference Ezzati2016). Chile has experienced a reduction in the age of puberty appearance, mainly due to improvements in living conditions, as it has been reported that well-nourished children from families with good socioeconomic conditions experience the growth spurt earlier than malnourished children from families with poor living conditions (Wronka, Reference Wronka2015). Most Chilean girls experience menarche at 13 years old and boys experience the appearance of secondary sexual characteristics at 15 years old (Valenzuela & Avendaño, Reference Valenzuela and Avendaño1979; Ivanovic & Ivanovic, Reference Ivanovic and Ivanovic1988; Burrows et al., Reference Burrows, Ceballos, Burgueño and Muzzo2010). These findings have been reported in other populations (Cole, Reference Cole2000, Reference Cole2003). Therefore, it could be considered that 17 years is the age when both girls and boys in Chile attain their definitive height. Therefore, 17 and above ages were used since that way the researchers could compare cohorts considering final adult height, not worrying that heights of a particular cohort varied significantly after it was measured. Sexual height dimorphism, as stated previously, can be attributed to multiple reasons, mainly due to the improvements experienced in nutrition, health, education and work, so female living conditions and corresponding potentialities are acknowledged as key issues for development and overcoming poverty (UNICEF, 2018a). Trends in overall well-being, measured by mean adult height, especially for females, can help to clarify the unprecedented increases in the standard of living and development in Chile (Koepke et al., Reference Koepke, Floris, Pfister, Rühli and Staub2018). Sexual height dimorphism (DIM) was calculated using the average heights of each age cohort according to the following formula, as used by Wells (Reference Wells2012):
 $${\rm DIM}=({\rm Height\ male} - {\rm Height\ female})/{\rm Height\ female} \times 100.$$
This allows percentage variation to be accounted for, using the male dimension as a reference. Each percentage of sexual dimorphism calculated was then plotted against the corresponding year of the birth of the sample in question. This was done for the 1974, 1990 and 2012 samples, since only age and the number of subjects (not individual data) were available for a particular birth cohort. In the case of the 2016 sample, for which age ranges were available together with individual data, the year corresponding to the middle point of the range was selected. For each of those years, gender inequality and overall society well-being indicators were retrieved from Chilean and international official documents and websites. In some cases, specific year indicators were not available; in those cases, the nearest year indicator was used (see Table 2).
Table 2. Data sources and technical considerations
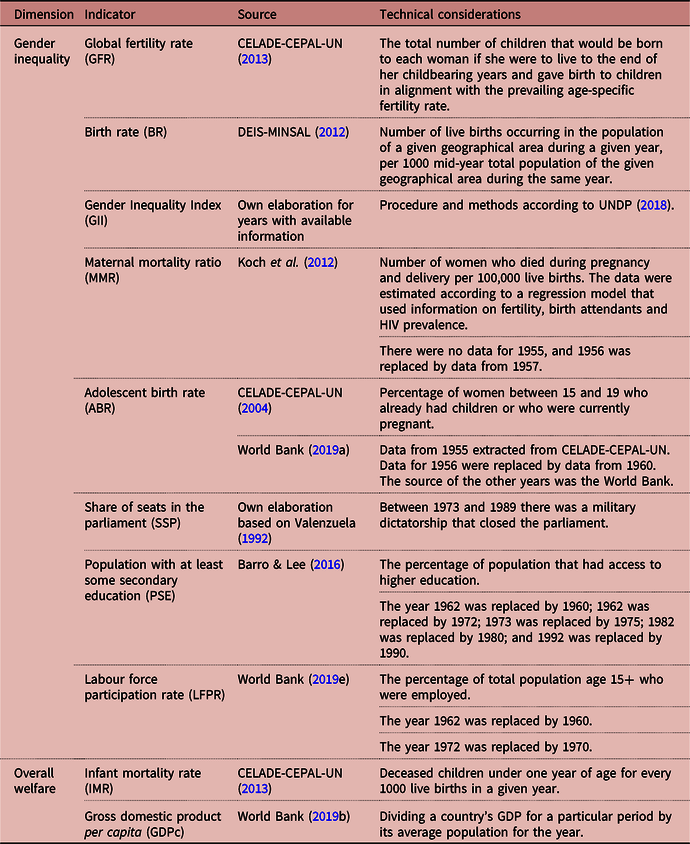
Global indicators of welfare, such as the infant mortality rate (IMR) and gross domestic product per capita (GDPc), were used to assess the association between sexual height dimorphism and changes in state welfare. Gender inequality indicators are quite recent; therefore, they are often not readily available, especially when looking further back in time, and the same occurs with women-specific information on work and education and other basic demographic information (Koepke et al., Reference Koepke, Floris, Pfister, Rühli and Staub2018). One of the latest indicators used is the Gender Inequality Index (GII). The GII considers several dimensions that account for gender inequality, such as the Maternal Mortality Ratio (MMR), Adolescent Birth Rate (ABR), share of seats in parliament (SSP), population with at least some secondary education (PSE) and the labour force participation rate (LFPR) (UNDP, 2018). The reproductive health dimension is an indexed value of maternal mortality ratios and adolescent fertility rates. The empowerment and labour market dimensions utilize the ratios of male to female parliament members, ratios of male to female population with at least secondary education, and the ratio of male to female labour force participation. In the case of PSE and LFPR, the net differences were calculated between female and male populations to assess net variations (DIFPSE and DIFLFPR, respectively), where positive values indicate a larger male participation and negative values indicate the opposite; thus, negative values convey more gender equality on the dimension. Index values range from 0 to 1, with lower values representing near-perfect gender equality and greater values representing greater levels of gender inequality (Mark, Reference Mark2014; UN, 2018). The GII was calculated for those years where the data were available. Since information was not available for all variables to calculate the GII, parts of the GII, together with similar available indicators such as global fertility rates (GFR) and the birth rate (BR), were also used. This choice was made because reproductive health is one of the main dimensions that make up the GII, since it can somehow account for women’s control over their bodies; it has been shown that in highly patriarchal societies women have more children due to a lack of empowerment (Mark, Reference Mark2014; Enjezab et al., Reference Enjezab, Farajzadegan, Taleghani, Aflatoonian, Enjezab, Farajzadegan and Taleghani2015) and the use of reproductive health services by women is a function of the availability of facilities and gendered inequalities that influence women’s access to social and economic resources, freedom of movement and decision-making power in matters that are significant to their well-being (Banda et al., Reference Banda, Odimegwu, Ntoimo and Muchiri2017).
Overall welfare indicators were IMR and GDPc, which have also been used to assess societies’ progress and have been associated with height variations (Bozzoli et al., Reference Bozzoli, Deaton and Quintana-Domeque2007; Borrescio-Higa et al., Reference Borrescio-Higa, Bozzoli and Droller2019). Additional details of the sources and technical notes on the indicators can be seen in Table 2.
After gender equality and welfare indicators were retrieved or calculated, a single point was determined for each of the years selected. Finally, Spearman’s correlation coefficients were used to compare sexual height dimorphism, gender inequality and the society’s overall welfare indicators. In some cases, the complete series for GII were not calculated because of missing information. In those cases, correlations were carried out with relevant subcomponents of the GII. Since only nine points across time were retrievable, the contribution of each point to the correlation was checked using a Bonferroni influence case analysis in order to check abnormal contributions of a particular data point (Fox & Weisberg, Reference Fox and Weisberg2011)
Results
Table 3 shows the values of the gender and well-being indicators by year. It was noted that indicators reflecting a reduction in gender inequality (MMR, ABR, SSPF, PSEF, DIFPSE, LFPRF, DIFLFPR, GII, BR, GFR) showed a tendency to decrease with time in Chile, showing an improvement in gender equality. The same can be observed for overall living conditions indicators, where GDPc has consistently increased and IMR has decreased since 1955. From Table 3, it is possible to note that sexual height dimorphism (DIM) decreased from 9.4% in 1955 to 6.5% in 1995, indicating an increase in average female height when compared with males.
Table 3. Gender indicators, general well-being indicators and sexual height dimorphism, Chile, 1955–1995
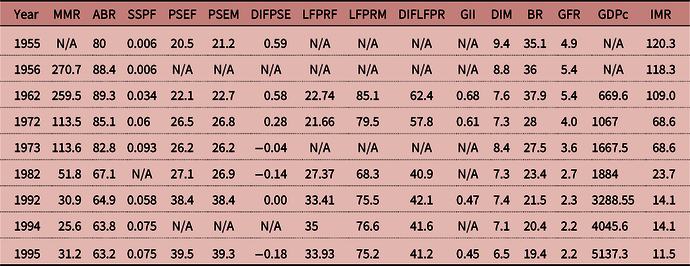
MMR: maternal mortality ratio; ABR: adolescent birth rate; SSPF: share of seats in parliament (% held by women); PSEF: population with at least some secondary education, female; PSEM: population with at least some secondary education, male; DIFPSE: difference between PSEM and PSEF; LPRFF: labour force participation rate, female; LPRFM: labour force participation rate, male; DIFLFPR: difference between LFPRM and LFPRF; GII: Gender Inequality Index; DIM: height dimorphism(%); BR: birth rate; GFR: global fertility rate; GDPc: gross domestic product per capita; IMR: infant mortality rate.
N/A: information not available.
Table 4 shows the results of the Spearman correlations. Sexual height dimorphism (DIM) was found to be statistically significantly correlated with MMR (moderately high: 0.7857; p < 0.05), ABR (moderately high 0.6667; p < 0.05), PSEF (strong: −0.8571; p < 0.05), BR (moderately high: 0.7833; p < 0.05), GFR (strong: 0.8167; p < 0.01) and IMR (strong: 0.8908; p < 0.01). All the previously mentioned variables were correlated at least at moderately high levels with height dimorphism. The net differences in DIFPSE (0.7500; p = 0.052) and DIFLFPR (0.7714; p = 0.07) showed moderately high correlations; however, the significance levels were barely above the limits. Table 4 shows that GDPc was positively correlated with indicators for which females improved their participation, such as SSPF (moderate: 0.5218; p < 0.05), PSEF (strong: 0.9429; p < 0.01) and LFPRF (0.8857; p < 0.05). GDPc was negatively correlated with indicators that experienced a decrease with time or a decrease in the gap, such as GII (strong: −1.0000; p < 0.01) and some of its components, such as ABR (strong: −1.000; p < 0.05), DIFPSE (strong: −0.8286; p < 0.05), DIFLFPR (moderately high: −0.6571; p < 0.05). GDPc also showed negative correlations with BR (strong: −1.0000; p < 0.01), GFR (strong: −1.0000; p < 0.01) and IMR (strong: −0.9820; p < 0.05). IMR showed similar patterns, with it being positively correlated with GII (strong: 1.0000; p < 0.01) and some of its components, such as MMR (strong: 0.9157; p < 0.01), ABR (strong: 0.8068; p < 0.01), DIFPSE (strong: 0.8649; p < 0.05) and DIFLFP (moderately high: 0.6377; p < 0.05). IMR also showed a positive correlation with BR (strong: 0.9244; p < 0.01) and GFR (strong: 0.9412; p < 0.01).
Table 4. Spearman’s correlation matrix
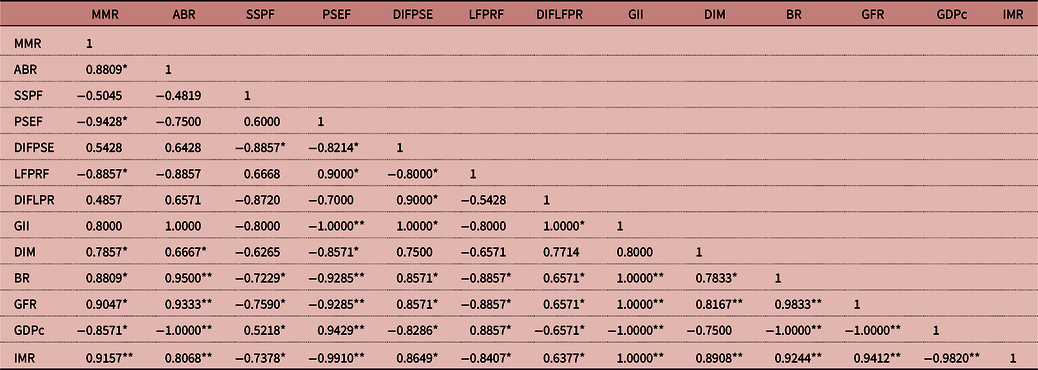
MMR: maternal mortality ratio; ABR: adolescent birth rate; SSPF: share of seats in parliament (% held by women); PSEF: population with at least some secondary education, female; DIFPSE: difference between PSEM and PSEF; LPRFF: labour force participation rate female; DIFLFPR: difference between LFPRM and LFPR; GII: Gender Inequality Index; DIM: height dimorphism; BR: birth rate; GFR: global fertility rate; GDPc: gross domestic product per capita; IMR: infant mortality rate.
*p < 0.05, **p < 0.01.
After the Bonferroni analysis, only one atypical observation was found, corresponding to SSPF in 1973. After removal of that value, a new Spearman correlation was calculated, indicating that SSPF was negatively correlated (strong: −0.9819805; p < 0.01) with height dimorphism. The overall results of the Bonferroni test are shown in Table 5.
Table 5. Bonferroni test results
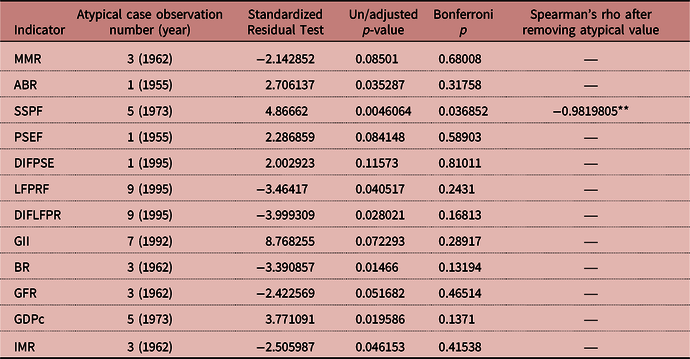
MMR: maternal mortality ratio; ABR: adolescent birth rate; SSPF: share of seats in parliament (% held by women); PSEF: population with at least some secondary education, female; DIFPSE: difference between PSEM and PSEF; LPRFF: labour force participation rate, female; DIFLFPR: difference between LFPRM and LFPRF; GII: Gender Inequality Index; DIM: height dimorphism (%); BR: birth rate; GFR: global fertility rate; GDPc: gross domestic product per capita; IMR: infant mortality rate. *p < 0.05; **p < 0.01.
Discussion
The Gender Inequality Index and height dimorphism
All of the gender equality indicators, except for GII, showed significant correlations with sexual height dimorphism. This finding is contrary to that of Mark (Reference Mark2014), who found that height variation in females for 96 nations was negatively correlated with GII. In the current paper, a lack of information did not allow the full series of GII to be calculated. Historical female information is often scarce, since very often even basic information is missing for the historical female population, as in general women used to live in an informal and invisible economy (Koepke et al., Reference Koepke, Floris, Pfister, Rühli and Staub2018). Although the GII was not correlated with sexual height dimorphism, all the other variables were correlated in the expected way; therefore, the findings suggest that given the information available, gender equality could provide an explanation for the reduction in sexual height dimorphism observed in the study samples. In the case of Mark (Reference Mark2014), regarding the relationships between female height variance and other general- and gender-specific indicators, after factor analysis, it was found that the variance in height was best defined by loading for gender inequality.
Other research has suggested that gender equality is a predictor of height for both males and females (Lippa, Reference Lippa2009). In the current study, other health-related indicators, such as the maternal mortality rate, adolescent birth rate, birth rate and global fertility rate, behaved accordingly, with a reduction in sexual height dimorphism, indicating that in Chile, gender inequality reduction is most likely to be a major cause of the reduction in sexual height dimorphism. It is worth mentioning that the sexual height dimorphism and gender-specific health indicator gap reduction is a net one, meaning that it does not depend on the improvements associated with the male population but only with the female population, thus providing more arguments for gender equality on this dimension.
Height dimorphism and women’s health indicators
The results show that height dimorphism experienced a reduction in the studied samples. All variables that were significantly correlated with height dimorphism behaved in the expected way. For example, all of the women’s health-related dimensions that somehow account for gender equality, such as the maternal mortality rate, adolescent birth rate, birth rate and the global fertility rate, all showed positive significant correlations with height dimorphism (at least at moderate and high levels). These results were expected, since gender inequality is often seen in places where women die in pregnancy (or soon after) or where they become mothers earlier and have more children, reflecting less control over their bodies and less access to health and contraception (Blackstone, Reference Blackstone2017; Kheirouri & Alizadeh, Reference Kheirouri and Alizadeh2017; Morgan et al., Reference Morgan, Tetui, Kananura, Ekirapa-Kiracho and George2017).
Women and adolescent girls of reproductive age experience a complex relationship between gender inequality, poverty, pregnancy and childbirth that can expose them to increased risk during childbearing (UNICEF, 2018b). A lack of autonomy to make decisions about one’s own health care, low levels of education circumscribing the ability to make informed health care decisions, limited control over financial resources and other factors make it difficult for women to receive the quality care needed for healthy pregnancies and deliveries (WHO, 2014, 2018; UNICEF, 2018b). In fact, the United Nations Human Rights Council has stated that maternal mortality and, similarly, women’s adverse reproductive health outcomes are a reflection of gender inequality (UNHRC, 2011). Latin America has experienced a significant reduction in MMR, from 135 maternal deaths per 100,000 live births in women aged 15–49 in 1990 to 68 deaths per 100,000 live births in 2015 (UNICEF, 2018b). In the current study, it is likely that height dimorphism reduction was related to a greater increase in gender equality, as represented by reproductive health and associated decision-making. In the case of Chile, for example, the MMR decreased from 270.7 in 1956 to 22.8 in 2015 (DEIS-MINSAL, 2019a), the birth rate dropped from 35.1 per 1000 to 12.8 for every 1000 in 2016 (DEIS-MINSAL, 2019b), and the GFR experienced a dramatic decrease, whereby Chilean women had on average 1.7 children in 2016 versus 5.0 children in 1955, showing that the overall trend was quite close to developed countries such as Finland – the country that has consistently scored better on gender equality indicators (World Bank, 2019f).
Height dimorphism and education
The study found that height and sexual dimorphism were negatively correlated with the percentage of population that had access to secondary education (PSEF female), meaning that the height difference between females and males decreased when more women attended high school. The differences between male and female participation in secondary education (DIFPSE) showed a correlation but barely above significance levels (p = 0.052).
Women in developed countries usually postpone childbearing to pursue higher education and work, reflecting more independence and gender equality when compared with countries where the opposite happens (UNICEF, 2018b). Education is a dimension on which Chile has experienced great improvements: for example, an increase in net assistance rates for secondary education in the last two decades, especially for females, where female adolescents had 61.4% and male adolescents 58.5% net assistance rates in 1990, up to 74.8% and 71% in 2015, respectively (ComunidadMujer, 2018). Higher education has experienced even more dramatic improvements, with net assistance rates from 1990 to 2015 ranging from 10.9% to 39.1% for females and from 13.3% to 36.3% for males (ComunidadMujer, 2018). This reduction in the education gender gap is a worldwide trend, even though in many countries 39.0% of women are still illiterate (WEF, 2018). It is known that better education, especially for women, has an impact on them and their offspring (Osmani & Sen, Reference Osmani and Sen2003; Maurer, Reference Maurer2010; Enjezab et al., Reference Enjezab, Farajzadegan, Taleghani, Aflatoonian, Enjezab, Farajzadegan and Taleghani2015; Blackstone, Reference Blackstone2017), thus affecting biological factors such as height through a ‘health dynasty’ transmitted from one generation to another (Silventoinen, Reference Silventoinen2003; Oxley, Reference Oxley, Komlos and Kelly2016). The findings of the current study also show a similar correlation pattern between education and female height obtained by previous studies (Mark, Reference Mark2014; Koepke et al., Reference Koepke, Floris, Pfister, Rühli and Staub2018), thus indicating that female average height is increasing and sexual height dimorphism is decreasing.
Height dimorphism, work and parliament seats
The share of seats in parliament of females (SSPF), after the Bonferroni analysis, showed a strong negative correlation with sexual height dimorphism. This was also no surprise, since gender equality usually translates into having more women in parliament seats and managerial positions (WEF, 2018). The labour force participation of females (LPRFF) and the differences compared with males (DIFLFPR) showed a correlation but not within significance limits. This could be due to the many missing historical data points. However, it is worth noting that rates of inactive working age women in Chile have decreased, while male rates have been sustained. For example, women experienced a labour participation increase from 37.4% in 1990 to 56.6% in 2015, while male participation rates remained relatively constant, ranging from 80.6% to 79.7% from 1990 to 2015 (World Bank, 2019c, d). Despite the improvements, this shows quite a low participation rate, being one of the lowest among OECD countries (INE, 2015).
The reasons why women are still significantly kept away from the work market in Chile have to do with the fact that often women assume non-paid or informal work, mainly assuming unpaid domestic work. In the case of Chile, despite a reduction from 85.7% in 1990 to 54.7% in 2015, women still state that the reason for not working is related to domestic work and caring for others (INE, 2015; ComunidadMujer, 2018). In fact, Chilean girls aged between 5 and 17 years still spend 50% or more of their time doing domestic chores than boys of the same age (MINDES-MINTRAB-ILO, 2013). These reasons have also been reported by other authors, who have found that girls perform more work than boys at home, both in terms of chores and caring for relatives (UNICEF, 2016, 2017; Koepke et al., Reference Koepke, Floris, Pfister, Rühli and Staub2018). This is a worldwide situation, whereby girls aged 5–9 years and 10–14 years spend 30% and 50% more of their time, respectively, on household chores than boys of the same age (UNICEF, 2018a); thus, patriarchal influences start from a very young age for girls. Women, and especially girls, are more hindered by the time spent on chores, since it stops them from essential development activities such as having time to play, building social networks and focusing on their education, thus reflecting gender inequality that may affect their physical and cognitive development (UNICEF, 2016). Work and parliament share of seats are areas where Chile still has to catch up regarding gender equality, and the legislative power is currently discussing policies to address these areas. Progress in this area, similar to health-related areas, is a net improvement, showing a convergence towards more gender equality.
Height dimorphism and general welfare indicators
Regarding general welfare indicators, the only one that had a strong correlation with sexual height dimorphism was infant mortality rate (IMR). Gross domestic product per capita (GDPc) showed a strong correlation; however, the significance level was barely above the limits (p = 0.052). This finding regarding GDPc and height has been found in previous studies, where the contribution of GDPc to height variation was not significant but IMR was (Bozzoli et al., Reference Bozzoli, Deaton and Quintana-Domeque2007; Borrescio-Higa et al., Reference Borrescio-Higa, Bozzoli and Droller2019). Despite this fact, GDPc showed significant negative correlations with GII and some of its components, such as MMR and ABR, and also had significant negative correlations with the differences found in secondary education (DIFPSE), labour participation rates (DIFLFPR), birth rate, global fertility rate and infant mortality rate. GDPc showed positive correlations with female parliament representation (SSPF), secondary education (PSEF) and labour participation (LFPRF). The infant mortality rate showed similar patterns, as it was positively correlated with GII and some of its components, such as the maternal mortality rate, adolescent birth rate and DIFPSE and DIFLFP, which also showed positive correlations with the birth rate and global fertility rate. The previously stated patterns could suggest a closer relationship between gender equality and child health indicators in Chile with GDPc, but not with height, which has been observed in other studies (Silventoinen, Reference Silventoinen2003; Bozzoli et al., Reference Bozzoli, Deaton and Quintana-Domeque2007; Mark, Reference Mark2014).
Both the infant mortality rate and GDPc have experienced significant improvements in Chile. In fact, the GDPc increase has led to Chile recently being labelled as a high-income economy by the World Bank (World Bank, 2018a). The infant mortality rate has decreased dramatically since 1955 from 120.3 to 11.5 (DEIS-MINSAL, 2019b) in 1995, while GDPc has increased from 669.6 US$ in 1962 to 5137.3 US$ in 1995 (World Bank, 2018a). In the case of Chile, the infant mortality rate has been mainly reduced through efforts focusing on free perinatal health services for women bearing children and supplementary food and milk programmes directed at women and children, even during the 1973–1989 period when democracy was interrupted (Borrescio-Higa et al., Reference Borrescio-Higa, Bozzoli and Droller2019). These state-wide efforts, mainly focused on women and their relationship with their offspring, probably translated into a reduction in gender inequalities, especially by providing childbearing mothers with free, high-quality health care and nutrition, which have been pinpointed together with education as fundamental pillars of gender equality (UNICEF, 2017), thus possibly explaining why the maternal mortality rate, adolescent birth rate, birth rate and global fertility rate were more strongly related than GDPc to height dimorphism.
Chile: height and gender equality overview
Chile has experienced great improvements in gender equality: it was ranked 54 of 159 countries in 2018 in terms of the Global Gender Gap and has reportedly closed 72% of its gender gap (WEF, 2018). Despite this progress, significant gender inequalities still persist in Chile, especially regarding paid employment (ComunidadMujer, 2018; WEF, 2018). Women face several challenges from when they are young girls that boys of the same age do not. This is mainly due to cultural norms that discriminate or clearly harm girls. For example, female infanticide and preference for males in terms of food and medical care have resulted in 50 million females being absent from India alone (Mark, Reference Mark2014), while other practices such as genital mutilation and child marriage focus on girls (UNHRC, 2011; Mark, Reference Mark2014; UNICEF, 2016, 2017).
Luckily, these practices do not occur in Chile, but discriminatory practices and education have been present, since it was common for females born before the 1960s not to finish secondary education or to have to ask permission to attend university; it was assumed that they would be housewives and be financially supported by a husband, hindering any chance of development and independence (ComunidadMujer, 2018). Currently, women in Chile have higher labour participation rates than ever before and have actually surpassed male participation in higher education. However, they still perform the majority of the housework and study for service-related careers and are under-represented in engineering and science subjects (Arzola, Reference Arzola2011; Álvarez, Reference Álvarez2015; ComunidadMujer, 2018).
The relationship between mothers and their children, together with nutrition and health, has a relevant impact on overall well-being, whereby mothers who have a stronger bond with their children tend to have healthier outcomes and taller children (Cole, Reference Cole2000). Similarly, increases in mother’s height have been associated with a lower risk of poor child health (Bhalotra & Rawlings, Reference Bhalotra and Rawlings2011). Deaton (Reference Deaton2009) found that in India, where gender inequality has significantly higher indicators, height dimorphism has increased in some cohorts, attributing the finding to ‘a differential access to whatever improvements there have been in health or food or both’. Other authors have found a positive secular trend in Indian girls’ height, most likely stemming from improvements in living conditions such as nutrition and access to health care among women and girls (Agarwal et al., Reference Agarwal, Agarwal, Upadhyay, Mittal, Prakash and Rai1992). Therefore, it is possible that higher height dimorphism in the older cohorts of the current study is related to gender inequalities, since it has been observed that differential access to education, health and other welfare benefits can lead to height variations within the same group, especially in developing countries (Som et al., Reference Som, Ulijaszek, Pal, Bharati, Bharati and Som2014) such as Chile in the years before 1990. Africa is the one exception: despite the poverty and adverse situation of women, they are actually taller than older cohorts; however, this has been attributed to a likely mortality selection favouring taller women (Deaton, Reference Deaton2007). In the current study, birth year was considered the criterion for analysing the data since growth is considered cumulative during the first 2 years of an individual’s life; therefore, the birth year can be considered a proxy for a starting point in height gain (Tanner, Reference Tanner and Demirjian1986, Reference Tanner1992; Cole, Reference Cole2000, Reference Cole2003).
As shown in Figure 1, the GII shows a clear trend of gender inequality reduction in Chile; therefore, it would be interesting to compare height dimorphism using data from Chileans exposed to higher gender equality. In 2018, empowered by the #metoo movement, Chile experienced massive social movements demanding more gender equality policies, especially in education and work dimensions (Ruiz & Miranda, Reference Ruiz and Miranda2018; Salvo, Reference Salvo2018). Further research could examine height dimorphism, especially in cohorts born after 2011, when the government funded paid maternal leave for all employed women.
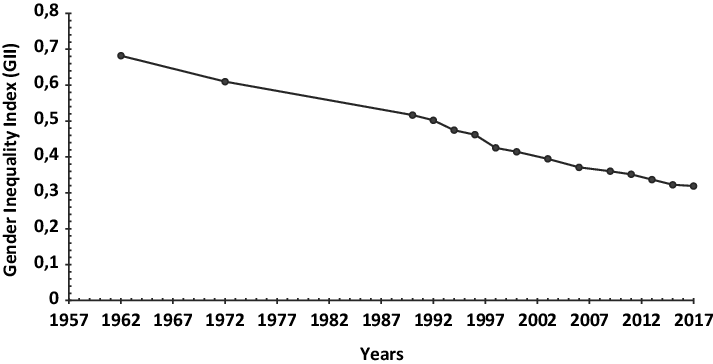
Figure 1. Gender Inequality Index for Chile, 1962–2017.
Study limitations
The limitations of the current study include the lack of basic historical female data. It is worth remembering that Chile was under a military regime from 1973 to 1989; therefore, some indicators prior to 1989 were not available (Ruiz & Boccardo, Reference Ruiz and Boccardo2014). Even during democratic periods, information was not available, showing that historically Chile did not address females and their basic demographic data thoroughly, similar to what was found by Koepke et al. (Reference Koepke, Floris, Pfister, Rühli and Staub2018). The unavailability of raw data did not allow a more in-depth causal analysis to be performed, but the averages used apparently showed a small sample, with each of the data points corresponding to 3.076 observations. Since correlation models were used, causation could not be attributed to a particular variable; however, the relationships and historical data collected suggests that a relationship is highly probable. On the other hand, a strength of the current study was its use of directly measured dimensions by trained health professionals following a standardized protocol that ensured a high quality of data, and that was also more reliable than self-reported measures (Viviani et al., Reference Viviani, Arezes, Bragança, Molenbroek, Dianat and Castellucci2018).
Conclusion
Gender equality has improved significantly in Chile, even though some gender differences are still present. The current study found a reduction in the gap between female and male heights that was correlated with a reduction in gender inequality. Women’s reproductive health indicators, education and child mortality rate were found to be correlated with sexual dimorphism. The GDP per capita did not show significant differences. Generally, variation in mean height is a proxy for changing environmental conditions affecting growth and, therefore, final height attainment. Accordingly, it seems that sexual height dimorphism can be used to complement the assessment of gender equality in a way that some well-being global indicators may not consider, highlighting more clearly gender inequalities (Uvin, Reference Uvin1999; Koepke et al., Reference Koepke, Floris, Pfister, Rühli and Staub2018).
Funding
This work was supported by the Mutual de Seguridad C.Ch. C en el marco del fondo ‘Proyectos de Investigación e Innovación SUSESO’, ‘Trabajo fue seleccionado en la Convocatoria de Proyectos de Investigación e Innovación de Prevención de Accidentes y Enfermedades Profesionales “2015” de la Superintendencia de Seguridad Social (Chile), financiado por “Mutual de Seguridad la C.Ch. C” con recursos del Seguro Social de la Ley N°16.744 de Accidentes del Trabajo y Enfermedades Profesionales. It was also supported by the Fondo Nacional de Investigación y Desarrollo en Salud (FONIS) No. SA11I2105, Gobierno de Chile (National Fund for Health Research and Development, Chilean Government).
Conflicts of Interest
The authors have no conflicts of interest to declare.
Ethical Approval
The data collection process was approved by the Committee of Ethics of the Chilean Construction Chamber (Camara Chilena de la Construcción, 2015). The authors assert that all procedures contributing to this work comply with the ethical standards of the relevant national and institutional committees on human experimentation and with the Helsinki Declaration of 1975, as revised in 2008.


