


1. Introduction
Frictional behaviour represents the dominant deformation style in upper crustal basement rocks including a variety of deformation processes (e.g. Handy et al. Reference Handy, Hirth and Hovius2007; Faulkner et al. Reference Faulkner, Jackson, Lunn, Schlische, Shipton, Wibberley and Withjack2010; Cox, Reference Cox2010; Fossen & Cavalcante, Reference Fossen and Cavalcante2017 and literature therein). In this light, faults have been investigated in terms of their bulk mechanical behaviour using experiments and studies on natural examples (e.g. Bos & Spiers, Reference Bos and Spiers2000; Storti et al. Reference Storti, Billi and Salvini2003; Tenthorey et al. Reference Tenthorey, Cox and Todd2003; Nakatan & Scholz, Reference Nakatan and Scholz2004; Niemeijer & Spiers, Reference Niemeijer and Spiers2006; Tenthorey & Cox, Reference Tenthorey and Cox2006; Keulen et al. Reference Keulen, Heilbronner, Stunitz, Boullier and Ito2007, Reference Keulen, Stünitz and Heilbronner2008; Caine et al. Reference Caine, Bruhn and Forster2010; Niemeijer et al. Reference Niemeijer, Marone and Elsworth2010). To understand the deformational behaviour of bulk aggregates, knowledge on the effect of local microstructural processes and their changes in space and time is required. In particular, local variations in the type of deformation and associated tectonites will influence fluid flow, dissolution, mass transfer and healing (precipitation). Numerous studies have demonstrated losses in host rock strengths by progressive embrittlement, leading to grain-size reduction and dilatation, which enhances permeability and promotes local dissolution and mineral precipitation (e.g. Chester & Logan, Reference Chester and Logan1986; Bruhn et al. Reference Bruhn, Parry, Yonkee and Thompson1994; Evans & Chester, Reference Evans and Chester1995; Caine et al. Reference Caine, Evans and Forster1996, Reference Caine, Bruhn and Forster2010; Evans et al. Reference Evans, Forster and Goddard1997; Keulen et al. Reference Keulen, Heilbronner, Stunitz, Boullier and Ito2007, Reference Keulen, Stünitz and Heilbronner2008; Micklethwaite, Reference Micklethwaite2009; Niemeijer et al. Reference Niemeijer, Marone and Elsworth2010, Stünitz et al. Reference Stünitz, Keulen, Hirose and Heilbronner2010; Hausegger & Kurz, Reference Hausegger and Kurz2013; Melosh et al. Reference Melosh, Rowe, Smit, Groenewald, Lambert and Macey2014, Reference Melosh, Rowe, Gerbi, Bate and Shulman2016; Carpenter et al. Reference Carpenter, Ikari and Marone2016; Rowe et al. Reference Rowe, Lamothe, Rempe, Andrews, Mitchell, Di Toro and White2019; Hooker & Fisher, Reference Hooker and Fisher2021; Williams et al. Reference Williams, Rowe, Okamoto, Savage and Eves2021). As a consequence of the latter, the strength of the fault rocks increases again, requiring a new stage of embrittlement for further progressive deformation. Such healing–deformation cycles are of particular importance for the change between fast fracturing processes versus slow cataclastic flow (e.g. Micklethwaite & Cox, Reference Micklethwaite and Cox2004; Cox et al. Reference Cox, Ikari, MacLeod and Fagereng2021). Healing/cementation processes and their effect on permeability/compaction have been intensely investigated in the case of sedimentary rocks undergoing diagenesis (Laubach et al. Reference Laubach, Eichhubl, Hilgers and Lander2010 and literature therein), and several examples in continental basement rocks (e.g. Kerrich et al. Reference Kerrich, Allison, Barnett, Moss and Starkey1980; Evans & Chester, Reference Evans and Chester1995; Williams et al. Reference Williams, Rowe, Okamoto, Savage and Eves2021). In this study we aim to close this gap by investigating granitoid host rocks undergoing brittle deformation within a hydrothermal environment.
The investigations on these brittlely deformed fault rocks require application of a field-based nomenclature (e.g. Sibson, Reference Sibson1977; White, Reference White1982; Wise et al. Reference Wise, Dunn, Engelder, Geiser, Hatcher, Kish, Odom and Schamel1984; Chester et al. Reference Chester, Friedman and Logan1985; Schmid & Handy, Reference Schmid, Handy, Müller, McKenzie and Weissert1991; Jebrak, Reference Jebrak1997; Woodcock & Mort, Reference Woodcock and Mort2008; Rowe & Griffith, Reference Rowe and Griffith2015). Depending on the degree of deformation and the amount of matrix and embedded clasts, expressed as volumetric ratio, cohesive fault rocks are discriminated into breccias and (proto- to ultra-)cataclasites, while non-cohesive fine-grained fault rocks are often referred to as fault-gouge (e.g. Sibson, Reference Sibson1977; Schmid & Handy, Reference Schmid, Handy, Müller, McKenzie and Weissert1991). Additionally, clast-size-dependencies, such as ‘small’ and ‘large’, have been used to further discriminate and categorize fault rocks in the field (Woodcock & Mort, Reference Woodcock and Mort2008; Luther et al. Reference Luther, Axen and Selverstone2013). Special cases of fault-related rocks are cockade-bearing tectonites (e.g. Berger & Herwegh, Reference Berger and Herwegh2019; Masoch et al. Reference Masoch, Fondriest, Preto, Secco and Di Toro2019). In examples of cockade cores completely surrounded in 3D by concentric hydrothermal growth zonation, the aforementioned studies connected the cockade growth to earthquakes. It is important to note that this tectonite type requires large fluid volumes and precipitation that form these characteristic hydrothermal growth textures.
In this study, we particularly focus on highly deformed brittle fault rocks, i.e. cataclasites, and discuss the role of different processes involved during their formation. We connect deformation microstructures to their chemical evolution. The clast microstructures are quantified in terms of particle size distribution (PSD: e.g. Sammis et al. Reference Sammis, Osborne, Lawford-Anderson, Banerdt and White1986, Reference Sammis, King and Biegel1987; Turcotte, Reference Turcotte1986; Heilbronner & Keulen, Reference Heilbronner and Keulen2006). In addition, the chemical variations between the different fault rocks are investigated in order to quantify the role of mass transfer. The link between microstructural observations and chemical data is of special interest for the investigated Grimselpass fault zone, because cataclasites are closely linked to the occurrence of cockade-bearing tectonites, the latter representing evidences for seismic rupturing (Berger & Herwegh, Reference Berger and Herwegh2019).
2. Geological setting
We investigate the Grimsel breccia fault (GBF; Fig. 1), a brittle structure within the several tens of km long crustal-scale Grimselpass fault zone (Belgrano et al. Reference Belgrano, Berger and Herwegh2016; Wehrens et al. Reference Wehrens, Berger, Peters, Spillmann and Herwegh2016, Reference Wehrens, Baumberger, Berger and Herwegh2017; Herwegh et al. Reference Herwegh, Kissling, Baumberger, Berger, Wangenheim, Wehrens, Glotzbach and Mock2020). Deformation of the Grimselpass fault zone localized along the lithological boundaries of the Grimsel Granodiorite in the north block and the Southwestern Aar Granite in the south block, sandwiching locally in between the Grimsel zone (gneisses, granitoids and meta-sediments) (Fig. 1; Stalder, Reference Stalder1964; Niggli, unpubl. PhD thesis, Univ. Bern, 1965; Pfeifer et al. Reference Pfeifer, Sanchez, Degueldre, Kharaka and Maest1992; A Pochon, unpub. Diploma thesis, Univ. Neuchâtel, 1997; Hofmann et al. Reference Hofmann, Helfer, Diamond, Villa, Frei and Eikenberg2004; Belgrano et al. Reference Belgrano, Berger and Herwegh2016; Egli et al. Reference Egli, Baumann, Küng, Berger, Baron and Herwegh2018). The nowadays exhumed parts of the Grimselpass fault zone and its sub-recent brittle reactivation evolved over a timespan of more than 20 Ma under different kinematic regimes and at different crustal levels. The initial shear zones evolved under dominantly ductile deformation conditions at depths of c. 20 km and temperatures of 450 °C. However, they show already at that crustal level evidences for intercalation of aseismic and seismic deformation (Wehrens et al. Reference Wehrens, Berger, Peters, Spillmann and Herwegh2016). Exhumation, progressive cooling and embrittlement of the fault zone yielded strong strain localization in the form of the GBF, a brittle strand within the wider former Grimselpass shear zone. This fault zone differs from other brittle structures in the area by its distinctive, long-lived hydrothermal activity, and still active sub-thermal water flow (Hofmann et al. Reference Hofmann, Helfer, Diamond, Villa, Frei and Eikenberg2004; Rolland et al. Reference Rolland, Cox and Corsini2009; Belgrano et al. Reference Belgrano, Berger and Herwegh2016; Wehrens et al. Reference Wehrens, Berger, Peters, Spillmann and Herwegh2016, Reference Wehrens, Baumberger, Berger and Herwegh2017; Diamond et al. Reference Diamond, Wanner and Waber2018). In this study, we mainly investigated cataclasites, which are located inside the Southwestern Aare Granite. In addition, shear fractures with different offsets and tensile fractures are numerous (Belgrano et al. Reference Belgrano, Berger and Herwegh2016; Egli et al. Reference Egli, Baumann, Küng, Berger, Baron and Herwegh2018). The rare kinematic indicators of the brittle deformation indicate dextral strike-slip fault kinematics (Belgrano et al. Reference Belgrano, Berger and Herwegh2016), which is in line with the regionally observed dextral transpression along the rim of the Southern Central to Western Aar Massif (Herwegh et al. Reference Herwegh, Kissling, Baumberger, Berger, Wangenheim, Wehrens, Glotzbach and Mock2020). In terms of fault zone architecture, linkage zones and structural bridges occur on different scales (mm to hundreds of metres), playing an important role for both deformation and hydrothermal fluid flux (Belgrano et al. Reference Belgrano, Berger and Herwegh2016).

Fig. 1. Geological situation of the Grimsel area. (a) Overview of the geological setting in the central southern Aar Massif; (b) geological map of the Grimsel breccia fault; (c) detail of the Sidelhorn linkage zone; (d) tectonic cross-section through the Grimsel breccia fault in the Totensee area (see (b) for section trace); (e) hillshade of the Totenssee area (www.map.geo.admin.ch: Federal Office of Topography swisstopo) with the location of the drillhole trace and locations of most of the used samples (after Belgrano et al. Reference Belgrano, Berger and Herwegh2016; Berger et al. Reference Berger, Mercolli, Herwegh and Gnos2016; Wehrens et al. Reference Wehrens, Baumberger, Berger and Herwegh2017; Egli et al. Reference Egli, Baumann, Küng, Berger, Baron and Herwegh2018).
On the metre- to kilometre scale, the GBF and its ductile precursor shear zone strands have been mapped in detail (Fig. 1; Belgrano et al. Reference Belgrano, Berger and Herwegh2016; Wehrens et al. Reference Wehrens, Baumberger, Berger and Herwegh2017). In terms of field appearance, the GBF can be divided into core tectonites, surrounding fractures in the damage zone and a mineralized zone consisting of fracture-bound hydrothermal precipitates (Hofmann et al. Reference Hofmann, Helfer, Diamond, Villa, Frei and Eikenberg2004; Belgrano et al. Reference Belgrano, Berger and Herwegh2016). Meso- and microstructural observations indicate multiple brecciation events (Hofmann et al. Reference Hofmann, Helfer, Diamond, Villa, Frei and Eikenberg2004; Berger & Herwegh, Reference Berger and Herwegh2019). The appearance of the cataclasites in the fault cores varies already macroscopically by their colour, mineralogy and clast sizes. Hydrothermal activity started at the latest at 3.4 Ma (Hofmann et al. Reference Hofmann, Helfer, Diamond, Villa, Frei and Eikenberg2004), and episodically continued to the present day as evidenced by hydrothermal apatites (Berger et al. Reference Berger, Egli, Glotzbach, Valla, Pettke and Herwegh2022) and present-day subthermal springs (Pfeifer et al. Reference Pfeifer, Sanchez, Degueldre, Kharaka and Maest1992; Waber et al. Reference Waber, Schneeberger, Mäder and Wanner2017; Diamond et al. Reference Diamond, Wanner and Waber2018; Wanner et al. Reference Wanner, Diamond and Alt-Epping2019). Fluid inclusion studies in hydrothermal SiO2 precipitates indicate a main hydrothermal overgrowth between 100 °C and 160 °C (Hofmann et al. Reference Hofmann, Helfer, Diamond, Villa, Frei and Eikenberg2004). Besides surface outcrops and samples, we also build on samples and data from a research drilling project which hit the GBF at depths of ∼30 m (for details see Egli et al. Reference Egli, Baumann, Küng, Berger, Baron and Herwegh2018; see also Fig. 1e). A great benefit of the drilling is that it allows sampling of fault gouges, which are mostly washed out at the surface and are therefore no longer accessible.
3. Methods
3.a. Bulk and mineral chemistry
Inductively coupled plasma emission spectroscopy and inductively coupled plasma mass spectrometry techniques are applied for bulk rock chemical analyses performed by AcmeLabs®. Detailed procedures can be found at www.bvna.com/mining-laboratory-services (formerly www.acmelab.com). The analytical errors of chemical data are generally <1 %. In all the diagrams presented the analytical error of bulk rock data is smaller than the symbol size in the plots. In addition, X-ray-fluorescence (XRF)-derived bulk rock data from the literature are incorporated (Schaltegger, unpubl. PhD thesis, Univ. Bern, 1989; A Pochon, unpub. Diploma thesis, Univ. Neuchâtel, 1997).
3.b. Methods to quantify mass/volume changes (Grant diagrams)
From a chemical point of view, possible mass and/or volume gain can be discussed in different ways (Gresens, Reference Gresens1967; Grant, Reference Grant1986, Reference Grant2005). Grant (Reference Grant1986) gave an overview for potential mass changes during alteration of rocks. In this approach, potential geochemical mass changes are unravelled by comparing concentrations of a mobile with an assumed immobile element. This results in:
 $$(\Delta {C_{\rm i}}/{C_{\rm i}}) = \left( {C^{\rm A}}_{\rm J}/{C^{\rm o}_{\rm J}} \right)\left( {{C^{\rm A}}_{\rm i}/{C^{\rm o}}_{\rm i}} \right) - 1 $$
The assumption of a constant mass yields
 $$(\Delta {C_{\rm i}}/{C_{\rm i}}) = \left( {{C^{\rm A}}_{\rm i}/{C^{\rm o}}_{\rm i}} \right){\rm{ }} - {\rm{ }}1$$
or for constant volume
 $$(\Delta {C_{\rm i}}/{C_{\rm i}}) = ({\rho ^{\rm A}}/{\rho^{\rm o}})\left( {C^{\rm A}}_{\rm i}/{C^{\rm o}_{\rm i}} \right) - 1 $$
where C A and C o are the concentrations of the starting material and the altered rock, respectively. Constants ρA and ρo represent the densities of starting and altered material. Subscripts i and j stand for an immobile and mobile element, respectively. Note that all three assumptions can be problematic, having often been the subject of multiple mass transports events. Conservation in volume requires closed systems, which also might not hold in the case of a hydrothermal system. Because of these substantial uncertainties in Equations (2) and (3), we mainly restrict our analysis to the assumption of immobile elements. This assumption is difficult to prove for major elements, which are highly dependent on the masses and volumes involved. Trace elements provide a way out of this dilemma since they are less dependent on mass or volume changes (e.g. Marquer, Reference Marquer1989). We therefore apply the trace element approach (Equation (1)) to detect and compare potential mass or volume gain between the different tectonites.
3.c. Particle size distribution (PSD)
In the past, different methods have been used to estimate PSD (see Table 1; Keulen et al. Reference Keulen, Heilbronner, Stunitz, Boullier and Ito2007, their table 1). In non-cohesive materials, the most efficient approach to obtain quantitative information on grain-size fractions is sieving and weighting, which primarily results in mass against particle size information (e.g. Anderson et al. Reference Anderson, Osborne and Palmer1983). As a first approach of this study, sieving is used for grain-size estimates of primary non-cohesive material, i.e. for fault gouges. They are sieved under wet conditions through mesh apertures of 16.0, 8.0, 4.0, 3.327, 2.367, 1.397, 1.0, 0.5, 0.25 and 0.125 mm. After each sieving step, the dried residue was weighted and recorded. The measured mass can be transferred into a volume by using an assumed average density (2.65 g cm−3) of the particles. However, such bulk volume estimates are not directly comparable with particle size frequency data as they result from other methods. Therefore, we transformed the obtained volumetric information into particle size estimates. We used the first-order assumption of spherically shaped particles, with a specific particle diameter obtained for each mesh interval, allowing the calculation of the volume of one average-sized particle. The number of equivalent spherical grains was then determined by dividing the bulk volume by the volume of the average particle size.
Table 1. Review of PSD data

Note: LM: light microscope; DIA: digital image analysis; SEM: Scanning electron microscope; LPS: Laser particle sizer; S: sieving.
The second approach for particle size estimation is based on quantitative image analysis, which is applied on thin-sections of cemented cataclasites. Micro-photographs acquired by scanning electron microscope (SEM) or optical microscope are used to manually redraw individual particles, the particle areas of which are then analysed by the software ImageJ 1.46. Afterwards, the resulting area of each particle is transferred into a 2D equivalent circular diameter (e.g. Berger et al. Reference Berger, Herwegh, Schwarz and Putlitz2011; Heilbronner & Barrett, Reference Heilbronner and Barrett2014). Measurements were done on line drawings. Analysed grain numbers are between ∼230 and ∼800 grains per sample analysed (Table 2).
Table 2. Data from PSD analysis

Note: Area: analysed area; Cata: cataclasite; Cock.: cockade-bearing tectonite; D: fractal dimension; dc: minimum clast size; DIA: digital image analysis; HS: hand sample; LM: light microscope; S: sieving. ϕ: see equation 5b.
Fractal dimensions are useful to represent suitable quantitative descriptions of PSD analysed on different magnifications (Turcotte, Reference Turcotte1986; Blenkinsop, Reference Blenkinsop1991; Jebrak, Reference Jebrak1997) and are also determined in this study. For each tectonite sample the fractal dimension (D) is estimated by (Turcotte, Reference Turcotte1986):
 $$N\left( d \right)\sim{d^{ - D}}$$
where N(d) is the number of particles in the size-class d, with d as diameter of the particles. The estimation of D has lower and upper limits depending on the fractal behaviour of the particles and the measurement range (Blenkinsop, Reference Blenkinsop1991; Heilbronner & Keulen, Reference Heilbronner and Keulen2006; Keulen et al. Reference Keulen, Heilbronner, Stunitz, Boullier and Ito2007; Kruhl, Reference Kruhl2013). Several points need to be considered when dealing with PSD: (i) PSD data only reflect the grain-size range covered by the respective imaging technique. Hence larger and smaller grain-size classes beyond the image resolution are not captured (e.g. Keulen et al. Reference Keulen, Stünitz and Heilbronner2008; Cortinovis et al. Reference Cortinovis, Balsamo and Storti2019). (ii) The applicability of the power law relationship of Equation (4) has been questioned (Phillips & Williams, Reference Phillips and Williams2021). In this sense, different uncertainties in PSD data have been suggested to result from a combination of the type and quality of the raw data and the power law relationship used (Phillips & Williams, Reference Phillips and Williams2021; see Supplementary Material available online at https://doi.org/10.1017/S0016756822000218; Torabi & Berg, Reference Torabi and Berg2011). For example, the truncation effect (underestimation of small particles due to resolution limitations) and the censoring effect (underestimation of large particles due to the size limitation of the sampling area) will influence the reliability of any power law fit. Being aware of these basic uncertainties, we do not use the power law relationship to infer specific processes but rather apply the approach for the discrimination of our different microstructure types. Since we consistently apply the approach following previous studies, our data can also directly compare among the different datasets (Table 1). In order to clearly declare the problem of using a power law for a limited grain size range, we indicate the lower grain-size limits as additional values in our microstructural dataset.
Hadizadeh & Johnson (Reference Hadizadeh and Johnson2003) introduced the comminution intensity, ϕ, as a microstructural variable:
 $$φ= 1 - [{A_{\rm dc}}/({A_0} - \rm phi*{A_0})]$$
where A dc is the total area of the particle population critical size, A 0 is the total measurement area and phi is the initial porosity. In the case of an unknown initial porosity, the equation simplifies to:
 $$φ = 1 - {A_{\rm dc}}/{A_0}$$
The definition of A dc depends on the fractal character of the PSD. This yields, for example, an expression in the form of ϕ = 0.9d0.1, where comminution reduced 90 % of the particles to a particle size smaller than 0.1 mm.
The ϕ value can therefore be used as a microstructural parameter, which is identified by the clast versus matrix area ratio. A definition of a minimum clast size (‘dc’ in Equation (5)) will give additional information on the truncation effect, but also limit the scale of the PSD. The definition of matrix and clasts depends on the selected fault rock (Fig. 2).
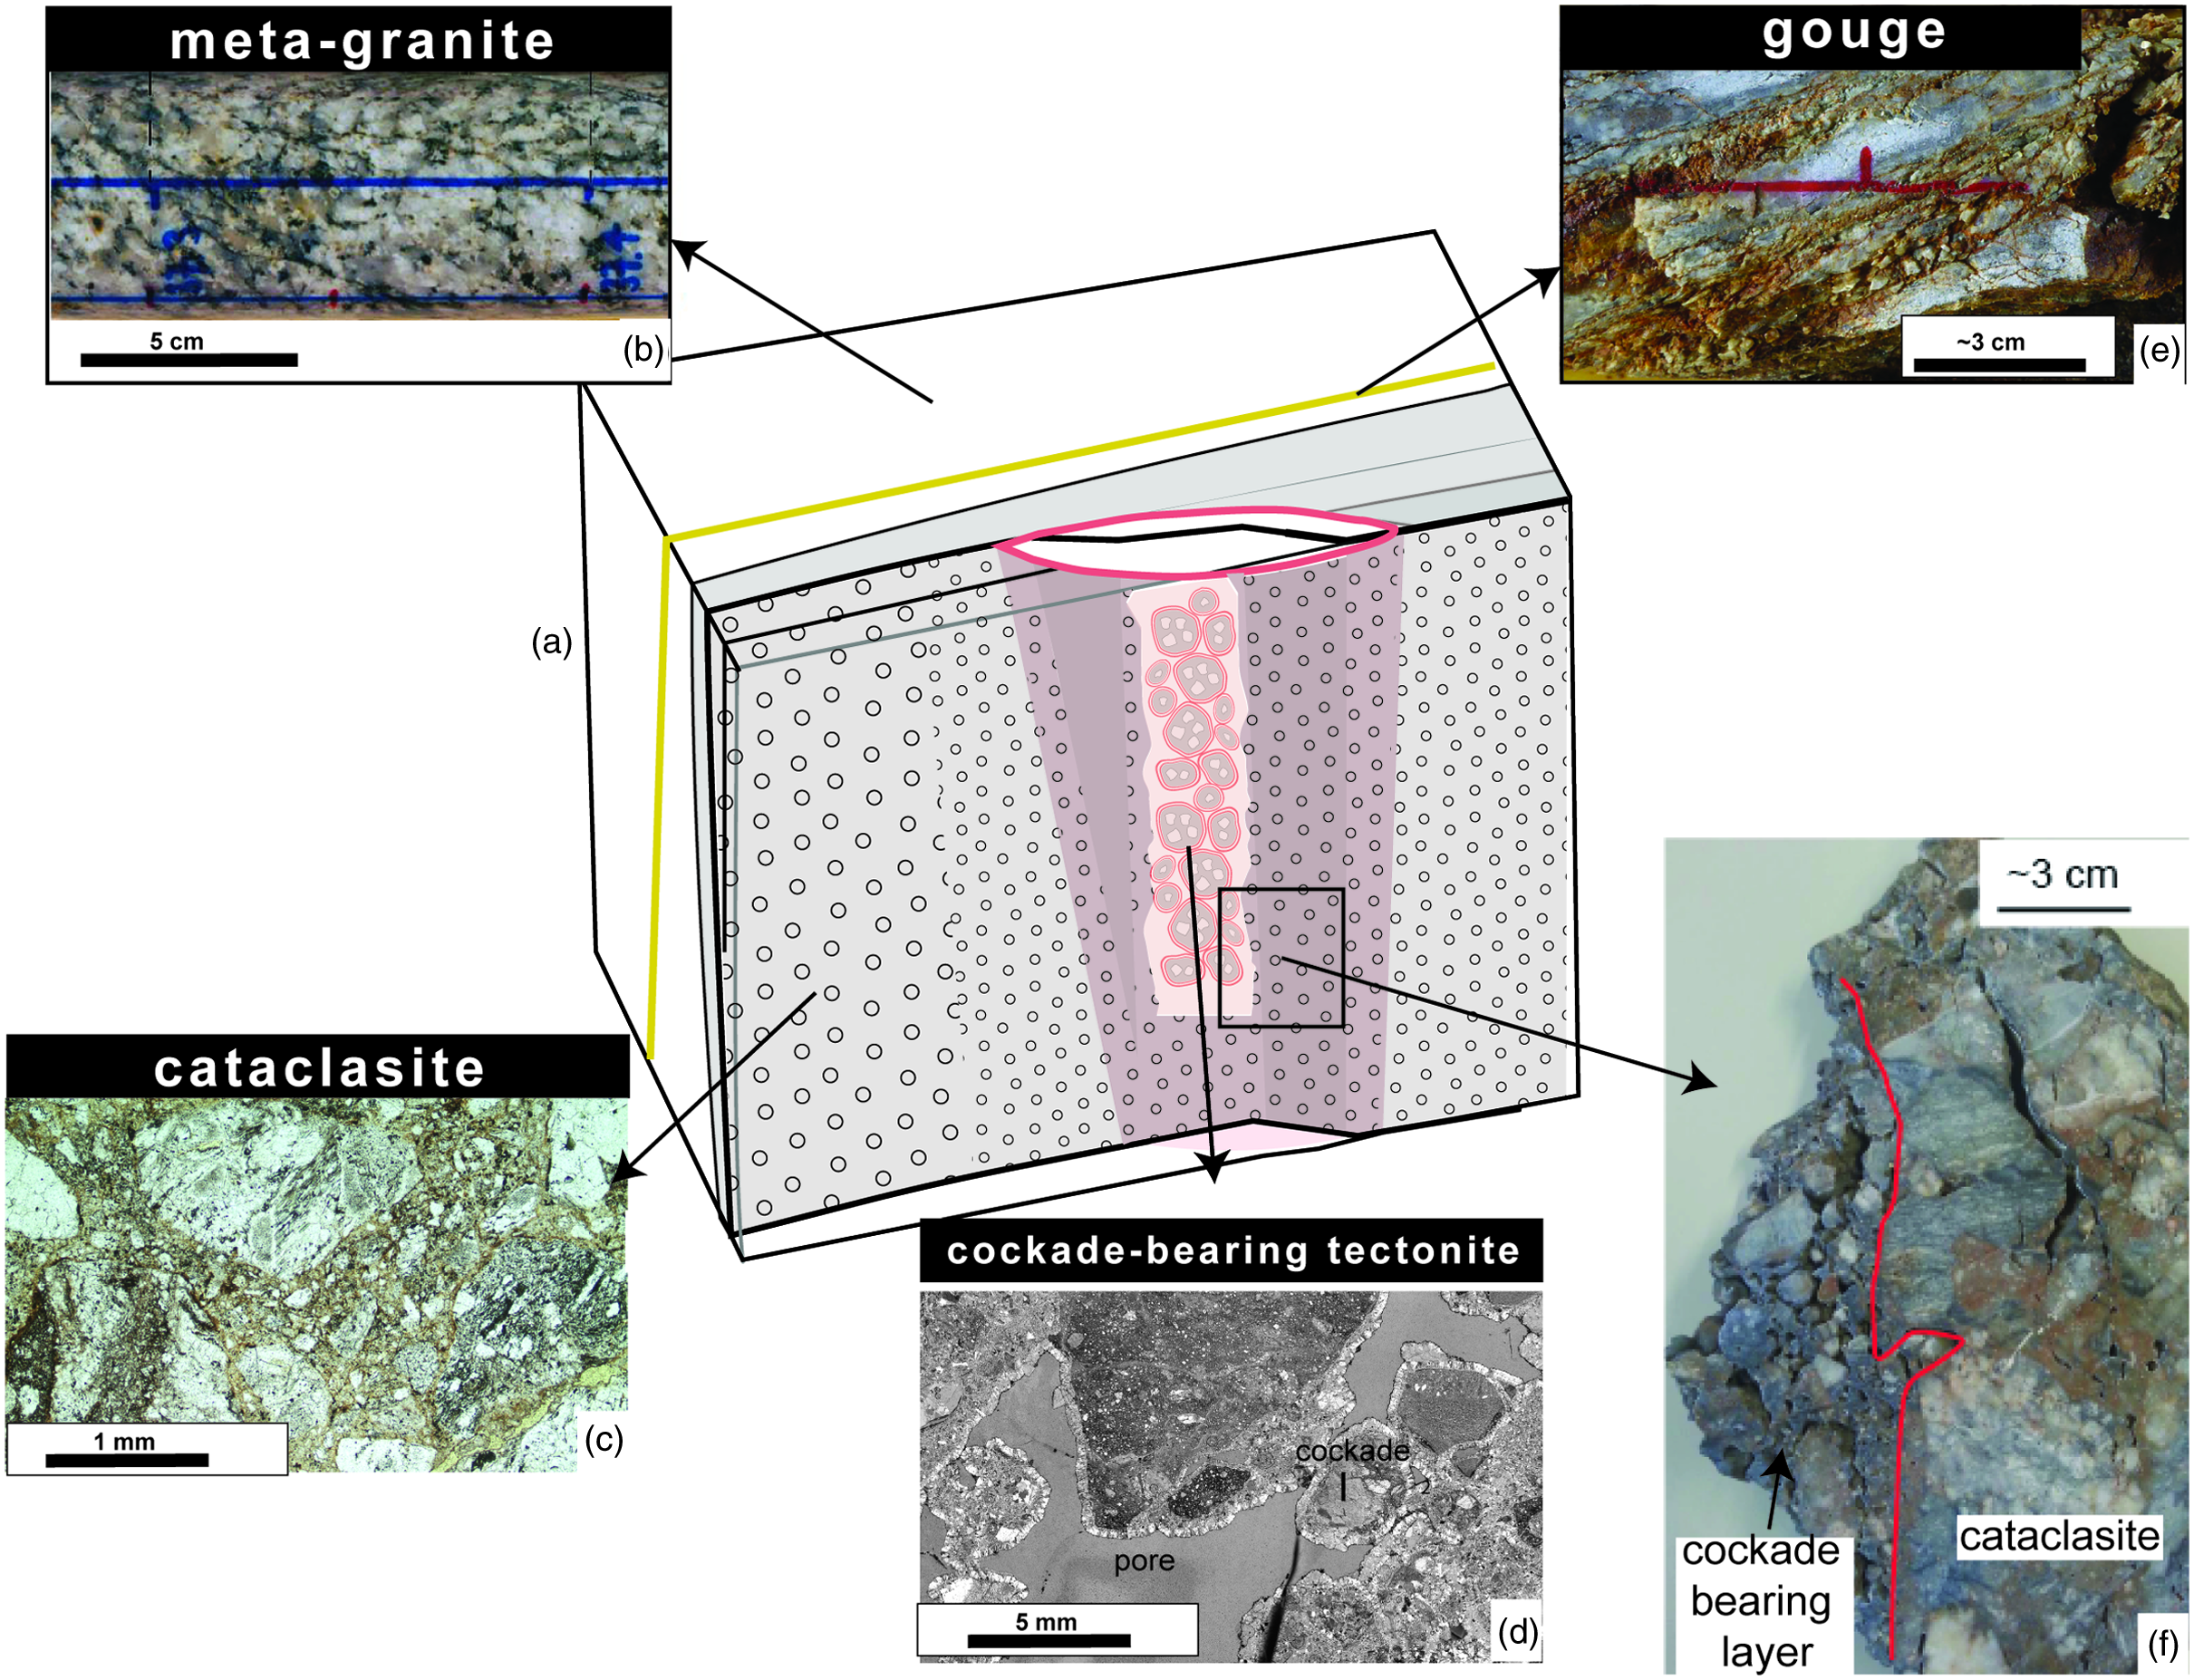
Fig. 2. Textural characterization of the different fault rocks. (a) Schematic drawing of the spatial relationships of the different tectonites (no scale). (b) Photograph of a drill core of the only weakly deformed Southwestern Aare granite. (c, d) Microphotographs (plane light) of (c) a cataclasite and (d) a cockade-bearing tectonite. (e) Photograph of a drill core of the fault gouge. (f) Hand sample of a breccia in contact with a cockade-bearing layer.
4. Results
4.a. Tectonite types and their geometric relationships
We investigate the microstructures and chemistry of selected samples, which are subdivided into the following tectonite groups: (1) cataclasites (different comminution intensities), (2) cockade-bearing tectonites and (3) fault gouges (Fig. 2). Note that the geometric relationship of the block diagram schematically shown in Figure 2a holds for a variety of scales. In addition to these tectonites, the host rock, as starting material, was also investigated in terms of chemistry. The cataclasites form different planar high-strain zones ranging from the mm to the metre scale and show a broad range of clast sizes (see below). The cockade-bearing tectonites occur only locally on the cm to dm scale within vertically oriented tube-like channels (Figs 2a, d, 3a). These channels occur inside the tectonites of the GBF (see above). These cockade-bearing rocks show still-existing open porosity (Fig. 3; see Berger & Herwegh, Reference Berger and Herwegh2019). In many cases, the core of individual cockade particles consists of pre-existing cataclasites, which were fragmented and mobilized during cockade formation (Berger & Herwegh, Reference Berger and Herwegh2019). Hence it is important to note that cockade formation requires dilatant brittle deformation. The cataclasites have high variability in clast volume and clast sizes. As a function of the analysed clast sizes, the cataclasites can be further discriminated (Table 1; Section 4.c).

Fig. 3. Microstructures of cockade-bearing fault rocks. (a) Field photograph of a cockade tube (outlined in blue and arrow). Small inset represents the top view of this cockade tube. (b) Plane light photograph of a thin-section of a cockade-bearing tectonite. (c) Detail of a cross-polarized light photomicrograph of a cockade-bearing tectonite. (d) CL image of a detail of the cements of a cockade triple junction. Number significations in all images are: 1. cataclastic cores of cockades, 2. cockade overgrowth rim, 3. open pores, 4, cockade inside a cockade.
In the study area, the spatial distribution of cataclasites shows a scale dependency (Figs 4, 5a). At first glance, the large-scale trends of cataclasites and hydrothermally altered zones (Fig. 4a) are NE–SW- to E–W-directed (Fig. 1b, c), but can be more differentiated at the tens of metres down to the metre scale (Fig. 4a, b). At the latter scale, the main cataclasite bands separate domains of ‘intact’ host rocks, being themselves heterogeneously dissected by localized brittle structures such as open fractures, cockade-bearing tectonites and hydrothermal alteration zones (Fig. 4). At the map view, their traces are oblique to the main cataclasites but parallel to maximum stress direction. The main cataclasites show evidence for intense multiple deformation events, as indicated by cross-cutting relationships like cataclasite clasts within cataclasites (Figs 5, 6). Also in the case of cockade-bearing tectonites, multiple overprints (e.g. cockades in cockades, cockades with cores of pre-existing cataclasites; Figs 2, 3) occur, documenting the cyclical character of deformation and precipitation in these hydrothermal fault rocks.

Fig. 4. Geometrical relationships between the different tectonites. (a) Drone image of a part of the Sidelhorn linkage zone. (b) Drone mapping of a small area inside (a) (an area of ∼120 m2) showing the cataclasites, fractures and cockade-bearing tectonites (mapping done by C. Schmid, unpubl. Msc thesis Univ. Bern, 2021). In addition, alteration zones are mapped, which are directly linked to fractures. All structures are steep. (c) Schematic 3D sketch of the situation as mapped in (b).

Fig. 5. Illustration of the cataclasites and mylonites. (a) Cataclasite dissecting older mylonite; (b) cross-polarized light microphotograph of a quartz mylonite; (c) plane light microphotograph of a cataclasite; and (d) SEM image of a cataclasite showing the K-fsp cements surrounding quartz clasts and quartz veins inside the cataclasite.

Fig. 6. Microstructures of the cataclasites. (a) Plane light microphotograph gives an overview of different generations of cataclasites and their rebrecciation. (b) Backscatter electron (BSE) image of a comminuted cataclasite being dissected by a quartz vein. (c) Same view as (b) but as CL image showing the K-fsp and quartz overgrowth of the old clasts, also illustrating the difference between old and new K-fsp and old and new quartz (see green arrows). (d) BSE image showing different clasts and the deformation features (note that the letters are explained below). (e) Overview image of a cataclasite including small and large clasts. The large clasts are outlined in yellow. The positions of images (f) and (g) are indicated. (f) and (g) are BSE images showing the different dimensions of the clast sizes and the occurrence of rock particles and newly formed minerals at different magnifications (Note particles marked with B, D and F). A: pores, B: large clasts; C: matrix with cements; D: small clasts; E: veins; F: newly precipitated mineral; Q: quartz.
4.b. Starting material (Southwestern Aar Granite and mylonites)
The country rocks of the GBF are the Southwestern Aar Granite, in fact a meta-granite, and precursor mylonites (see above). Besides documenting ductile deformation stages in the Aar Massif in general and of the Grimselpass shear zone in particular, these rocks also represent the starting material of the investigated brittle fault rocks. Owing to Alpine deformational overprint, the Southwestern Aar Granite is characterized by a gneissic texture of mm-scaled feldspars (albite and K-feldspar), often dynamically recrystallized quartz, and variable amounts of white mica and biotite. The feldspars are altered into white mica, epidote and minor amounts of oxides. The biotite grains are often chloritized. The aligned micas form a well-visible planar gneissic fabric (Fig. 2b). The grain sizes of the micas are in the range 0.1–0.05 mm. The Southwestern Aar Granite has been geochemically characterized by different studies (Schaltegger, unpubl. PhD thesis, Univ. Bern, 1989; Schaltegger, Reference Schaltegger1990, and references therein; A Pochon, unpub. Diploma thesis, Univ. Neuchâtel, 1997; Table 3) indicating that mineralogical variations of the starting material are minor (Fig. 7; A Pochon, unpub. Diploma thesis, Univ. Neuchâtel, 1997). The rare-earth elements (REE) distribution of the host shows a typical granite pattern with a negative Eu anomaly (Fig. 7).
Table 3. Geochemical data

Note: Major elements in wt%, trace elements in μm/g; gs: grain size separated; WR: whole rock; Fus-ICP: Fusion-inductively coupled plasma optical emission spectroscopy; ICP_MS: inductively coupled plasma mass spectroscopy.

Fig. 7. Geochemical compositions of the fault rocks and related host rocks. (a–h) Selected major and trace element contents against Al2O3 contents. (i) REE patterns of the main elements normalized to chondrite values.
The mylonites contain similar minerals, but they are in rare cases enriched in white mica or quartz. Compared to the host granite, the grain size is already orders of magnitudes smaller (10–30 µm; see Wehrens et al. Reference Wehrens, Berger, Peters, Spillmann and Herwegh2016). The main deformation mechanism in the polymineralic mylonites is viscous granular flow, while in mylonitized quartz veins subgrain rotation recrystallization represents the dominant dynamic recrystallization process. The K-fsp and albite are fine-grained in the mylonites and not altered as in the coarse-grained granitic precursor.
4.c. Cataclasites
Cataclasites mostly overprint mylonitic or gneissic precursor structures (Rolland et al. Reference Rolland, Cox and Corsini2009; Wehrens et al. Reference Wehrens, Berger, Peters, Spillmann and Herwegh2016, Reference Wehrens, Baumberger, Berger and Herwegh2017). Volumetrically they dominate within the suite of the studied brittle fault rocks. They show different degrees of comminution expressed by rather variable clast sizes ranging from centimetres down to micrometres (Figs 2, 8; Table 2). Rebrecciation of older cataclasite generations and cataclastic flow is common (Figs 3b, 6a; Hofmann et al. Reference Hofmann, Helfer, Diamond, Villa, Frei and Eikenberg2004; Belgrano et al. Reference Belgrano, Berger and Herwegh2016 and figures therein).

Fig. 8. Particle size distributions (PSDs) and images of the investigated samples. (a–c) Plane light microphotographs which were used for clast size analyses; (d) PSDs estimated by image analysis (sample names are indicated); (e) PSDs of gouges estimated by sieving; (f) schematic sketch of the relationship between calculated median values of the raw data versus possible change in bulk finite strain (without any scale).
The matrix of the different cataclasites can be characterized by (1) fine-grinded host material; (2) overgrowth cements around larger clasts; (3) isolated newly precipitated crystals (often K-feldspar, oxides, sulphides and quartz); and (4) small-scale veins (Figs 5, 6). The overgrowth cements (2) are often K-fsp and in minor amounts also quartz (see arrows in Fig. 6c). Small veins (4) are frequent, documenting an interplay of brittle fracturing of a solidified cataclastic material and mineral precipitation. These veins are either filled by quartz or show polymineralic infill of quartz and oxides (Fig. 6b, d). The mineralogy of the fine-grained matrix is dominated by quartz and feldspars.
The clasts inside the cataclasites either consist of host rock (granite/mylonite) or precursor cataclasite fragments (Figs 2, 5). In the case of fine-grained clasts, the clasts preferentially are monomineralic (Fig. 6d, e). Depending on the clast sizes (see also ψ value in Table 2), we analysed areas from several cm2 down to mm2 (see Fig. 8; Table 2) to statistically properly characterize individual cataclasite types. The resulting PSDs allow for calculation of the fractal dimensions within a cataclasite, which range between 2.8 and 3.3 (Fig. 8; Table 2). Interestingly, the fractal dimension increases with decreasing clast size (see also Section 3.c and Table 1).
4.d. Cockade-bearing tectonites
Some tectonites contain cockade structures (Figs 2, 3; Berger & Herwegh, Reference Berger and Herwegh2019). This tectonite type occurs as isolated tube-like steep channels inside the GBF (Figs 2, 3, 4). Cockade textures are usually characterized by hydrothermal precipitates around clasts (Fig. 3). These structures can only be explained by free growth of hydrothermal minerals in a fluid jet, which is also the case in the GBF (mobile cements of Berger & Herwegh, Reference Berger and Herwegh2019; see also Masoch et al. Reference Masoch, Fondriest, Preto, Secco and Di Toro2019). The cockade layers consist of hydrothermally grown quartz (Fig. 3). Since this precipitation occurred in 3D, a floating core is necessary. This precipitation is responsible for μm-sized small growth rims around the cockade cores and related mass gain (Figs 2, 3). In addition, individual cockades can be partly cemented together mainly by chalcedony and minor K-fsp and quartz. This cementation occurred after settling of the formerly floating cockade particles in the remaining inter-particle pore space (immobile cements of Berger & Herwegh, Reference Berger and Herwegh2019). In rare examples, other minerals such as clay grow inside the pores. In this context, it is crucial to note that the cores of individual cockades represent the above-described cataclasites (Fig. 3). In terms of relative timing, the different layers growing around each core require the repeated occurrence of earthquakes (Fig. 3; Berger & Herwegh, Reference Berger and Herwegh2019, chapter 6.1). Depending on the size and position of such cockade-bearing tectonites, they are overprinted either in cataclasites, or become refractured and themselves involved in a new cockade generation during a subsequent earthquake event (Fig. 3).
4.e. Fault gouges
Mechanically, the main difference between the cataclasites and the fault gouges is the missing cohesion (Sibson, Reference Sibson1977). The preserved fault gouges in the drill core show widths on the scale of mm to several cm (Fig. 2e). The gouge material for the PSD analysis has been scratched out between relatively intact host rock walls. Owing to this procedure, nonetheless, larger fragments of incompletely fragmented host rock could have been sampled as well. Such large fragments have been excluded from further analysis. The obtained PSDs of the two analysed fault gouges yield a fractal dimension (D) of 2.6 (Fig. 8; Table 2). As with the cataclasites, we did not further investigate particle sizes in the fine-grained matrix, which is classified as matrix.
5. Chemistry and mass transfer
The different tectonites differ substantially in their chemistry as shown in Harker diagrams (Fig. 7). The granitic protolith and the cockade-bearing tectonites represent the two end-members in the chemical variation (Fig. 7). The chemistry of the cockade-bearing breccia is dominated by a high gain in SiO2 (Fig. 7; Table 3). This is consistent with the observed dominant growth of hydrothermal quartz in the cockade particles (Fig. 3). The gouges show a substantial gain in Fe2O3, as can already be inferred from the Fe-oxides and hydroxides clearly visible in the macro- and microstructures (Fig. 6). The different cataclasites show more substantial chemical variations than the granitic host rock, particularly including chemical changes in Si, K and Na (Fig. 7).
While the Harker diagrams discussed above better illustrate the overall chemical variations between the different tectonites, the Grant analysis yields insights into mass and volume changes. Grant diagrams allow the construction of an isocon including different immobile elements (see Section 3.b). The best-selected immobile elements in this example are Y, Ti, Zr and Th (Fig. 9). The isocon also includes Al2O3, indicating also relative immobile behaviour of Al2O3 as major element (see also Fig. 7). The immobility of Y, REE and Zr can also be seen in the constant REE pattern of the different samples. Assuming that the Y, Ti and Zr represent a useful isocon, the deviations from the 1:1 line identify elements which detect a volume gain or loss between host rock and tectonites. In a first data set, we compare a cataclasite with the protolith. Note the gain of SiO2 and, in minor amounts, some other mobile elements (Fig. 9a). The SiO2 not only gains in relation to the isocon, but also above the 1:1 line. This can only be explained by volume gain (see Section 3.b). This gain is variable, as seen in the Harker diagrams (Fig. 7). In a second example, we compare a gouge sample with the protolith, which shows an isocon close to the 1:1 line. With the exception of the Fe2O3, these samples show no large changes in mass or volume. The selected Grant diagram supports the trend already seen in the Harker diagrams (Fig. 7). In addition, it shows the different volume changes of these tectonites.
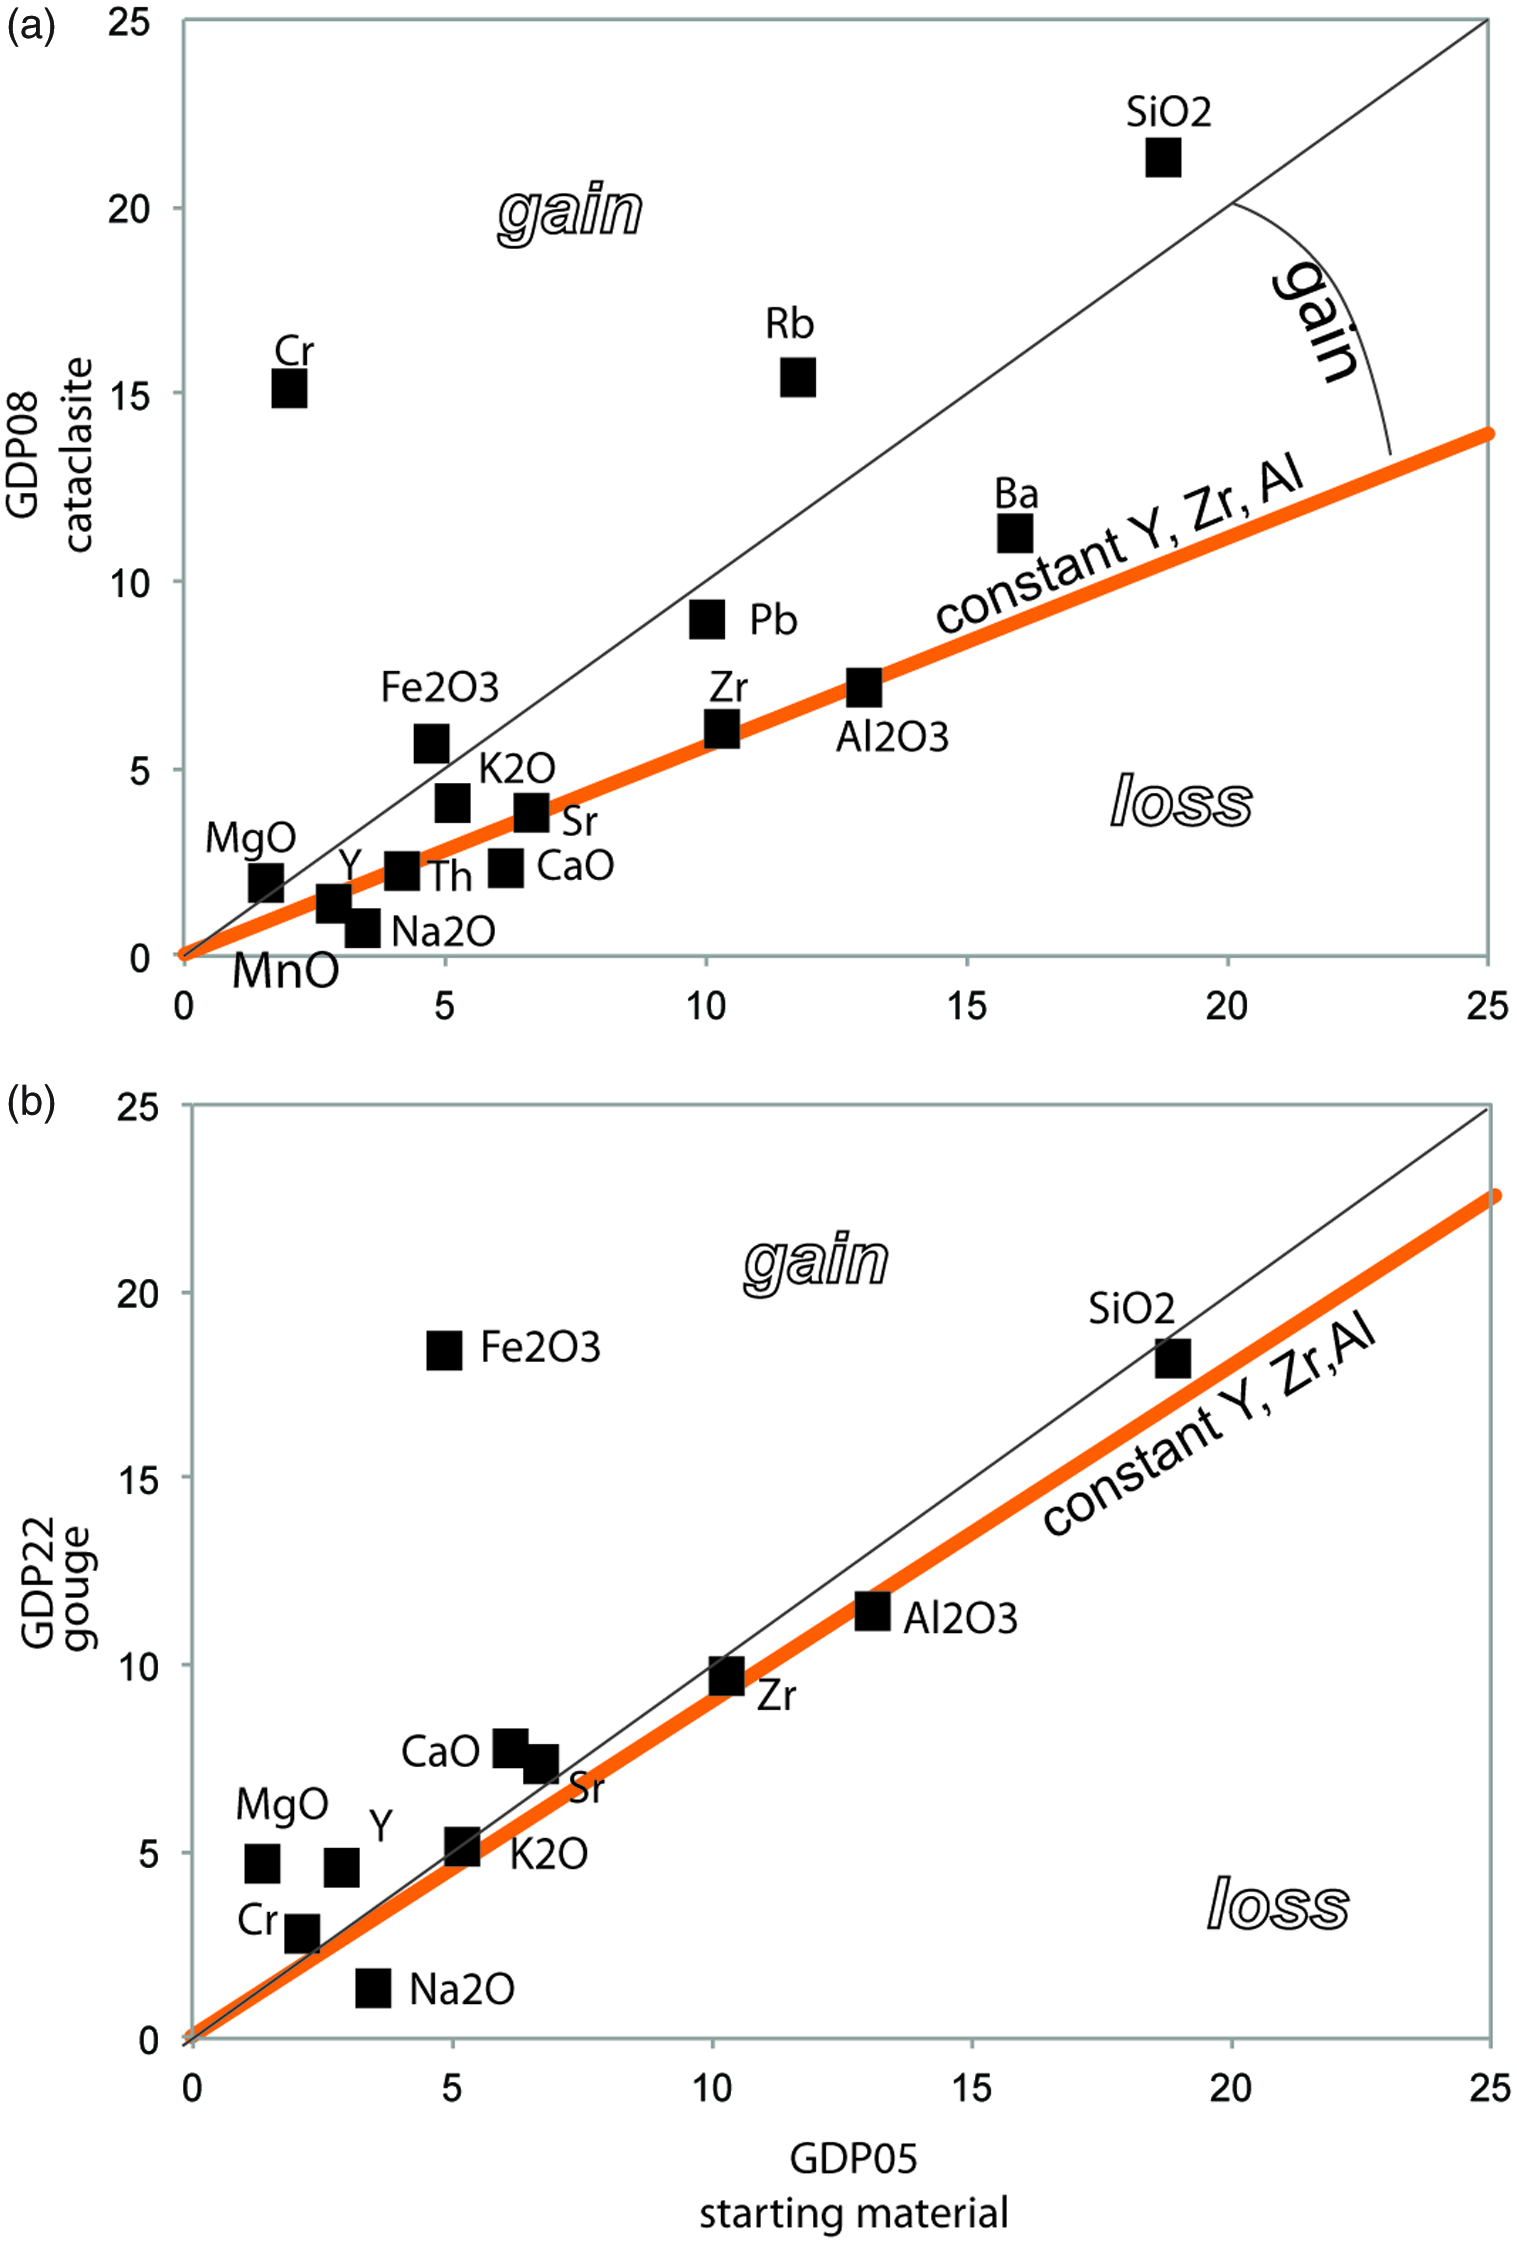
Fig. 9. Grant diagrams between the host rock (sample GDP05) and different tectonites. (a) Cataclasite (sample GDP08); (b) fault gouge (sample GDP22). Data: SiO2 (wt %)/4, Fe2O3 (wt %) * 4, Al2O3 (wt %), MnO (wt %) * 2, MgO (wt %) * 10, CaO (wt %) * 10, Na2O (wt %), K2O (wt %), Ba (ppm)/30, Sr (ppm)/10, Y (ppm)/10, Zr (ppm)/10, Cr (ppm)/10, Rb (ppm)/20, Pb (ppm), Th (ppm)/5.
6. Discussion
As demonstrated above, the three studied end-members, cockade-bearing tectonites, cataclasites and fault gouges, show substantial microstructural and geochemical variations. In order to discuss their evolution and mechanical significance within the Grimsel breccia fault, the speed of deformation and precipitation processes represents an additional important constraint that needs to be considered. Based on our new findings and existing knowledge from the literature, we elaborate these aspects in the following discussion, first for cockades and then for the grain-sized reduced host rock materials (cataclasites, gouges).
6.a. Processes during cockade formation
As mentioned above, the term ‘cockade structures’ is used for many spherical objects characterized by growth rims. It is a term that is especially applied in the field of ore geology (see summary in Frenzl & Woodcock, Reference Frenzel and Woodcock2014). The here discussed cockade-bearing tectonites have formed by fracturing under seismic rates (Cox & Munroe, Reference Cox and Munroe2016; Berger & Herwegh, Reference Berger and Herwegh2019; Masoch et al. Reference Masoch, Fondriest, Preto, Secco and Di Toro2019; see also Section 4.d, Figs 2, 3). To allow such floating cockade particles, injection of fluids at high speed into an open fracture is required. This includes fast opening and a considerable pressure drop (see Berger & Herwegh, Reference Berger and Herwegh2019), which is only possible during earthquakes. Hence, already their appearance yields the important information of high-speed deformation and associated precipitation processes during cockade flotation in a fluid jet. Cockade growth therefore developed during and directly after seismic rupturing (Berger & Herwegh, Reference Berger and Herwegh2019) by precipitation from an oversaturated fluid during seconds to minutes owing to a pore fluid pressure drop just after seismic rupturing. Note that the small width (<15 µm) of a growth rim and the small volumes of associated quartz precipitation require fast growth rates during the short time (minutes to hours) interval of cockade flotation. Repeated stages of fluid injection induced renewed flotation events of cockades and precipitation around cockade cores, resulting in the typical spherical growth rims (Figs 2, 3).
In contrast, the inter-particle cements represent stages of long-term precipitation within interconnected open pore space during the circulation of hydrothermal fluids between the settled cockade aggregates. This type of precipitation lasts as long as permeability is maintained before the complete clogging of the system by the hydrothermal precipitates. In the case of cockades of the GBF, estimates by Berger and Herwegh (Reference Berger and Herwegh2019) yield time intervals for this type of precipitation of hundreds to thousands of years, pointing to a slow growth of immobile cements during interseismic periods. Despite these severe differences in precipitation times, both mobile and immobile cements explain the extreme SiO2-rich bulk rock compositions of the cockade-bearing tectonites (Fig. 7). The inferred gain in SiO2 in combination with the extreme high porosity of these cockade-bearing tectonites relates to the volume gain by the dilatational deformation necessary for the formation of such fault rocks. In this sense, volume and mass gain is most pronounced in the case of cockade-bearing tectonites (Figs 7, 9), the reason for which is threefold: (i) substantial opening of new fracture space during one rupturing event; (ii) complete or partial filling of this pore space during interseismic mineral precipitation; (iii) repetitive cycles of (i) and (ii) during subsequent earthquake activity. Depending on the amount of quartz cement precipitation, immobile cockade cements result in a progressive gain in cohesion, i.e. a gain in rock strength with increasing amount of precipitated cement. This has important consequences for the loading stage of a seismic cycle as discussed further below.
6.b. Processes during cataclastic flow
In contrast to the volume and mass gain processes in the cockade-bearing tectonites, at first glance the main microstructural characteristics in the cataclasites and the gouges are dominated by progressive grain-size reduction via brittle/frictional processes. This results in the development of clast sizes covering several orders of magnitude (Figs 6, 8). While the larger particles are dominated by rock fragments, the monomineralic character of smaller particles points to a progressive grain-size reduction and disintegration of the former host rocks. Independent of the clast sizes, clasts are always surrounded by a matrix. These matrix-dominated layers are characterized by smaller particle sizes, as previously defined (see Equation (5)). The fractal dimension, as well as the average particle sizes, is the expression of the progressive destructive processes as a function of increasing finite strain within a non-coaxial kinematic framework.
Despite pronounced activity of destructive processes, cataclasites also bear evidences for constructive processes. These are, for example, different types of grain growth in matrix grains, the occurrence of cements between matrix grains, as well as vein infills of fractured matrix material (different examples illustrated in Fig. 6). Similar to the constructive mobile and immobile cockade cements, also in the case of the cataclasites these processes add mass to the system and change the mechanical behaviour, because of a gain in rock strength with increasing degree of matrix cementation. In the case of the cataclasites, we distinguish the following types of cementation: (1) precipitation from a fluid, (2) mineral reactions forming new minerals and (3) solid reorganization by solution/precipitation.
The fundamental change in chemistry and mineralogy between a fresh granitic host and the resulting cataclasite indicates the importance of K-fsp producing mineral reactions. This is consistent with the observed microstructures documenting newly formed K-fsp cements (Figs 6, 9). Hence a gain in K2O is necessary, which leads to the reaction:
 $${\rm{White}}\ {\rm{mica}} + {{\rm{K}}_2}{\rm{O}} = \gt {\rm{K}} - {\rm{fsp}} + {\rm{quartz}}$$
However, a local gain of Al2O3 cannot be excluded, which would be related to the reaction:
 $${\rm{White}}\ {\rm{mica}} + {\rm{quartz}} =\!\!\!\gt\ {\rm{K}} - {\rm{fsp}} + {\rm{A}}{{\rm{1}}_2}{{\rm{O}}_3}$$
Based on the chemical data of this study, such a gain in Al2O3 is unlikely, because of the relatively constant Al2O3 chemistry between the different analysed tectonites (Fig. 9). Microstructural domains dominated by reaction (6a) can be recognized by the variable Al/K ratios. In addition to this mineral reaction, local dissolution, mass transfer and precipitation processes occur, which can be described as:
 $${\rm{Qt}}{{\rm{z}}_1} = \!\!\!\gt \ {\rm{Qt}}{{\rm{z}}_2}$$
 $${\rm{K}} - {\rm{fs}}{{\rm{p}}_1} = \!\!\!\gt \ {\rm{K}} - {\rm{fs}}{{\rm{p}}_2}$$
Reactions (7) and (8) are only visible in the cathodoluminescence (CL) images (Fig. 6c). The overall microstructures of clasts, different types of cementation and solution/precipitation processes in the cataclasites indicate a combination of frictional deformation processes and fluid-related cementation.
Compared to the cockade-bearing tectonites, the mass gain for cataclasites is moderate (Figs 7, 9) but much more substantial than for fault gouges. In a microstructural perspective, actual locations of mass gain in the cataclastic microstructures represent the last stage of mineral precipitation in a probably long-lasting deformation history. Owing to earlier stages of cataclastic flow, earlier cement generations were destroyed either by brittle fragmentation or dissolution and renewed mobilization in the fluid. This low preservation potential of older cement generations is highly favoured by the destructive deformation processes, particularly by the aforementioned strain-dependent grain-size reduction. Vice versa, the correspondingly enhanced grain surface areas in fine-grained cataclasite matrix enhances dissolution as well as mineral reaction processes. Hence, in contrast to cockade-bearing tectonites, the preservation of older precipitation events is rather limited for cataclasites. Only in the case of branching cataclastic bands, particularly by their deactivation owing to healing-induced gains in fault rock strength and subsequent formation of new bands, might structural witnesses survive. These structures might allow views back in time by unravelling relative sequences of deformation and healing/precipitation.
6.c. Interactions of processes
Section 6.a describes cockade-bearing tectonites, with fast-growing mobile and immobile hydrothermal cements as well as large volume and mass gain (mainly SiO2). Section 6.b describes cataclasites with some gain of SiO2 from a fluid and dominantly cementation including mineral reactions and precipitation. In both cases the fluids probably are identical, but their flow rates must vary owing to fault-rock-dependent changes in permeability, yielding differences in the aforementioned cementation behaviour. Hence, cockade-bearing tectonites and cataclasites (also gouges) must be linked and connected, in both 3D space and time. We therefore propose the following interactions:
-
1. The cycles of fracturing and healing influence the behaviour of fault rocks (Fig. 10f).
-
2. There must exist a close feedback between cycles of fracturing and healing and type of mass and volume gain in these fault rocks.
-
3. The 3D geometries and spatial distribution of the different tectonite types (= fault architecture) are time- and scale-dependent (Fig. 10).

Fig. 10. Schematic overview of geometries and processes of a hydrothermal fault and their evolution in space and time. (a) Top row shows the different scales. Left column indicates the structural evolution in time showing different overprinting relationships. The overprinting of local cockade-bearing tubes is shown, but also cataclasite layers are multiply reactivated. (b, c) Details of overprinted cataclasites showing the cements and the filled fractures, respectively. (d) Schematic evolution of mass gain. (e) Clast-size evolution with increasing finite strain. (f) Summary of the cyclical interplay between grain-size reduction and precipitation for the different tectonites (cf. (a)).
With regard to (1), generally fracturing is controlled by the material constants (µ, C) within a given stress field (e.g. Cox, Reference Cox2005; see also, e.g., modelling in Hooker & Fisher, Reference Hooker and Fisher2021). Depending on those relations and the stress state, shear fractures, extensional fractures and mixed fractures will dominate (fig. 3 in Cox, Reference Cox2005). The local porosity and the precipitated cements have a direct feedback on the strength evolution of the associated fault rocks and therefore also on the next fracturing event.
With regard to (2), an important parameter in such an active hydrothermal system is the deformation-induced location of dilatation, i.e. of increasing volumetric strain. The chemical analyses of the different tectonites indicate a substantial mass gain, mainly in SiO2 (see also the dominant quartz cements; Figs 5, 6). The maximum gain is ∼120 % in the cockade-bearing tectonites and ∼50 % (40–60 %) in the cataclasites (Fig. 9). In addition, the still open high porosity adds even more to the volumetric strain of the cockade-bearing tectonites. Due to the similar density of the cataclasites and the added masses, we can state that the mass gain must be directly proportional to a volume gain. This added volume developed during fracturing of the brittle tectonites (Figs 9, 10). Hence locations with substantial increase in volumetric strain indicate where permeability and therefore fluid flux occurred within the large-scale fault architecture prior to clogging by cementation (Fig. 10). The largest volume/mass gain occurs in large open fracture on linkage zones, which often host cockade-bearing tectonites (Fig. 10). In contrast, cataclastic flow during shearing is related to much lower added volumes. Here, the moderate fluid volumes in combination with the deformation-induced small grain sizes promote pressure solution and reaction/precipitation processes (Fig. 6). The quantified moderate SiO2 mass gain indicates that cataclastic flow produces a lower porosity and a lower amount of mineral precipitation compared to the cockade-bearing structures. Despite still open pore spaces between 5 and 15 % (see Egli et al. Reference Egli, Baumann, Küng, Berger, Baron and Herwegh2018), cataclasites underwent dominant reaction healing (Fig. 10; see also Gratier et al. Reference Gratier, Favreau and Renard2003). Such healing imposes a gain in fault rock strength, which controls type and degree of deformational overprint during the next deformation episode (Fig. 10). The cyclical interaction between brittle deformation and healing shows the dynamics of the maximum strength inside such fault zones. The schematic summary of the presented field data indicates a cyclical behaviour including different speeds and different time intervals (Fig. 10).
With regard to (3), An additional important aspect of the comparison between the different tectonites in this study is their spatial relationships within the fault architecture. One aspect of the spatial relationship is related to the different scales (Fig. 10). The sizes of high- and low-strain domains vary, which can be well shown by comparing large-scale drone images (Fig. 4a), local drone images (Fig. 4b), outcrops (Fig. 5a) and thin-sections (Fig. 10a, b). Another aspect is the geometry of different deformation structures developing with time at different locations (Fig. 4). The cockade-bearing tectonites represent small areas in fault linkage zones of fractures or cataclasites. In the presented medium-scale example in Fig. 4b, most of the fractures are oriented at a ∼45° angle with respect to the major deformation zone. The fractures and cockade-bearing tectonites are in a primary orientation parallel to σ1. This is supported by the youngest preserved open fracture generation. However, at locations other than the mapping site, cockade-bearing tectonites sometimes show additional deformational overprint. Most obvious are evidences for multiple stages of overprinting, as for example demonstrated by the occurrence of cataclasites within cataclasites (Figs 6a, 10; Hofmann et al. Reference Hofmann, Helfer, Diamond, Villa, Frei and Eikenberg2004; Belgrano et al. Reference Belgrano, Berger and Herwegh2016). Such overprinting relationships are found at all scales ranging from km down to mm.
In summary, the dilatant linkage zones are preferential sites for high volume/mass gain and, therefore, also for enhanced fluid flow. Shear fractures with low volume gain being oriented sub-parallel to the main fault boundaries may be mechanically weak over long time intervals, and therefore will most likely be reactivated. This repeating deformation produces highly comminuted cataclasites or gouges (Fig. 10). In this respect, grain-size reduction processes are inversely proportional to a mass/volume gain. Future studies on comminution of cataclasites should include more detailed geometric characterizations of fault zone architecture in order to address the different processes of particle size reduction. Potential microstructural relationships may allow for a better differentiation between comminution of a single, fast-rate, seismic high-strain event and comminution during multiple repeating slow-rate (aseismic) and low-strain events. In this context, the well-investigated role of healing (and related mechanical strengthening) strongly depends on the position inside any fault zone in dependence of the scale investigated.
6.d. Relevance for hydrothermal systems and regional fault evolution
In terms of the regional geological relevance, the tube-like structures of cockade-bearing tectonites and cataclastic bands of the GBF are overprinting a pre-existing crustal-scale ductile shear zone (e.g. Wehrens et al. Reference Wehrens, Berger, Peters, Spillmann and Herwegh2016, Reference Wehrens, Baumberger, Berger and Herwegh2017; Herwegh et al. Reference Herwegh, Kissling, Baumberger, Berger, Wangenheim, Wehrens, Glotzbach and Mock2020). Primarily the change from ductile-dominated shearing along several mylonitic strands to the much more localized brittle GBF relates to a change in deformation mechanisms and their interplay with fluids during progressive exhumation-induced cooling (e.g. Herwegh et al. Reference Herwegh, Kissling, Baumberger, Berger, Wangenheim, Wehrens, Glotzbach and Mock2020). With embrittlement and associated increase in volumetric strain within the studied fault rocks, enhanced vertical fluid flow allows mass and heat transfer since at least 3.4 Ma (Hofmann et al. Reference Hofmann, Helfer, Diamond, Villa, Frei and Eikenberg2004). In particular, the cockade-bearing tectonites represent the first-order structures for such enhanced flow properties, owing to their enhanced open porosity. In cataclasites, by contrast, small-sized pores are more prone to earlier clogging by cementation. Nonetheless, their mutual geometric and mechanical interaction is necessary to maintain crustal-scale hydrothermal fluid circulation. Based on low-temperature apatite thermochronology, Berger et al. (Reference Berger, Egli, Glotzbach, Valla, Pettke and Herwegh2022) unravelled stages of variable fluid activity along individual fault strands in time. The activity of such different strands of the recent geothermal systems supports the cyclical and overprinting relationships in the different fault rocks observed in the current study (Fig. 10). Moreover, the currently active hydrothermal system gives some insights into the time frame of such hydrothermal systems. The combination of water chemistry and fluid-flow modelling indicates a duration in the range of 30 000 years between infiltration and discharge of the initial meteoric water (Waber et al. Reference Waber, Schneeberger, Mäder and Wanner2017; Diamond et al. Reference Diamond, Wanner and Waber2018). Isotope data of the hydrothermal system indicate an activity over at least the last 3.4 Ma (Hofmann et al. Reference Hofmann, Helfer, Diamond, Villa, Frei and Eikenberg2004), which is two orders of magnitude longer than estimated for the aforementioned individual 30 ka fluid cycle. Both the investigated different exhumed fault rocks and the active hydrothermal system illustrate the changing interplay between embrittlement, fluid flux and precipitation. In this light, hydrothermal fluid flux can be dynamically preserved over millions of years along the same fault structures, although individual fluid pathways locally change in space with time (Fig. 10).
7. Conclusion
The investigated GBF consists of fault segments which contain three main tectonite types: cockade-bearing tectonites, fault gouges and cataclasites. Their mechanical behaviour is based on interactions between comminution, grain growth and healing processes. The latter occurs via mineral precipitation, as manifested by gaining of mass and locally also of volume (mainly in extensional linkage zones of the strike-slip fault system). The increase of masses develops progressively from gouges over cataclasites to cockade-bearing tectonites. In this sequence also, volumetric strain evolves. In terms of a fault’s architecture, the highest volumetric strain occurs in dilational linkage zones of the GBF, which are also the dominant locations of appearance of the cockade-bearing tectonites (Berger & Herwegh, Reference Berger and Herwegh2019; Figs 3, 9). The increasing volume is related to high fracture porosity. This allows locally high fluid/rock ratios and precipitation processes, which are most pronounced in the cockade-bearing tectonites. Contrastingly the cataclasites show lower amounts of cements, which in the case of the fault gouges are only very minor. This may be related to a higher shear component compared to the cockade-bearing tectonite, since simple shear allows only minor local volume gain, in contrast to mode one fracturing. The differences in cementation between cataclasites and gouges are attributed to differences in the solubilities and stabilities of minerals at the different crustal levels of the active fault structures. On a long-term view, the precursor local frictional behaviour and subsequent precipitation influence the strength of the fault rock at a peculiar stage of fault activity and therefore also the episodic locking/reactivation of specific fault strands. Such sequences demonstrate the importance of the understanding of the fault architecture for fault rocks throughout all scales (e.g. Shipton et al. Reference Shipton, Evans and Thompson2005; Caine et al. Reference Caine, Bruhn and Forster2010; Masoch et al. Reference Masoch, Fondriest, Preto, Secco and Di Toro2019; Holdsworth et al. Reference Holdsworth, Trice, Hardman, McCaffrey, Morton, Frei and Rogers2020).
Supplementary material
To view supplementary material for this article, please visit https://doi.org/10.1017/S0016756822000218
Acknowledgements
We thank F. Nyffenegger for the careful sieving. D. Egli and T. Belgrano are acknowledged for fruitful discussions about the GBF and their enthusiastic support during sampling. H. Stünitz gave input on an earlier version of the manuscript. This project is part of the NRP70 programme during which drilling was funded by the Swiss National Science Foundation (grant no. SNF-153889). We thank the three anonymous reviewers and the guest editor O. Lacombe for their helpful and constructive comments.


