


Early life adversity (ELA) has been associated with long-term endocrine, immune, and behavioral effects and an increased risk of pathologies in adult life. We and others have identified an ELA immune phenotype, characterized by inflammation and immunosenescence, which may mediate the association of ELA and the risk of diseases (Elwenspoek, Hengesch, et al., Reference Elwenspoek, Hengesch, Leenen, Schritz, Sias, Schaan and Muller2017; Elwenspoek, Kuehn, Muller, & Turner, Reference Elwenspoek, Kuehn, Muller and Turner2017; Elwenspoek, Sias, et al., Reference Elwenspoek, Sias, Hengesch, Schaan, Leenen, Adams and Turner2017). ELA concurrently increases the incidence of a wide spectrum of stress-related disorders (Batten, Aslan, Maciejewski, & Mazure, Reference Batten, Aslan, Maciejewski and Mazure2004; McCauley et al., Reference McCauley, Kern, Kolodner, Dill, Schroeder, DeChant and Bass1997), implying a pathophysiological role for the hypothalamic-pituitary-adrenal (HPA) axis and potentially the autonomic nervous system (ANS). This has led to the suggestion that HPA axis functioning may link ELA to impaired adult health (Barton, Zakreski, & Pruessner, Reference Barton, Zakreski and Pruessner2016). This raises the question as to whether the immune phenotype is a direct result of ELA or an indirect consequence of dysregulated GC levels and GR signaling.
Stress signals are processed by higher brain regions that stimulate the hypothalamus to release corticotropin-releasing hormone (CRH). Corticotropin-releasing hormone, in turn, activates the pituitary gland to release adrenocorticotropic hormone (ATCH), which stimulates synthesis and release of GCs from the adrenal gland. This cascade of events is called the HPA axis, which closely interacts with the immune system. The glucocorticoid receptor (GR) is constitutively expressed and resides in the cytosol bound to a chaperone protein complex. Upon GC binding, the GR translocates to the nucleus, where it influences transcription (Oakley & Cidlowski, Reference Oakley and Cidlowski2013). HPA axis activation modulates immune function by affecting gene transcription and reducing immune cell trafficking to sites of inflammation, leading to an overall inhibition of the inflammatory response (Cain & Cidlowski, Reference Cain and Cidlowski2017). Early life adversity has been associated to both higher levels of inflammation (Baumeister, Akhtar, Ciufolini, Pariante, & Mondelli, Reference Baumeister, Akhtar, Ciufolini, Pariante and Mondelli2016) and HPA axis dysregulation, such as altered epigenetic regulation of the GR gene and GR signaling affecting GR sensitivity (Koss & Gunnar, Reference Koss and Gunnar2018).
The GR is encoded by the NR3C1 gene, containing eight coding exons (2–9) and nine noncoding alternative first exons (1A–1J, excluding G). The first exons are located at the gene promoter and play an important role in GR regulation. A growing body of data from animal and human studies suggests an association between ELA and epigenetic modulation of the NR3C1 gene (Turecki & Meaney, Reference Turecki and Meaney2016). Early life adversity has been associated with differential DNA methylation levels at the 1B, 1C, 1D, 1F, and 1H promoter regions in human studies (reviewed in Palma-Gudiel, Cordova-Palomera, Leza, & Fananas, Reference Palma-Gudiel, Cordova-Palomera, Leza and Fananas2015). Although the numerous studies are not fully concordant, one of the more consistent findings is hypermethylation of the 1F promoter and/or exon in association with ELA (Martin-Blanco et al., Reference Martin-Blanco, Ferrer, Soler, Salazar, Vega, Andion and Pascual2014; Perroud et al., Reference Perroud, Paoloni-Giacobino, Prada, Olie, Salzmann, Nicastro and Malafosse2011; Romens, McDonald, Svaren, & Pollak, Reference Romens, McDonald, Svaren and Pollak2015; Tyrka, Price, Marsit, Walters, & Carpenter, Reference Tyrka, Price, Marsit, Walters and Carpenter2012; van der Knaap et al., Reference van der Knaap, Riese, Hudziak, Verbiest, Verhulst, Oldehinkel and van Oort2014). The first exons are transcribed to mRNA in a tissue-specific manner, but they are not translated into protein (Palma-Gudiel et al., Reference Palma-Gudiel, Cordova-Palomera, Leza and Fananas2015; Turner & Muller, Reference Turner and Muller2005). Exons 1F and 1H are of special interest because they are expressed in both hippocampus and in immune cells (Turner & Muller, Reference Turner and Muller2005). Increased methylation of the GR promoter has been associated with lower levels of total GR expression in hippocampal tissue (McGowan et al., Reference McGowan, Sasaki, D'Alessio, Dymov, Labonte, Szyf and Meaney2009), peripheral blood (Labonte, Azoulay, Yerko, Turecki, & Brunet, Reference Labonte, Azoulay, Yerko, Turecki and Brunet2014; Perroud et al., Reference Perroud, Rutembesa, Paoloni-Giacobino, Mutabaruka, Mutesa, Stenz and Karege2014), and saliva (Vukojevic et al., Reference Vukojevic, Kolassa, Fastenrath, Gschwind, Spalek, Milnik and de Quervain2014). However, few studies have investigated the relationship between methylation levels at specific first exons and the corresponding transcripts (Cao-Lei et al., Reference Cao-Lei, Leija, Kumsta, Wust, Meyer, Turner and Muller2013).
The GR plays a crucial role in the negative feedback of the HPA axis (Figure 1). The sensitivity of this feedback mechanism, which appears to be altered after ELA (Koss & Gunnar, Reference Koss and Gunnar2018), is largely determined by GR levels and further fine-tuned by the FK506 binding protein 51 (FKBP5), a co-chaperone of the GR that reduces the affinity of the receptor for GCs. Demethylation of FKBP5 has been found in ELA (Klengel et al., Reference Klengel, Mehta, Anacker, Rex-Haffner, Pruessner, Pariante and Binder2013), which—together with increased methylation of the GR—promotes GC resistance, where despite elevated GC levels, the GR does not induce the anticipated response and impairs the negative feedback loop of the HPA axis. Glucocorticoid receptor resistance in immune cells leads to excessive immune activation and may exacerbate inflammation (Baumeister et al., Reference Baumeister, Akhtar, Ciufolini, Pariante and Mondelli2016).
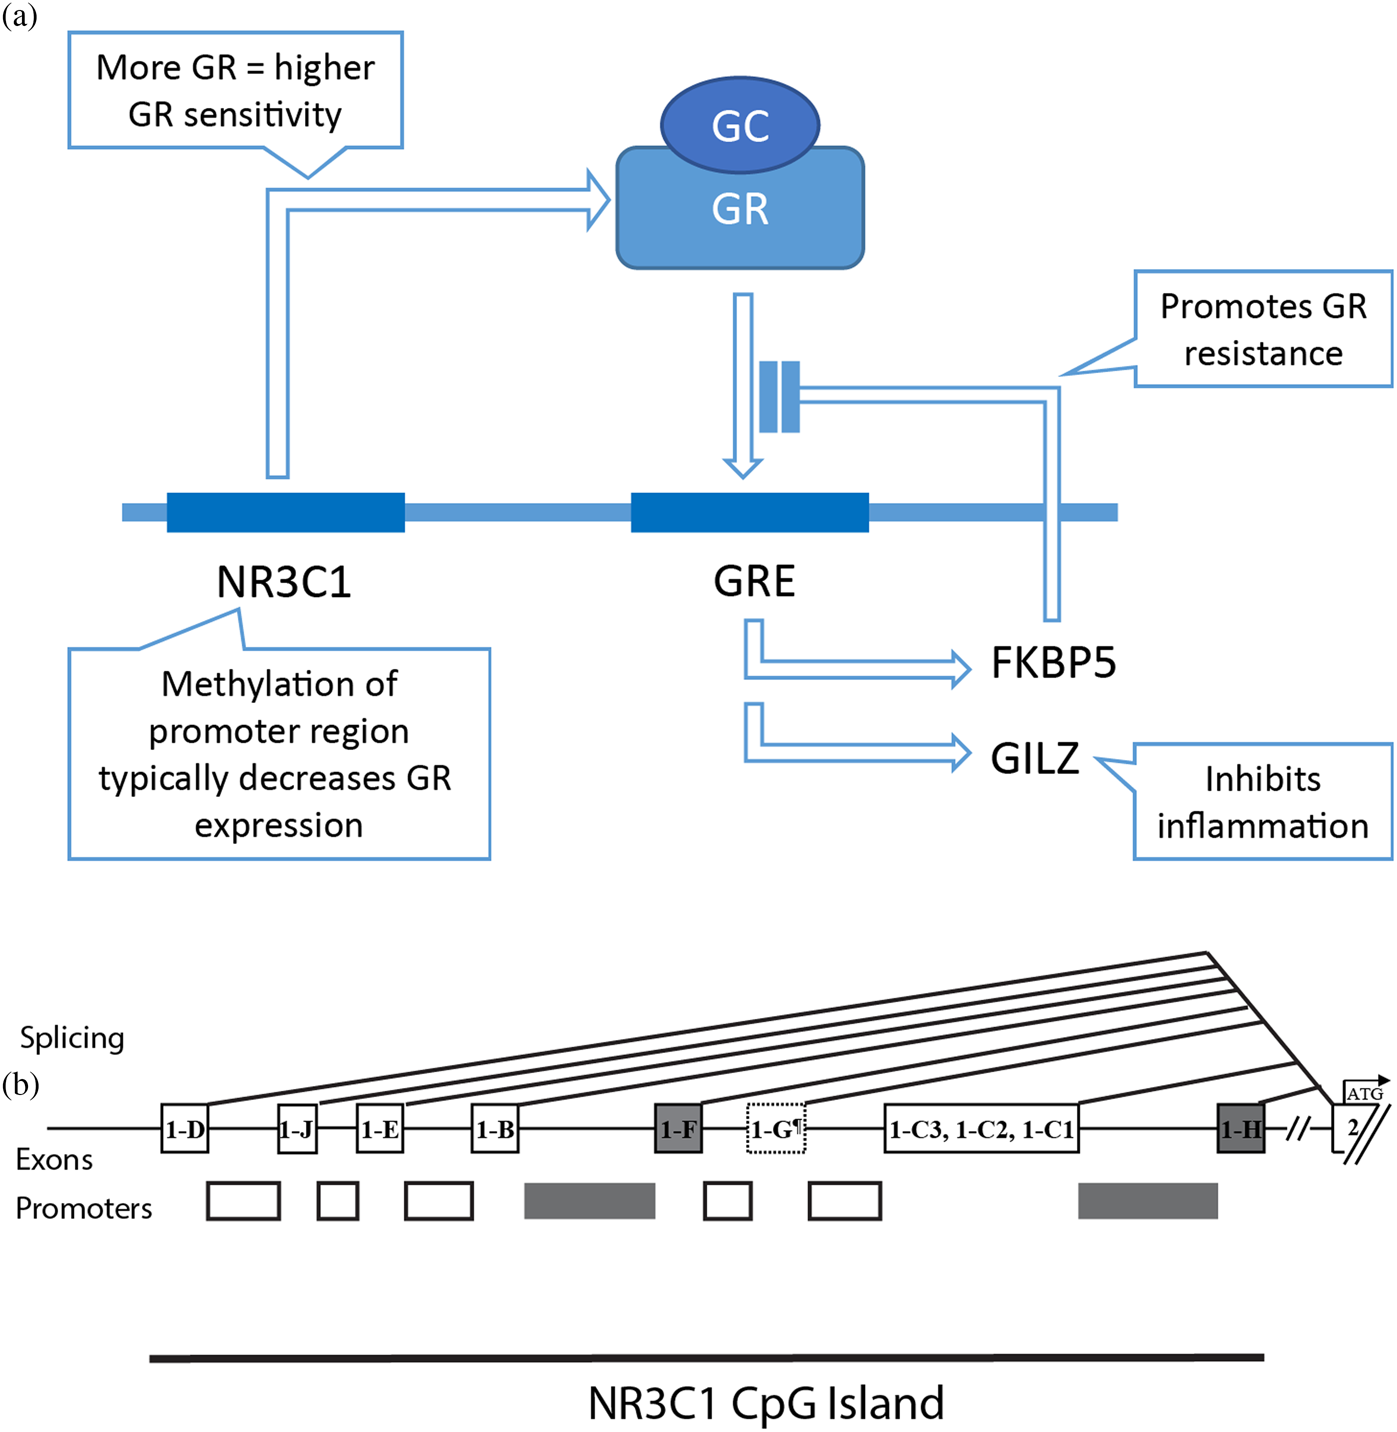
Figure 1. The glucocorticoid receptor (GR): structure and signaling. (A) schematic representation of transcription / translation of the NR3C1 gene producing active GR, its activation upon ligation of GC, and transcription of FKBP and GILZ after binding to genomic GREs. (B) schematic representation of the NR3C1 gene. and the promoter / first exon region studied here (dark boxes). Abbreviations: GC, Glucocorticoid; GR, Glucocorticoid Receptor; NR3C1, GR, gene; GRE, Glucocorticoid Response Elements; FKBP5, FK506 Binding Protein 51; GILZ, glucocorticoid-Induced Leucine Zipper.
Another GR target gene is the glucocorticoid-induced leucine zipper (GILZ), which is thought to mediate the anti-inflammatory effects of GCs. The glucocorticoid-induced leucine zipper antagonizes the NFκB pathway—a major cell signaling pathway involved in immune activation (Ronchetti, Migliorati, & Riccardi, Reference Ronchetti, Migliorati and Riccardi2015). Induced NFkB activity has been found in ELA (Pace et al., Reference Pace, Wingenfeld, Schmidt, Meinlschmidt, Hellhammer and Heim2012), although it is still unclear if this can be explained by upstream differences in GILZ expression levels.
This study is based on our EpiPath cohort that consists of young adults who experienced ELA in the form of separation from their parents and/or institutionalization followed by adoption in early childhood and controls reared by their biological parents. As anticipated, this cohort had an inhibited HPA axis reactivity with a lower corticosterone response to a laboratory stressor, although cardiovascular stress responsiveness was not affected by ELA (Hengesch et al., Reference Hengesch, Elwenspoek, Schaan, Larra, Finke, Zhang and Schachinger2018). This separation is most probably explained by ELA's selectively enhancing central feedback-sensitivity to GC, while the cardiovascular/ autonomic stress reactivity was preserved (Hengesch et al., Reference Hengesch, Elwenspoek, Schaan, Larra, Finke, Zhang and Schachinger2018). Our studies of the EpiPath cohort were the first to report on a broad range of immune markers covering the innate, humoral, and adaptive immune system following ELA. Although we did not observe high levels of circulating classical inflammation markers, there was a relative increase in proinflammatory T cells, particularly in an activated and senescent state, expressing HLA-DR/CD25 and CD57, and there was a trend toward elevated numbers of Th17 cells. (Elwenspoek, Hengesch, et al., Reference Elwenspoek, Hengesch, Leenen, Schritz, Sias, Schaan and Muller2017; Elwenspoek, Sias, et al., Reference Elwenspoek, Sias, Hengesch, Schaan, Leenen, Adams and Turner2017). Differences became greater in later differentiation stages, such as effector memory and terminally differentiated effector memory cells re-expressing CD45RA (TEMRA) cells. Furthermore, our data did not identify any changes in humoral immunity. There was however, a trend to an increased incidence of allergies in our cohort. There were no differences in B cell activation, measured as the expression of activation markers CD25, CD69, and CD11a (Elwenspoek, Hengesch, et al., Reference Elwenspoek, Hengesch, Leenen, Schritz, Sias, Schaan and Muller2017; Elwenspoek, Sias, et al., Reference Elwenspoek, Sias, Hengesch, Schaan, Leenen, Adams and Turner2017). Overall, data from the EpiPath cohort suggest that ELA programs immune cells, leading to a long-term shift in T cell differentiation and activation status toward a more proinflammatory phenotype. Although there were no differences in either telomere length or methylation levels at age-related CpGs, the increase in senescent EM and TEMRA cells was associated with cytomegalovirus infection (CMV) infection and CMV antibody titres. Recently, these observations were confirmed in an independent cohort, where CMV infection was associated with an almost identical immunophenotype approximately 15 years postinstitutionalization and adoption (Reid et al Reference Reid, Coe, Doyle, Sheerar, Slukvina, Donzella and Gunnar2019). Furthermore, lifelong, latent CMV infection occurs in a small percentage of hematopoietic progenitor cells (Slobedman, et al., Reference Slobedman, Stern, Cunningham, Abendroth, Abate and Mocarski2004), and it has significant effects on GR transcription and translation (Wang et al., Reference Wang, Dou, Yang, Ni, Zhang and Qian2017).
We hypothesized that the immunophenotype observed in out EpiPath cohort was a consequence of either the altered HPA axis or CMV-induced GR changes, either due to altered GC secretion or to functional changes in the GC-GR interaction. We examined GR signaling in peripheral leukocytes in our EpiPath cohort. Glucocorticoid sensitivity and GR resistance was measured as the IC50 of dexamethasone inhibition of IL-6 secretion after polyclonal stimulation. Glucocorticoid receptor functionality was measured by the ability of GC to induce GR target gene expression, and the transcriptional regulation of the GR was measured by qPCR and quantitative pyrosequencing of the NR3C1 promoters 1F and 1H. The link between NR3C1 promoter methylation and the expression of the associated transcripts was assessed to ensure that the link was maintained, and not perturbed by other transcriptional mechanisms.
Material and Methods
Subject Enrollment
The EpiPath cohort, as previously described (Elwenspoek, Hengesch, et al., Reference Elwenspoek, Hengesch, Leenen, Schritz, Sias, Schaan and Muller2017; Elwenspoek, Sias, et al., Reference Elwenspoek, Sias, Hengesch, Schaan, Leenen, Adams and Turner2017), consists of participants between 18 and 35 years of age with or without ELA. Early life adversity was defined as “separation from parents in early life and subsequent adoption.” While the majority of the ELA participants had been exposed to the additional stress of institutionalization, four participants were adopted from foster or birth families. Age at adoption is proportional to the time spent in adverse conditions prior to adoption, and it has been associated with worse long-term ELA outcomes, so it is a reasonable proxy for ELA severity (Drury et al., Reference Drury, Theall, Gleason, Smyke, De Vivo, Wong and Nelson2012; Hodel, Hunt, Cowell, Van Den Heuvel, Gunnar, Reference Hodel, Hunt, Cowell, Van Den Heuvel, Gunnar and Thomas2015). This study was approved by the National Research Ethics Committee (CNER, No 201303/10 v1.4) and the Ethics Review Panel (ERP, University of Luxembourg, No 13-002), and written informed consent was obtained from all participants, in compliance with the Declaration of Helsinki. The participants were compensated for the inconvenience and their time.
Study Protocol
Participants were invited to two laboratory visits. Participants were requested to refrain from smoking and physical exercise, avoid caffeinated drinks (>1h) or alcohol (>24h) prior to visit 1. All women were either using hormonal contraceptives or were in the luteal phase of the menstrual cycle. At approximately 11:30 a.m. an indwelling cannula was inserted and the first blood samples were collected in sodium heparin and EDTA anticoagulated tubes, for the ex vivo stimulating experiments and isolation of DNA and RNA, respectively. At visit 2, participants filled out the childhood trauma questionnaire (CTQ; Klinitzke, Romppel, Hauser, Brahler, & Glaesmer, Reference Klinitzke, Romppel, Hauser, Brahler and Glaesmer2012), and they were asked about their age at adoption if applicable.
GR methylation
Automated genomic DNA (gDNA) extraction was performed on a QIAcube on 200μl of whole blood using the QIAamp DNA Mini and Blood Mini (Qiagen, Venlo, Netherlands). Subsequently, 500ng gDNA was bisulfite-converted using the EZ DNA Methylation-Gold Kit (Zymo, Freiburg, Germany) according to the manufacturer's instructions. The NR3C1 promoter regions were biotin-labeled in a 50μl amplification reaction containing 20mM Tris-HCl (pH 8.4), 50mM KCl, 200mM deoxynucleoside triphosphates (dNTPs), 1× concentrated SYBR Green (Cambrex, Verviers, Belgium), 1× concentrated Platinum Taq DNA polymerase (Invitrogen, Erembodegem, Belgium), as well as primers and MgCl2 (Supplementary Table 1). Thermocycling was performed on a BioRad CFX96 thermal cycler for 45 cycles with initial denaturation of 95°C for 2 min, 95°C for 20s, annealing for 20s and 72°C for 20s, with a final elongation for 10 min at 72°C. Biotin-labeled amplicons were pyrosequenced as previously described (Cao-Lei et al., Reference Cao-Lei, Suwansirikul, Jutavijittum, Meriaux, Turner and Muller2013). All PCR and pyrosequencing primers are given in Supplementary Table 1.
GR and GR-target genes mRNA expression
Total RNA was isolated using the RiboPure RNA Purification—Blood kit according to the manufacturer's instruction (Fisher Scientific, Aalst, Belgium). First strand cDNA synthesis was carried out at 50°C for 60 min in a 20uL reaction containing 200ng/mL RNA, 250mM Tris-HCl (pH 8.3), 375mM KCl, 15mM MgCl2, 0.2mM of dithiothreitol (DTT), 10mM of deoxynucleoside triphosphate (dNTPs), 40U RNase OUT (Invitrogen, Carlsbald, USA), 200U SuperScript III Reverse Transcriptase (Invitrogen), and 0.50uM dT(20) primers.
To assess the mRNA levels of FKBP5, GILZ, total GR (Exon 3/4), GR transcript variants (1F and 1H), and of three housekeeping genes: β-actin, glyceraldehyde-3-phosphate dehydrogenase (GAPDH), and peptidylprolyl isomerase A (PPIA), cDNA was amplified by real time quantitative PCR (RT-qPCR) in 25uL reactions containing 200mM Tris-HCl (pH 8.4), 500mM KCl, 200 uM dNTPs, 1× concentrated SYBR Green (GelStar Nucleic Acid Gel Stain, Lonza, BioWhittaker, Versviers, Belgium), 1× Platinum Taq DNA polymerase (Invitrogen). Temperature, primer, and MgCl2 concentrations were optimized per primer pair (for PCR conditions and primer sequences see Supplementary Table 2). Each plate included a cDNA pool of thirteen individuals from the cohort as positive control and a no template control. All samples were assayed in duplicate.
Thermal cycling (CFX96, BioRad, Hercules, CA, USA) conditions were as follows: denaturation at 95°C for 2 min; 44 cycles of denaturation at 95°C for 20s, annealing at respective temperatures (see Supplementary Table 2) for 30s, and elongation at 72°C for 30s; final elongation at 72°C for 2.5 min. Ratios of all housekeeping genes were calculated to identify the most stable gene in our sample. The comparative cycle threshold (Ct) method was used to calculate the relative target gene expression (2−ΔΔCt), using the positive control as reference sample and GAPDH as reference gene (Schote, Turner, Schiltz, & Muller, Reference Schote, Turner, Schiltz and Muller2007).
GR sensitivity assay
To determine GR sensitivity, whole blood from participants was stimulated with the cell-type specific stimuli phytohemagglutinin (PHA; T cells), pokeweed mitogen (PWM; B cells), and lipopolysaccharide (LPS; B cells and monocytes). The concentration of dexamethasone that was needed to achieve a 50% inhibition of IL-6 production was used as a measure of GR resistance Whole blood was stimulated with either 0.5μg/mL PWM, 2 μg/mL PHA-M (PHA) or 5ng/ml LPS from Escherichia coli 0111:B4 (Sigma-Aldrich, Overijse, Belgium) in the presence of a 10−5–10−10 M titration of dexamethasone (Sigma-Aldrich). After 19 h of incubation at 37°C, 5% CO2, 95% humidity, supernatants were harvested and immediately frozen at -80°C. IL-6 secretion was measured using the Human IL-6 ELISA Set in a 1:50 dilution (BD OptEIA, Erembodegem, Belgium). IC50 values of dexamethasone inhibition of IL-6 secretion—a measure of GR resistance—were calculated with the Hill-equation using SigmaPlot (version 12.3, Systat Software, San Jose, CA).
Statistical Analysis
As this study was performed on a pre-existing cohort, the minimum difference of means detectable for alpha = 0.05 and power = 0.8 taking into consideration the multiple testing correction within each set of analyses was calculated a priori based on our previous data. Cohen d was calculated for all multiple testing corrected tests and was below 0.32 (a “small” effect size), corresponding to a difference in means of 1.8% (DNA methylation), 4.2 fold difference (gene expression), and 2.7 × 10⁻⁷M difference in IC50. To investigate statistical group differences, Student t-tests or Wilcoxon rank-sum tests were used for numerical variables, and chi-square tests were used for categorical variables. Whenever necessary, variables were log-transformed to obtain a normal distribution. The Kolmogorov-Smirnov test was used to assess deviations from normality (skewness), and all data was p > 0.05. To identify variables that affected GR sensitivity, least absolute shrinkage and selection operator (LASSO) linear regression was used as previously reported (Elwenspoek, Hengesch, et al., Reference Elwenspoek, Hengesch, Leenen, Schritz, Sias, Schaan and Muller2017). Variables with nonzero estimates were retained and used to build multivariable linear regression models. Correlations between data were estimated with the Spearman rank-order correlation test. For all correlations, methylation data, and demographics, p-values were corrected within each analysis series with the Benjamini-Hochberg procedure (Benjamini & Hochberg, Reference Benjamini and Hochberg1995). All statistical tests were performed in R (version 3.3.2; R Core Team, 2016).
Results
Participant Characteristics
Participant characteristics of the whole EpiPath cohort (n = 112) that was used for the measurements of GR methylation and expression levels are depicted in Table 1. Control and ELA groups were similar with respect to sex and CTQ scores (p > 0.1), there were differences at the trend level in age, smoking status, and body mass index, (p > 0.05), and these were subsequently included as covariates in the GR sensitivity analyses.
Table 1. Demographics of the EpiPath cohort

1F and 1H GR DNA Methylation Levels
We determined DNA methylation levels at 22 CpGs within the 1F exon and promoter and at 35 CpGs within the 1H promoter region (Figure 2). Overall methylation levels over the 1F and 1H regions (sum of single CpGs) were similar between groups. However, when examining methylation at the single CpG level, minor differences emerged in the GR 1H promoter region. At CpG position 1 and 53, ELA showed significant lower (Wilcoxon rank-sum test, p = 0.023) and higher methylation levels (Wilcoxon rank-sum test, p = 0.047), respectively. Furthermore, we identified a region at the start of the 1H promoter containing 9 CpGs that showed overall lower methylation levels (sum) in ELA (Wilcoxon rank-sum test, p = 0.021).
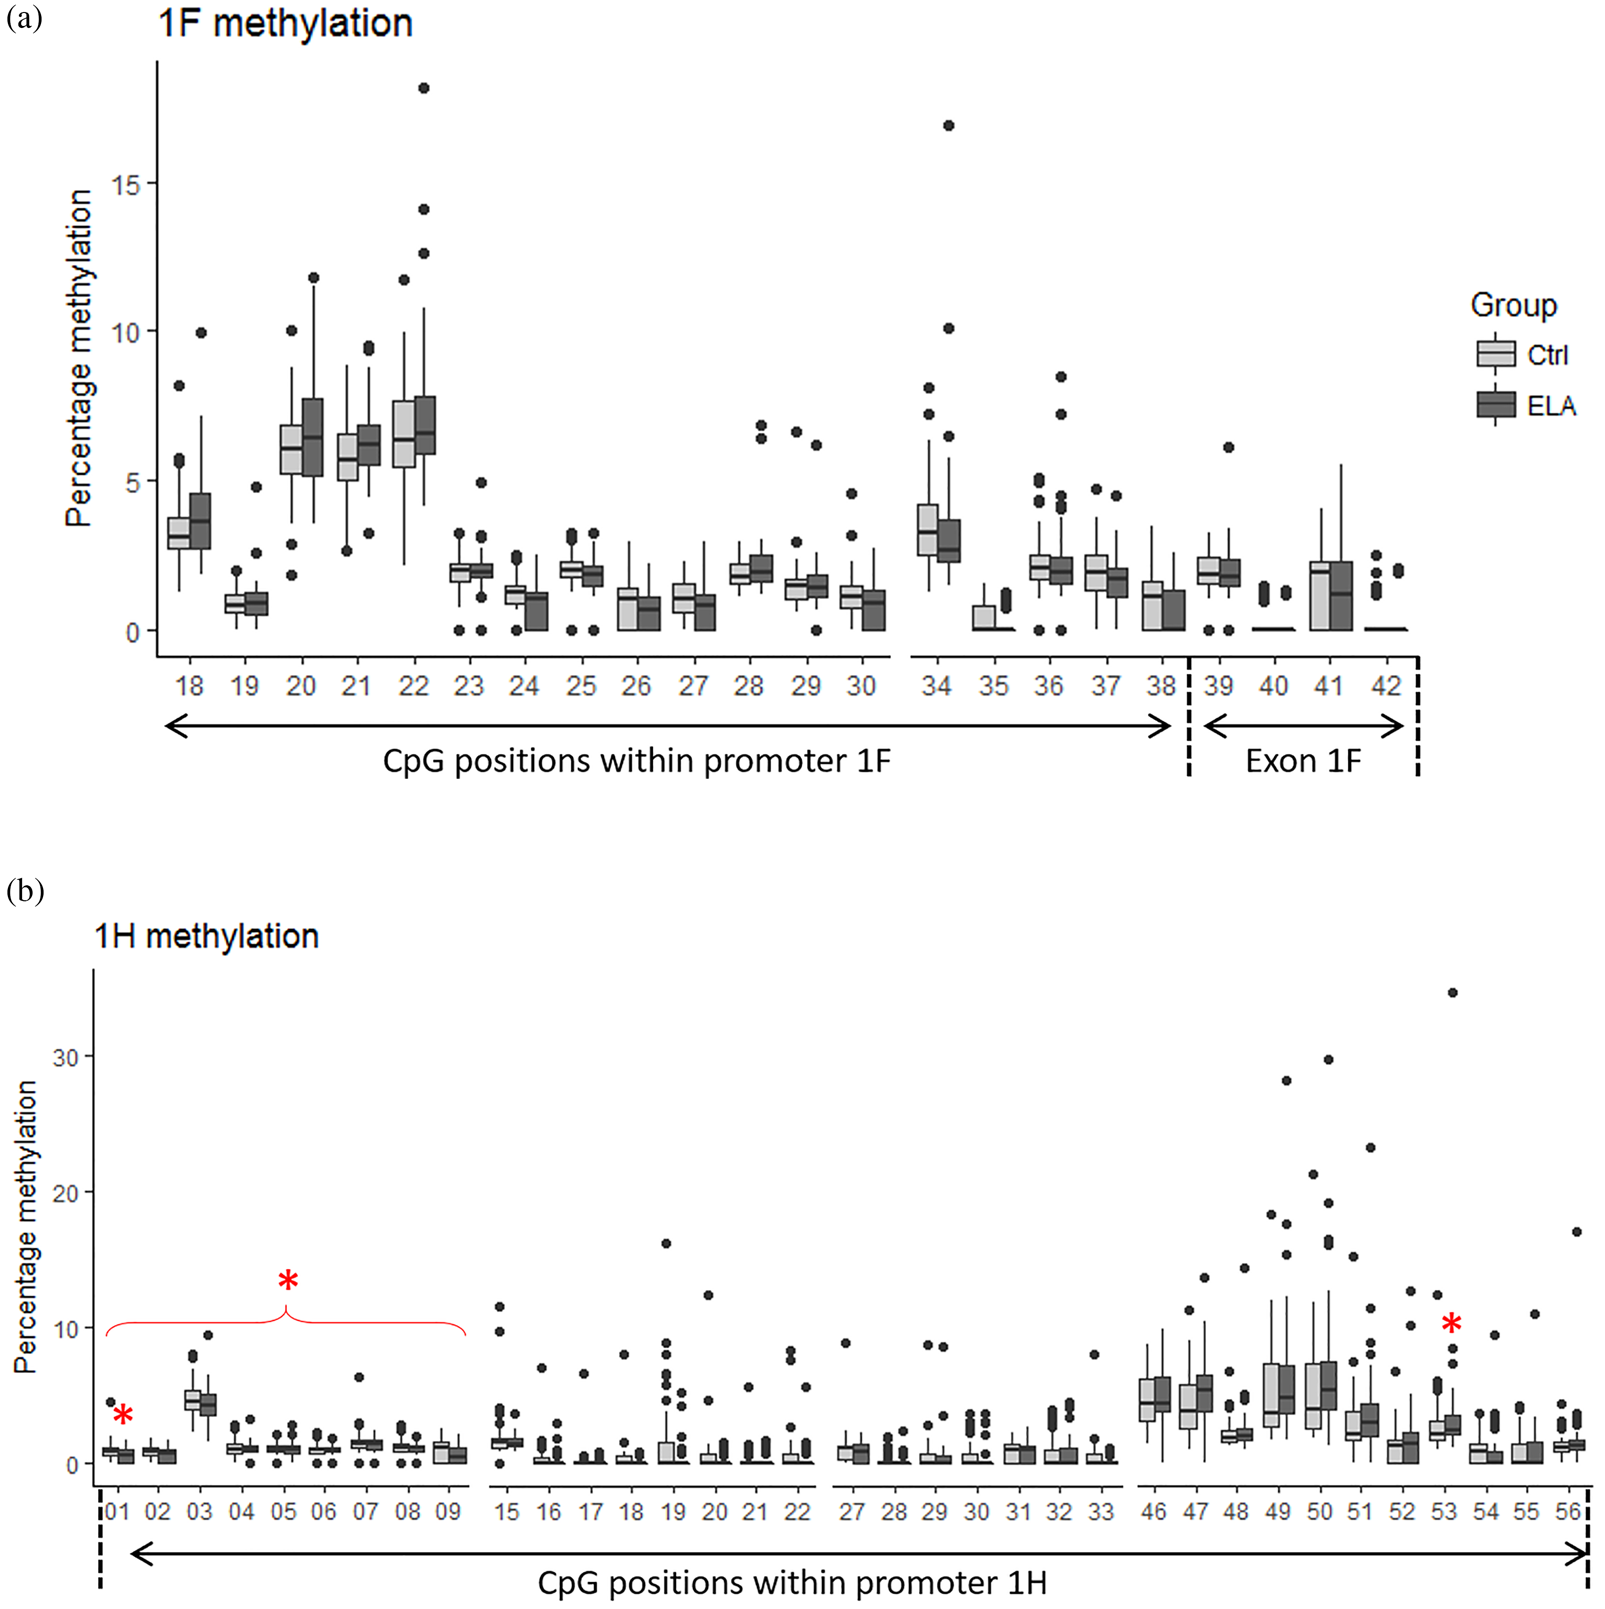
Figure 2. GR DNA methylation levels measured by quantitative pyrosequencing in Control (light grey) and ELA (dark grey) participants in the two first exon promoter regions: 1F (A) and 1H (B). Data are the median (central line), 25th and 75th percentile (upper and lower box limits), 2.5th and 97.5th percentiles (whiskers), and outliers (individual points).
Relative Transcription Levels of GR and GR Target Genes FKBP5 and GILZ
To investigate the influence of these methylation differences on GR signaling, relative expression levels of total GR, 1F, and 1H transcripts and the two GR target genes were examined in whole blood. Messenger RNA levels of Total GR, exon 1F and 1H transcripts, as well as the two target genes were similar between ELA and controls (p > 0.05, Figure 3a). Our data showed high intercorrelation between 1F and 1H transcripts (Figure 3), suggesting that first exon expression levels are coregulated as previously reported (Cao-Lei et al., Reference Cao-Lei, Leija, Kumsta, Wust, Meyer, Turner and Muller2013). As FKBP5 is one of the target genes of the GR, we expected a positive association between FKBP5 expression and GR mRNA levels. Indeed, FKBP5 expression was significantly correlated with total GR, 1F, and 1H transcripts (Spearman's rank correlation, p < 0.001), with the strongest correlation with 1F transcripts (rho = 0.74, p < 0.001; Figure 3b). Also GILZ, another GR target gene, was significantly correlated with all three GR transcripts (Spearman's rank-order correlation, p < 0.05), although the correlations were less strong (Figure 3b). The GILZ target gene was most strongly related to 1H transcripts (rho = 0.26, p = 0.010; Figure 3b).

Figure 3. Transcription levels of GR and GR target genes FKBP5 and GILZ (A) and correlation matrix between all four mRNA transcripts (B). All expression levels are relative to a housekeeping gene expression (2−ΔΔCt relative fold gene expression). Statistics: Spearman rank-order correlations. Spearman rho values according to the color scale after Benjamini-Hochberg false discovery rate correction. *p < 0.05 **p < 0.01 ***p < 0.001.
Associations between mRNA Expression and Methylation Levels at Single CpGs Across Groups
As there were no significant group differences at the transcriptional level, we examined the link between promoter methylation and transcript expression in the overall sample to ensure that this previously reported link was maintained. Overall methylation levels over the 1F and 1H regions (sums) were not related to mRNA expression of the GR or target genes. However, when examined on single CpG level, weak correlations between 1F methylation levels and relative expression of 1F, 1H, FKBP5, and GILZ became apparent (Figure 4a). The first 5 CpGs of the 1F region are positively correlated with transcription of all four mRNA transcripts (sum of position 18-22: 1F rho=0.20, p=0.053; 1H rho=0.22, p=0.026; FKBP5 rho=0.22, p=0.022; GILZ rho=0.22, p=0.025), whereas from position 36-42 methylation levels were negatively correlated with transcription (sum of positions 36-42: 1F rho=−0.32, p=0.002; 1H rho=−0.36, p<0.001; FKBP5 rho=−0.24, p=0.012). Figure 4b shows correlations between 1H methylation levels and relative expression of 1F, 1H, FKBP5, and GILZ. Surprisingly, our data show that the region at the end of 1H (position 47-55) is positively correlated with the expression of FKBP5 (rho=0.35, p<0.001), 1F (rho=0.41, p<0.001), and 1H (rho=0.30, p=0.002) transcripts. Positions 1-32 seem to be negatively correlated with all four mRNA transcripts (sum position 1–32: 1F rho = -0.33, p = 0.001; 1H rho = -0.36, p < 0.001; FKBP5 rho = -0.26, p = 0.007, GILZ rho = -0.21, p = 0.038).

Figure 4. Methylation-expression correlation matrix between methylation levels at single CpGs in the GR 1F (A) and GR 1H (B) promoter regions and relative mRNA expression of GR and GR target genes. Statistics: Spearman rank-order correlations. Rho values according to the color scale after Benjamini-Hochberg false discovery rate correction. *p < 0.05 **p < 0.01 *** p < 0.001.
GR sensitivity
For all three stimuli, IL6 levels were lower in ELA than in controls, irrespective of the dexamethasone concentration, although only significant for a limited number of conditions (Figure 5). IC50s were calculated for all participants. There was no group effect on IC50, although there was a strong trend towards a lower IC50 in the ELA group after LPS stimulation (p = 0.051; Figure 5F), suggesting that GC/GR signaling remains unaffected in T cells, B cells, and potentially monocytes after ELA. When data was reanalyzed in multivariate linear models, the trend remained the same and none of the exploratory variables such as age, smoking, and BMI were significant in the model, and they did not improve the overall test statistic. Although there was not a major effect of ELA on either promoter 1F/H methylation or GR functioning, higher methylation levels at GR 1H CpG 5 were associated with a lower IC50 to PWM induced IL6 secretion in the ELA group, indicating GR resistance (rho = 0.40, p < 0.001; Figure 6B), although this was limited to a single CpG in one promoter. There was no correlation between GR functionality as measured by Dex inhibition of IL6 and the sum of methylation throughout promoter 1F and 1H (Figure 6C). As expected, higher levels of GR 1F mRNA transcripts were related to a decreased IC50 after PWM stimulation (rho = -0.42, p < 0.001). A similar relationship existed between PWM stimulated IC50 and GR 1H transcripts, albeit as a trend and to a lesser extent (rho = -0.20, p = 0.053). There was no group difference in GR resistance between ELA and controls after the three different stimuli (Wilcoxon rank sum test, p > 0.1), although there may be an increased sensitivity of T cells as dexamethasone suppression of PWM induced IL6 by T cells correlated with methylation at a CpG in promoter 1H and with exon 1F transcript levels.

Figure 5. Inhibition of IL6 secretion by dexamethasone after PWM, PHA, or LPS stimulation. Supernatant concentration of IL6 after stimulation of whole blood with B-cell specific PWM in the presence of dexamethasone (A). IC50 was determined for Control and ELA participants (B). Inhibition curve for the T cell specific PHA (C) and IC50 values for Control and ELA participants (D). Inhibition curve for the B cell and monocyte stimulant LPS (E) and IC50 values for Control and ELA participants (F). A, C, E—open circles, early life adversity; closed circles, control participants. *p < 0.05 in a pairwise comparison of the specific concentration.
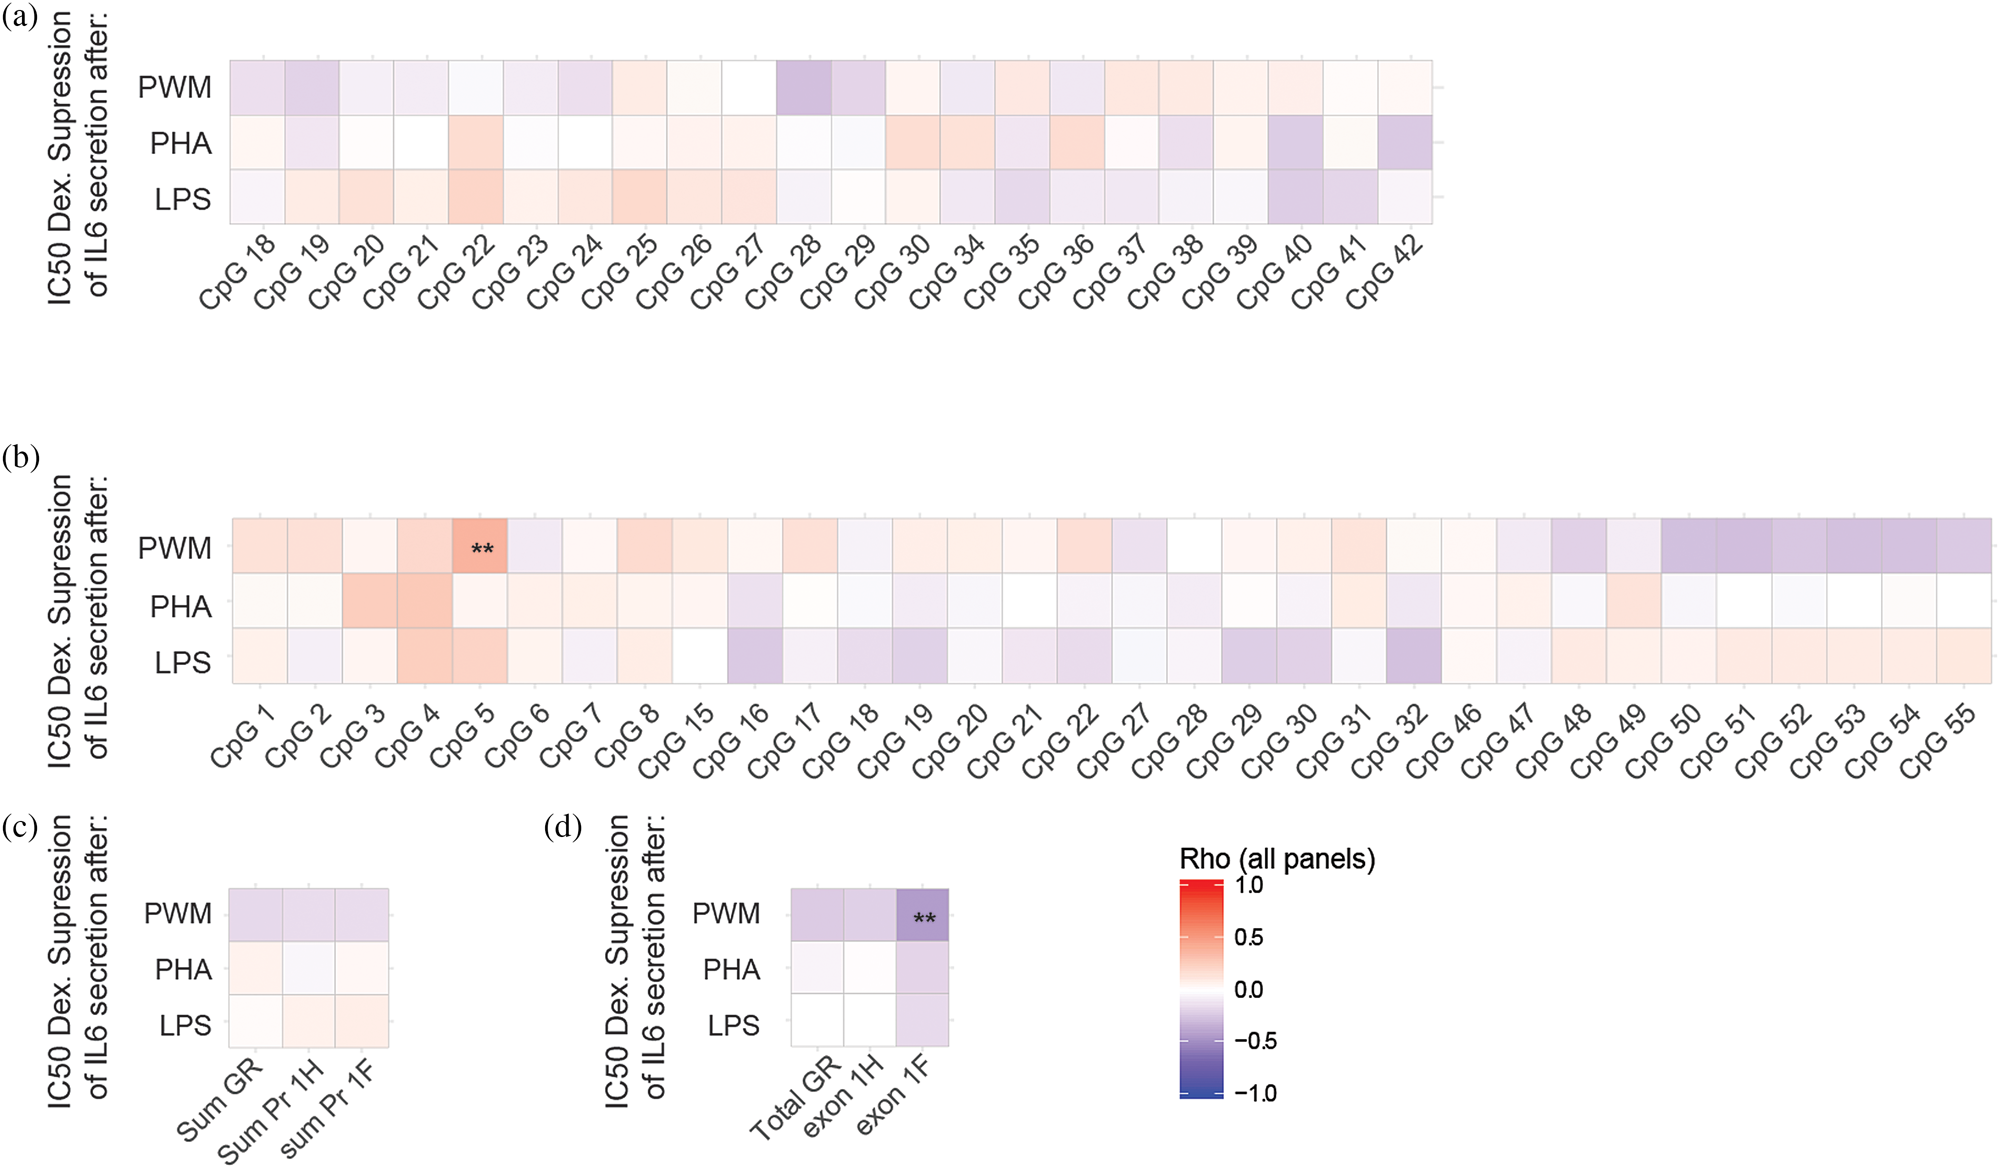
Figure 6. Correlation matrix between the IC50 of the dexamethasone suppression of IL6 production by PWM, PHA, and LPS and the methylation levels at single CpGs in the GR 1F (A) and GR 1H (B) promoter regions, sum methylation levels throughout the promoters (C), and with GR transcript levels (D). Statistics: Spearman rank-order correlations. Rho values according to the color scale after Benjamini-Hochberg false discovery rate correction. **p < 0.01.
Discussion
In the present study, we investigated GR functioning in the EpiPath cohort. We could demonstrate that methylation levels at certain CpGs at the GR promoter predicted expression levels of GR transcripts and target genes. Moreover, we showed that expression of GR transcripts correlated with GR target gene expression, but correlations were weak (rho from 0.22 to -0.36). Interestingly, in this cohort, ELA was associated with a higher prevalence of chronic diseases and psychological disorders, and we have demonstrated a clear immune phenotype (Elwenspoek, Hengesch, et al., Reference Elwenspoek, Hengesch, Leenen, Schritz, Sias, Schaan and Muller2017; Elwenspoek, Sias, et al., Reference Elwenspoek, Sias, Hengesch, Schaan, Leenen, Adams and Turner2017). Here, we investigated whether this phenotype was related to disturbances in GR signaling. We found that DNA methylation levels of two first exon promoter regions of the GR gene, transcription levels of GR and GR target genes, and GR sensitivity in leukocytes were largely unaffected by the experience of ELA in our EpiPath cohort. These data suggest that peripheral GR signaling was unperturbed in our cohort and that the observed immunophenotype was not secondary to an altered GR response to GCs.
Here, ELA was characterized by the early separation from parents and institutionalization prior to adoption, which are known and well-established adverse childhood experiences (Julian, Reference Julian2013; Phillips & Carver, Reference Phillips and Carver2015; van Ijzendoorn et al., Reference van Ijzendoorn., Palacios, Sonuga-Barke, Gunnar, Vorria, McCall and Juffer2011). The adversity happened very early in life, the median age of adoption was 4.5 months. This is in a key developmental period that determines lifelong patterns of health and disease. The importance of the first 1000 days from conception to age 2 years was originally proposed by David Barker (Barker & Osmond, Reference Barker and Osmond1986), and it has since been confirmed my many epidemiological studies. This period coincides almost exactly with the rigorously controlled sequence of complex neurodevelopmental processes beginning with neurogenesis and through proliferation, migration, differentiation, synaptogenesis, apoptosis, and myelination to form the human brain (Rice & Barone, Reference Rice and Barone2000). This presents a window of susceptibility to environmental insults which has no counterpart in the mature nervous system, or in any other organs. If a developmental process in the brain is halted or inhibited, there are few possibilities for potential repair later, and the consequences can therefore be permanent (Knight & Sorensen, Reference Knight and Sorensen2001; Louis et al., Reference Louis, Damstra, Díaz-Barriga, Faustman, Hass, Kavlock and Sheldon2006; Rice & Barone, Reference Rice and Barone2000; Schroeder, Reference Schroeder2011). Unfortunately, this period of extreme developmental susceptibility is difficult to assess retrospectively because participants have no memories from this period, hence they cannot self-report this adversity. The CTQ, like all other measures, is not only limited by its reliance on the individuals subjective reporting of events, but its scope is also limited because it does not cover either institutionalization or adoption. As expected, our ELA participants had low scores of childhood maltreatment (CTQ). However, as we have previously, reported they have a very clear ELA-associated immunophenotype (Elwenspoek, Hengesch, et al., Reference Elwenspoek, Hengesch, Leenen, Schritz, Sias, Schaan and Muller2017; Elwenspoek, Sias, et al., Reference Elwenspoek, Sias, Hengesch, Schaan, Leenen, Adams and Turner2017) and a clear stress-induced HPA axis hyporeactivity (Hengesch et al., Reference Hengesch, Elwenspoek, Schaan, Larra, Finke, Zhang and Schachinger2018), confirming long-term physiological consequences from their exposure to a significant ELA. As we have previously suggested, in the specific case of institutionalization/adoption, a low CTQ score does not indicate an absence of ELA (Turner, Reference Turner2018).
Studies that have investigated adversity measured by high CTQ scores (recalled traumatic events that occurred before age 16) have found hypermethylation in the 1F region in both hippocampus tissue (McGowan et al., Reference McGowan, Sasaki, D'Alessio, Dymov, Labonte, Szyf and Meaney2009) and circulating immune cells (Martin-Blanco et al., Reference Martin-Blanco, Ferrer, Soler, Salazar, Vega, Andion and Pascual2014; Perroud et al., Reference Perroud, Paoloni-Giacobino, Prada, Olie, Salzmann, Nicastro and Malafosse2011; Romens et al., Reference Romens, McDonald, Svaren and Pollak2015; Tyrka et al., Reference Tyrka, Price, Marsit, Walters and Carpenter2012); others have not found such an association (Steiger, Labonte, Groleau, Turecki, & Israel, Reference Steiger, Labonte, Groleau, Turecki and Israel2013), or, inversely, they have reported hypomethylation (Tyrka et al., Reference Tyrka, Parade, Welch, Ridout, Price, Marsit and Carpenter2016). The situation may, however, be more complex. Alexander et al. (Reference Alexander, Kirschbaum, Wankerl, Stauch, Stalder, Steudte-Schmiedgen and Miller2018) recently observed that there was no direct association between ELA and GR methylation, rather GR promoter 1F methylation may moderate whether an individual becomes hypo- or hyper-responsive to a subsequent psychosocial stressor (Alexander et al., Reference Alexander, Kirschbaum, Wankerl, Stauch, Stalder, Steudte-Schmiedgen and Miller2018), although in a previous study we did not observe a link between GR promoter 1F and the stress response (Li-Tempel et al., Reference Li-Tempel, Larra, Sandt, Meriaux, Schote, Schachinger and Turner2016). To our knowledge, there is only one report that examined a form of ELA comparable to the EpiPath cohort. Melas et al. (Reference Melas, Wei, Wong, Sjoholm, Aberg, Mill and Lavebratt2013) found higher 1F methylation in saliva in association with early parental death, similar to the results for maltreatment exposure (Melas et al., Reference Melas, Wei, Wong, Sjoholm, Aberg, Mill and Lavebratt2013). Although saliva can contain a mixture of cells, immune cells are the main source of DNA.
Limited overlap between CpGs investigated in the above mentioned studies and differences in timing, duration, and severity of our model of ELA compared with other models may have caused these discrepant findings. We focused on CpGs anterior to and within exon 1F, which are most likely affecting transcription of the 1F exon, while others also included CpGs posterior to the 1F exon (Martin-Blanco et al., Reference Martin-Blanco, Ferrer, Soler, Salazar, Vega, Andion and Pascual2014; Perroud et al., Reference Perroud, Paoloni-Giacobino, Prada, Olie, Salzmann, Nicastro and Malafosse2011). In addition, we included CpGs within the NGFI-A binding region orthologous to the original site identified by Weaver et al. (Reference Weaver, Cervoni, Champagne, D'Alessio, Sharma, Seckl and Meaney2004), whereas other studies did not. Moreover, compared with individuals that were exposed to childhood maltreatment, participants in the EpiPath cohort were exposed to ELA for a relatively short time period.
We found hypomethylation in a small region within the 1H promoter in leukocytes in association with ELA. As there were no differences in the baseline levels of relative numbers of major cell subtypes (Elwenspoek, Hengesch, et al., Reference Elwenspoek, Hengesch, Leenen, Schritz, Sias, Schaan and Muller2017), it is unlikely that these results were affected by differences in methylation across leukocyte types that covaried with adversity. Interestingly, Labonté et al. (Reference Labonte, Yerko, Gross, Mechawar, Meaney, Szyf and Turecki2012) examined methylation levels in hippocampus tissue of suicide completers with a history of childhood maltreatment and reported hypomethylation in the exact same region of the 1H promoter (Labonte et al., Reference Labonte, Yerko, Gross, Mechawar, Meaney, Szyf and Turecki2012). In addition, Steiger et al. (Reference Steiger, Labonte, Groleau, Turecki and Israel2013) found hypomethylation at the 1H promoter in association with borderline personality disorder among bulimia nervosa patients. However, 1H has been studied far less than 1F and there are also contradictory reports showing hypermethylation at the 1H promoter in association with ELA (van der Knaap et al., Reference van der Knaap, Riese, Hudziak, Verbiest, Verhulst, Oldehinkel and van Oort2014).
It has become increasingly clear that there is no one-to-one relationship between methylation and transcription (Leenen, Muller, & Turner, Reference Leenen, Muller and Turner2016). Although studies have reported correlations between higher GR methylation and lower GR expression, other studies found no association (Hogg, Blair, McFadden, von Dadelszen, & Robinson, Reference Hogg, Blair, McFadden, von Dadelszen and Robinson2013) or in the opposite direction (Labonte et al., Reference Labonte, Yerko, Gross, Mechawar, Meaney, Szyf and Turecki2012). However, Labonté et al. (Reference Labonte, Yerko, Gross, Mechawar, Meaney, Szyf and Turecki2012) found a positive relationship between methylation levels at 1H CpG 1–13 and GR mRNA levels. In contrast, we found no relationship between methylation levels at 1H CpG 1–8 (9–14 were not included) and total GR expression, and an inverse relationship with 1F transcripts. Nevertheless, in 1H CpG 47–55 specifically, we found positive correlations between methylation and transcription.
Differential methylation of other first exon promoters (such as 1C and 1B) in ELA have been reported (e.g. (Labonte et al., Reference Labonte, Yerko, Gross, Mechawar, Meaney, Szyf and Turecki2012), which were not investigated in this study. However, although there may have been small methylation changes in these regions as well, we can exclude that they affected expression of GR transcripts in immune cells. Similarly, the observed differential methylation of one region in the 1H promoter was not related to detectable changes in total GR mRNA, nor in 1H transcripts specifically. Previously we have reported that GR methylation levels in the blood are a proxy for levels in the prefrontal cortex, paraventricular nucleus of the hypothalamus, and the pituitary gland in the rat (Witzmann, Turner, Meriaux, Meijer, & Muller, Reference Witzmann, Turner, Meriaux, Meijer and Muller2012). If this is also true for man, our data would then suggest that GR methylation levels, and most probably transcription levels, would be unchanged in these key HPA axis tissues. The limited differences in methylation that we observed fall into the subtle change paradigm that has become the hallmark of complex disease phenotypes over the last few years (Leenen, Muller & Turner, Reference Leenen, Muller and Turner2016). Indeed, there are now numerous observational studies reporting such limited changes in GR promoter methylation from our laboratory and others (Alexander et al., Reference Alexander, Kirschbaum, Wankerl, Stauch, Stalder, Steudte-Schmiedgen and Miller2018; Labonte et al., Reference Labonte, Yerko, Gross, Mechawar, Meaney, Szyf and Turecki2012; Li-Tempel et al., Reference Li-Tempel, Larra, Sandt, Meriaux, Schote, Schachinger and Turner2016; McGowan et al., Reference McGowan, Sasaki, D'Alessio, Dymov, Labonte, Szyf and Meaney2009; Palma-Gudiel et al., Reference Palma-Gudiel, Cordova-Palomera, Leza and Fananas2015; Tyrka et al., Reference Tyrka, Price, Marsit, Walters and Carpenter2012, Reference Tyrka, Parade, Welch, Ridout, Price, Marsit and Carpenter2016). Such small differences in methylation have led us and others to question their true biological significance; however, there is an ever-growing number of genes and pathophysiological situations in which reproducible, small changes in methylation have been reported, suggesting that this “subtle change” paradigm is relevant, even if the exact mechanism by which these changes induce the final phenotype is not completely understood (Leenen, Muller, & Turner, Reference Leenen, Muller and Turner2016).
In our EpiPath cohort, not all immune cell types were equally affected by ELA, and differences were only detectable when examining specific immune subsets (Elwenspoek, Hengesch, et al., Reference Elwenspoek, Hengesch, Leenen, Schritz, Sias, Schaan and Muller2017; Elwenspoek, Sias, et al., Reference Elwenspoek, Sias, Hengesch, Schaan, Leenen, Adams and Turner2017). Therefore, a limitation of the present study is that like many other studies (Alexander et al., Reference Alexander, Kirschbaum, Wankerl, Stauch, Stalder, Steudte-Schmiedgen and Miller2018; Batten et al., Reference Batten, Aslan, Maciejewski and Mazure2004; Klengel et al., Reference Klengel, Mehta, Anacker, Rex-Haffner, Pruessner, Pariante and Binder2013; Labonte et al., Reference Labonte, Azoulay, Yerko, Turecki and Brunet2014; Labonte et al., Reference Labonte, Yerko, Gross, Mechawar, Meaney, Szyf and Turecki2012; Martin-Blanco et al., Reference Martin-Blanco, Ferrer, Soler, Salazar, Vega, Andion and Pascual2014; Palma-Gudiel et al., Reference Palma-Gudiel, Cordova-Palomera, Leza and Fananas2015; Perroud et al., Reference Perroud, Paoloni-Giacobino, Prada, Olie, Salzmann, Nicastro and Malafosse2011; Perroud et al., Reference Perroud, Rutembesa, Paoloni-Giacobino, Mutabaruka, Mutesa, Stenz and Karege2014; Romens et al., Reference Romens, McDonald, Svaren and Pollak2015; Tyrka et al., Reference Tyrka, Parade, Welch, Ridout, Price, Marsit and Carpenter2016; Tyrka et al., Reference Tyrka, Price, Marsit, Walters and Carpenter2012; van der Knaap et al., Reference van der Knaap, Riese, Hudziak, Verbiest, Verhulst, Oldehinkel and van Oort2014; Vukojevic et al., Reference Vukojevic, Kolassa, Fastenrath, Gschwind, Spalek, Milnik and de Quervain2014) we used DNA and RNA isolated from whole blood, which contains multiple different cell types and may have obscured possible cell specific changes in GR transcription or methylation. Furthermore, in many instances we reject the null hypothesis. Although the statistical power was calculated a priori, and we have the power to detect small changes in each of the individual analysis sections, we did not correct for the overall power of the study. To definitively conclude that there is no effect and not a Type 2 error this would need to be overcome with a significantly larger cohort. Our data suggest, however, that the GR-dependent peripheral immune response to three specific stimuli is unchanged, and that, overall, the GR is functioning normally in participants exposed to ELA in T cells, B cells, and monocytes. Thus, GR programming does not seem to underlie the hyporesponsive HPA axis or the observed ELA immune phenotype. Nevertheless, other molecular pathways may have been epigenetically programmed by ELA, such as the NFkB pathway that plays an important role in immune activation—and it plays a significant role in the “conserved transcriptional response to adversity.” Conserved transcriptional response to adversity is a specific pattern of up-regulated proinflammatory genes and down-regulated antiviral genes (reviewed in Cole Reference Cole2014). This is exquisitely dependent upon transcription factors such as NF-κ-B, GR, and interferon regulatory factors. This transcriptional signature is not limited to T cells, and similar approaches have been used in monocytes (Miller et al., Reference Miller, Chen, Shalowitz, Story, Leigh, Ham and Cole2018). There is, now, a report based on long-term self-report-based psychosocial stress where p16INK4a, a cellular senescence signal, was expressed (Rentscher et al. Reference Rentscher, Carroll, Repetti, Cole, Reynolds and Robles2019). More importantly, differential transcription factor usage is primordial in immune cell differentiation and activation. There is now preliminary data published during the writing and revising of this manuscript associating low SES with gene expression profiles that suggest the peripheral immune system is biased towards a Th activity, and furthermore, towards a Th2/Th17 profile, and away from Th1 that was thought to further decrease asthma symptom control amongst low SES children (Miller et al. 2018, Turner Reference Turner2018). There is also a growing literature on the role of adipose tissues linking ELA to both depressive symptoms and increased inflammation. Chiang et al. (Reference Chiang, Bower, Irwin, Taylor and Fuligni2017) hypothesized that “adipose tissue may be a major source of stress-induced inflammation.” Indeed, the release of proinflammatory cytokines from adipocytes is stimulated by norepinephrine as well as biasing them towards a long-term proinflammatory phenotype (Chiang et al., Reference Chiang, Bower, Irwin, Taylor and Fuligni2017).
Future research should focus on unbiased approaches, for instance investigating whole genome methylation or transcriptional profiles, preferably in single immune cell subsets. Finally, longitudinal studies will be necessary to differentiate between cause and effect, and to determine whether immune dysregulation precedes stress axis dysregulation or whether they develop concurrently.
Acknowledgments
We would like to thank Martyna Marynowska and Fei McMahon for laboratory assistance (LIH); Jérôme Graas, Jean-Yves Ferrand, Roxane Batutu, Myriam Alexandre, and Graziella Ambroset from the Clinical and Epidemiological Investigations Center (CIEC, LIH); and Johannes Finke (University of Trier) for assisting in sample collection during the visit 1.
Financial Support
This study was funded by the Fonds National de Recherche (FNR) Luxembourg (C12/BM/3985792 “EpiPath”; C16/BM/11342695 “MetCOEPs”; PRIDE/11012546/NEXTIMMUNE; and an AFR PhD fellowship No 9825384), and the Ministry of Higher Education and Research of Luxembourg, University of Luxembourg, and DFG funding (SCHA1067/3-1) also supported this work. JDT is a management board member of the EU-funded COST actions CM1406, CA16120, and CA18127.
Supplementary Material
The supplementary material for this article can be found at https://doi.org/10.1017/S0954579419001147.


