


INTRODUCTION
Current conservation approaches necessitate environmental management within the context of wider human-modified landscapes (Western Reference Western2001; Chazdon et al. Reference Chazdon, Harvey, Komar, Griffith, Ferguson, Martínez-Ramos, Morales, Nigh, Soto-Pinto, van Breugel and Philpott2009) and consider the action of monitoring the matrix landscape beyond protected areas (PAs; Prugh et al. Reference Prugh, Hodges, Sinclair and Brashares2008). This has fuelled the need to understand the landscape context of PAs at multiple scales of measurement (Wiens et al. Reference Wiens, Anderson, Boucher, Campbell, Jones, Smith and Koeppe2008; Reference Wiens, Sutter, Anderson, Blanchard, Barnett, Aguilar-Amuchastegui, Avery and Laine2009), tracking land-cover change across administrative jurisdictions and management objectives (Svancara et al. Reference Svancara, Scott, Loveland and Pidgorna2009; Wiens et al. Reference Wiens, Sutter, Anderson, Blanchard, Barnett, Aguilar-Amuchastegui, Avery and Laine2009). Such broad-scale monitoring inherently acknowledges the landscape mosaic as a spatially structured socio-ecological system (Cumming et al. Reference Cumming2011), indicating the complexities of the relationships between environmental decision-making and socio-economic factors in the wider landscape (de Fries et al. Reference de Fries, Hansen, Turner, Reid and Liu2007). Biosphere reserves (BRs) are uniquely positioned to take advantage of this systems thinking approach to conservation (Nguyen & Bosch Reference Nguyen and Bosch2012), explicitly including human resource-use and the land-cover matrix within the landscape mosaic as a central tenet of their management strategy (UNESCO 1996; Coetzer et al. Reference Coetzer, Witkowski and Erasmus2014).
BRs are not intended to displace traditional PAs. Rather, they are international conservation designations expected to facilitate co-operation across administrative boundaries and enable socio-economic development, whilst maintaining existing conservation values through a structured spatial approach to environmental utilization (Pool-Stanvliet Reference Pool-Stanvliet2013; Coetzer et al. Reference Coetzer, Witkowski and Erasmus2014). They are intended to sustain collaborative environmental decision-making amongst a geographically-dispersed and often socio-economically variable stakeholder group, providing a regional platform for participation (Reed et al. Reference Reed, Godmaire, Abernethy and Guertin2014); attempting to match the scale of environmental problems to a scale appropriate for management action (Olsson et al. Reference Olsson, Folke, Galaz, Hahn and Schultz2007). Yet this multi-scaled social and institutional organization adds significant complexity with regard to making environmental management decisions in these landscapes. For the Kruger to Canyons Biosphere Reserve (K2C) of north-eastern South Africa, with its diverse stakeholder network, significant human–environmental interactions and spatially-structured institutional arrangements, this is especially important. Understanding and predicting resource abundance and associated utilization patterns in this BR, and determining how best to translate the observed trends to inform responsive management practice and policy, will likely become a priority in ensuring the success of UNESCO's Man and the Biosphere (MaB) model here long-term.
Conservation interventions are typically constrained by available resources, and as such, conservation approaches have converged on those strategies that maximize return on investment (Polasky Reference Polasky2008). Applying this convention to change detection requires that changes that are temporary or spurious are not prioritized within the decision-making process (Aldwaik & Pontius Reference Aldwaik and Pontius2012), with effective monitoring informing the scheduling of management action. Translating this objective across the science–policy–management interface raises the specific challenges of identifying what constitutes significant or important spatial change for any particular landscape over time, and determining a critical spatial and temporal threshold of land-cover change to initiate action. In this regard, the multi-time point approach of Aldwaik and Pontius (Reference Aldwaik and Pontius2012), hereafter ‘Intensity Analysis’, may offer considerable interpretative opportunities for the environmental manager, with the potential to reveal unfavourable change trajectories while options for management intervention remain financially and spatially viable.
We apply the approach to the spatial extent, rate and intensity of landscape transformation across the time intervals 1993–2006–2012. We utilize the Intensity Analysis (Aldwaik & Pontius Reference Aldwaik and Pontius2012) approach to guide considerations of sustainability for this BR in the future, its long-term management objectives under MaB, and identify potential critical thresholds of change for the loss of intact vegetation in this multi-use landscape should the observed trends continue. We are not aware of any such previous southern African application of Intensity Analysis in the manner in which we have applied it, nor of its application to a BR.
METHODS
Study site
The K2C (Fig. 1) was registered by UNESCO's MaB in 2001, and at ~2.5 Mha, is the third largest of eight South African BRs. Located in north-eastern South Africa (Fig. 1 a), the BR designation has been applied to a ‘multi-use conservation landscape’ (Fig. 1 b and Fig. S1). The BR's zonation is well-established (Fig. 1 c), with core (nationally protected) and buffer zone (provincially-managed or privately-owned) conservation areas accounting for more than half the available land area in K2C. As a result, land-use intensity in the unprotected, open-ended, transition zone is significant (Coetzer et al. Reference Coetzer, Erasmus, Witkowski and Reyers2013).
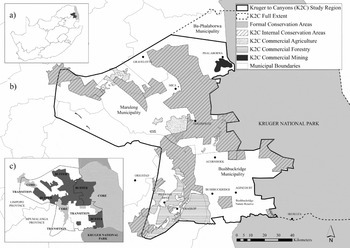
Figure 1 (a) Regional location of the Kruger to Canyons Biosphere Reserve (K2C) relative to national and provincial boundaries, (b) including land-use, administrative boundaries and main towns, with (c) spatial zonation indicated. Figure legend refers to inset (b).
K2C has a population of ~1.5 million people (densities can exceed 300 people/km2; Pollard et al. Reference Pollard, Shackleton, Carruthers, du Toit, Rogers and Biggs2003), many of whom still reside in areas delineated as former Apartheid ‘homelands’. Here, high population densities (Fig. S2), entrenched poverty, escalating unemployment and historical marginalization results in locally harvested natural resources being essential to livelihoods (Shackleton & Shackleton Reference Shackleton and Shackleton2002; Dovie et al. Reference Dovie, Witkowski and Shackleton2005; Twine Reference Twine2005; Madubansi & Shackleton Reference Madubansi and Shackleton2007). This persists regardless of infrastructure improvements; even with increased electrification, fuelwood harvesting may soon reach unsustainable levels (Fisher et al. Reference Fisher, Witkowski, Erasmus, Van Aardt, Asner, Wessels and Mathieu2012; Matsika et al. Reference Matsika, Twine and Erasmus2013; Wessels et al. Reference Wessels, Colgan, Erasmus, Asner, Twine, Mathieu, van Aardt, Fisher and Smit2013). Changes in consumption and extraction patterns as resources become scarcer and/or social grant or remittance flows fluctuate (Campbell et al. Reference Campbell, Frost, Goebel, Standa-Gunda, Mukamuri and Veeman2000) will add complexity to the BR's landscape management, raising concerns about local environmental sustainability (Giannecchini et al. Reference Giannecchini, Twine and Vogel2007; Coetzer et al. Reference Coetzer, Erasmus, Witkowski and Reyers2013), and potentially affecting the relationships between the conservation areas and the communities living outside their fences (Xu et al. Reference Xu, Chen, Lu and Fu2006; Anthony Reference Anthony2007).
Data sources and analysis
Data acquisition and data processing
We augment previous analyses of land-cover changes between 1993 and 2006 (Coetzer et al. Reference Coetzer, Erasmus, Witkowski and Bachoo2010; Reference Coetzer, Erasmus, Witkowski and Reyers2013) with 2012 data and new analysis across the entire 19 year period. All land-cover maps were created from winter Landsat imagery acquired from the US Geological Survey (www.usgs.gov), matching image capture dates to negate seasonal effects, and performing a supervised classification approach in IDRISI Selva (Eastman Reference Eastman2012).
We focus on spatial change dynamics of three consolidated classes (hereafter ‘priority classes’): combined ‘intact vegetation’ (representing environmental protection), combined ‘impacted vegetation’ (human-driven resource utilization, e.g., communal rangelands where harvesting occurs) and ‘settlement’ (e.g., development) classes, used as proxies for the dual development and conservation management objectives of all BRs, accounting for >78% of the land-cover across K2C in all three time intervals.
Kruger National Park has been excluded from all analyses, and only the land-cover of the matrix areas beyond the park's fence-line is presented. Thus, the core zones referred to throughout the paper refer only to the internal core zones, rather than the full extent (i.e., Fig. 1 b).
Intensity Analysis
Changes in the priority classes were characterized using Intensity Analysis (Aldwaik & Pontius Reference Aldwaik and Pontius2012), quantifying the changes in classification maps across multiple time intervals simultaneously, while accounting for the potential differences in the temporal extent of observation periods, as well as the relative spatial contribution distinct land-cover types make to the full landscape extent.
We focus on interval and category levels of Intensity Analysis (Aldwaik & Pontius Reference Aldwaik and Pontius2012; Huang et al. Reference Huang, Pontius, Li and Zhang2012; equations presented in Table S1). The interval level was used to assess the total change in each time interval, determining the variations in total size and the intensity of the rate of annual change. The observed rates were compared to a uniform rate, that is, the rate that would have existed if annual changes had been distributed equally across the study's full temporal extent, with a relative measure of time intensity of ‘fast’ or ‘slow’. The category level was used to assess changes in gross gains and losses across the landscape within each class, identifying classes that were relatively ‘active’ versus ‘dormant’ in terms of their observed change. Active changers represent classes that were actively contributing to the observed landscape changes, within the specified time interval, while accounting for their initial and subsequent class extents. The category intensity compared the observed intensity of change with uniform change, that is, the change that would have existed if the observed landscape changes within each time period had been distributed uniformly across the full spatial extent.
To guide considerations of future sustainability and potential critical thresholds of change for intact vegetation specifically, we extrapolated the observed rate of change for the period 2006–2012 to 2018, with the additional loss percentage assigned in the same proportions as in the original transition matrix between 2006 and 2012. We treated 2018 as our final extrapolation end point, so that with this temporal addition, the full extent approximates that of the previous 1993–2006 period. We used the most recent observation period for the extrapolation rather than the full 1993–2012 extent, although we present both for comparison. Land-cover modelling has shown that shorter transition periods from more recent calibration periods make predictions with less uncertainty than those from a distant date, and/or longer transition lengths, due to the dynamic nature of land-cover processes (Rosa et al. Reference Rosa, Purves, Carreiras and Ewers2015). We recognize that these original observations were made on spatially-explicit surfaces of future land-cover rather than linear extrapolations, but argue that the same holds true for extrapolated values to some degree, with the longer combined transition period moderating the effect of the proximate drivers of recent transformation.
RESULTS
Patterns of change in priority land-cover classes across K2C: 1993–2012
The priority classes accounted for 78–80% of the K2C landscape at all three time points, with the general trends presented in previous studies enduring with the addition of 2012 land-cover (Fig. 2).
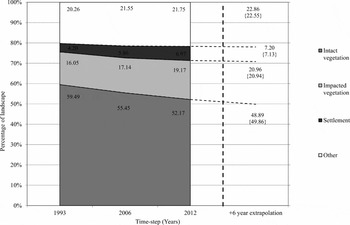
Figure 2 Change in percentage contribution of priority classes across Kruger to Canyons Biosphere Reserve (K2C) 1993–2012. The dashed lines beyond 2012 indicate a linear extrapolation of change based on the 2006–2012 transition. The values in brackets {} provide the extrapolation based on full 1993–2012 analysis period for comparison.
Intact vegetation remained the dominant land-cover class in 2012, accounting for 52.17% of the landscape (Table 1). This represents a net >7% decline relative to K2C's total extent from 1993, and >3% decline from 2006. However, the percentages relative to the class’ 1993 and 2006 extent are more concerning: 6.3% loss from 2006–2012 (~>350 km2), and 14% loss over the entire study interval (~>750 km2). By 2012, impacted vegetation accounted for 19.1% of the subregion and settlement had expanded to 6.97% of K2C, net increases of >1.96% (~>210 km2) and 1.11% (~>120 km2) since 2006 respectively; expansions relative to their 2006 class extents of 10.2 and 16%.
Table 1 Land-cover transition matrix for priority cover classes (measured as percentage of study area): 1993–2006 and 2006–2012. Percentage values on the diagonal indicate persistence, with those on the vertical and horizontal indicating exchanges between classes in each time interval.
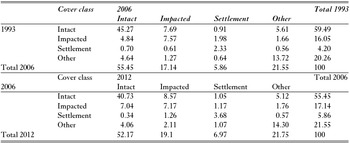
The largest changes within both time intervals are exchanges between intact and impacted vegetation cover (Table 1). Exchanges from intact vegetation to ‘other’ (besides the focal priority classes) are also noticeable (>5% of K2C).
Intensity Analysis: assessment of the annual rate and size of change across K2C
The intensity of landscape change accelerated during 2006–2012 (Fig. 3 a), with the annual change area increasing to 5.68% of the subregion, faster than if changes had been constant from 1993 to 2012. Category change intensities across time intervals show this increase as a function of the priority land-cover classes across K2C (Figs. 3 b and c). While these gross changes do not expose directional changes clearly, they do demonstrate a land-cover class’ annual intensity of activity across the landscape over time intervals.
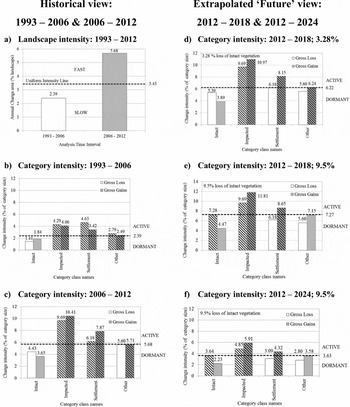
Figure 3 Intensity of change across the Kruger to Canyons Biosphere Reserve (K2C), presented by time intervals, with historical (a, b, c) and future views (d, e, f) indicated. (a) represents the interval intensity from 1993–2012, while (b–f) indicate category intensities of gross losses and gains within cover classes/per specified time interval. The horizontal dashed line indicates the uniform intensity of change that would occur if observed changes were distributed equally over the time interval indicated on each figure, with those above (hatched) showing changes that are relatively fast over that period (‘interval intensity’, [a]) or ‘active’ contributors to change (‘category intensities’, [b–f]). Uniform intensity values are a function of area of change and duration of the interval.
Impacted vegetation and settlement show gross changes that are ‘active’ (Figs. 3 b and c), accelerating in the 2006–2012 period, with gain intensities becoming more prominent. These active changes indicate that all observed changes (expansions, contractions and spatial swaps; Fig. 4) are larger than expected given the spatial extent of these classes in the landscape, and greater than if the overall changes were distributed uniformly across K2C from 1993–2012. By contrast, the annual changes in intact vegetation were lower than expected during 1993–2012 based on its proportional contribution to total K2C land-cover and thus the theoretical availability of this cover type for conversion. Regardless, the intensity of activity in intact vegetation increased over time, with larger increases in loss intensity relative to gain intensity.
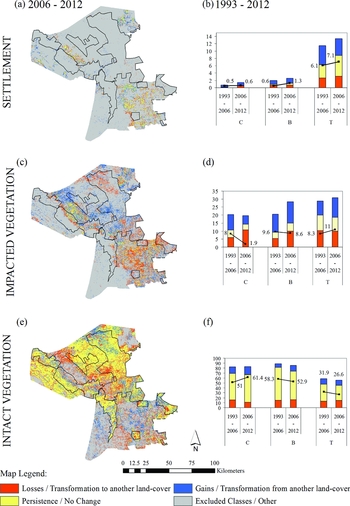
Figure 4 Spatial patterns of gains, losses and persistence in (a) settlement, (c) impacted vegetation and (e) intact vegetation for 2006–2012, with zonation indicated. (b, d and f) indicate changes as a function of zone extent for 1993–2006 and 2006–2012 as a percentage, where C = core, B = buffer and T = transition zones. For display purposes, the y-axis scaling differs between classes, with the maximum percentage value on settlement axis at 16%, impacted vegetation at 35% and intact vegetation at 100%.
The change in the intact vegetation class was extrapolated into the future (Figs 2 and 3 d). Based on losses in the 2006–2012 analysis period (Fig. 2), a linear extrapolation of further transformation anticipates a further 3.28% loss of this cover type by 2018, although this is likely an underestimation given that the landscape change is accelerating (Fig. 3 a). With this hypothetical further loss to 2018, intact vegetation loss intensity is sustained (Fig. 3 d; 3.28%). Only if the rate of transformation increases noticeably (i.e., to reflect further losses of 9.5% by 2018), does intact vegetation loss intensity make the switch from dormant to active (Fig. 3 e; 9.5%).
Biosphere reserve zonation and spatial changes: gains, losses and persistence
The Intensity Analysis provides some insight into both the temporal change and spatial component of change across this landscape, which can be explicitly linked to the BR's zonation (Fig. 4), with both spatial relocations (Figs 4 a, c and e) and class ‘activity’ within each zone (Figs 4 b, d and f) presented. Spatially, the majority of the change evident in the priority classes predominates in the transition zone, exterior to the spatial restrictions on use/large-scale land-cover change imposed by the ‘hard’ fences of the core and buffer zone's PAs. Impacted vegetation made noticeable advances in central K2C in 2012, encroaching towards the fences of buffer zone conservation areas.
The trends of change at the landscape level are not stationary across BR zones for all classes over both time intervals. The change in the standing stocks of impacted and intact vegetation at the end of each time interval (2006; 2012) for core and/or buffer zone conservation areas indicate decreasing and increasing trends respectively (Figs 4 d and f), the reverse of what occurred across the entire K2C (Table 1). This change is not uniform across all PAs within K2C. For example, Bushbuckridge Nature Reserve (buffer zone conservation area) continues to experience transformation within its borders (Fig. 4 e), a scenario that will potentially worsen in the future due to plans for improved road access to parts of the reserve and increasing population sizes in the surrounding areas (Fig. S2). Settlement has standing stocks that have increased across buffer and transition zones (the core zone's contributions are negligible and remain largely constant across time; Fig. 4 b). Increasing standing stocks within the transition zone drive the landscape trends for the settlement class (Table 1); with gains in settlement encroaching into areas of impacted and intact cover (Fig. 4 a).
DISCUSSION
The trends of change across K2C have continued (Fig. 2), with further increases in settlement and impacted vegetation cover and declines in intact vegetation (Table 1). While these general trends of change are consistent across both analysis intervals, the overall change has accelerated (Fig. 3 a), becoming noticeably more intense around the population centres of the transition zone during 2006–2012 (Figs 3 b vs. 3 c and Fig. 4).
Increases in human population sizes may explain some of this acceleration (Fig. S2), with the assumption that an increased population, contributes to a larger settlement expanse and expanded harvesting areas. Previous work in this area has indicated the importance of the spatial relationship between a more extensive settlement expanse and the footprint of local environmental resource use (Coetzer et al. Reference Coetzer, Erasmus, Witkowski and Reyers2013), a landscape observation supported by research at village scales (Fisher et al. Reference Fisher, Witkowski, Erasmus, Van Aardt, Asner, Wessels and Mathieu2012; Matsika et al. Reference Matsika, Erasmus and Twine2012; Reference Matsika, Twine and Erasmus2013; Wessels et al. Reference Wessels, Colgan, Erasmus, Asner, Twine, Mathieu, van Aardt, Fisher and Smit2013), with more intensive utilization compromising the ecological values of these harvesting areas.
There is growing community awareness of the loss of ecological function and degradation of communal rangeland areas due to increased harvesting, exacerbated locally by the erosion of tradition forms of resource governance (Twine et al. Reference Twine, Moshe, Netshiluvhi and Siphugu2003; Kirkland et al. Reference Kirkland, Hunter and Twine2007; Findley Reference Findley2013). Villages have annexed neighbouring areas to meet livelihood demands (Matsika et al. Reference Matsika, Erasmus and Twine2012), and previously distinct rangelands have spatially consolidated (Coetzer et al. Reference Coetzer, Erasmus, Witkowski and Reyers2013; Fig. S1). Current concerns around resource scarcity, for example, issues of ‘reckless harvesting’ and intensified commercial harvesting practices by ‘outsiders’ (Findley Reference Findley2013), have led to community suggestions for regulation that include the erection of fences to limit access and establish ‘ownership’ over resource use. To some degree, our field observations (2012/2013) of state-erected fences delineating cattle grazing camps around villages are congruent with these ideas of securing communal tenure for specific resource use (BLM 2010). Yet more widespread formal fences in this landscape for all resource uses are likely to greatly impact areas with lower levels of regulation, some of which coincide with certain provincially managed, buffer zone conservation areas. For example, anecdotal evidence, supported by our imagery (Fig. 4 and Fig. S1), already indicates increased resource harvesting in Bushbuckridge Nature Reserve.
The neighbourhood of surrounding cover impacts the future potential land cover in a given area, with neighbouring cover not only important for local effects (e.g., edge effects), but also for the broader spatial context of the landscape (Crews & Young Reference Crews and Young2013), with initial transformation fuelling further transformation trajectories (Brady et al. Reference Brady, McAlpine, Miller, Possingham and Baxter2009; Rosa et al. Reference Rosa, Purves, Souza and Ewers2013; Reference Rosa, Purves, Carreiras and Ewers2015). Thus, the increased expansion of settlement and impacted vegetation beyond previously observed localities in 2012 across K2C is predicted to have substantial repercussions for the intact vegetation expanse in the near future. Further losses, in the absence of intervention, escalating spatially across the transition zone, will further impact the linkages between core and buffer zone conservation areas (Fig. 4 c and e).
Across K2C, should the trends of landscape change continue into the future, we argue that the point at which intact vegetation losses become ‘active’ in this landscape signals a theoretical shift in the landscape dynamics and identifies an opportunity for proactive and precursory management intervention. At present, losses of K2C's intact vegetation remained lower than what its spatial extent should allow for (i.e., ‘dormant’; Figs. 3 b–d), yet manipulating both percentage loss and the time in which this occurs independently indicates the stationarity of loss activity at ≥9.5%. A further hypothesized 2% loss of intact vegetation beyond this over this same time period (Fig. S3; 11.5%), and the intensity of loss increases accordingly, becoming more established on the ‘active’ side of the activity threshold. However, should the loss of intact vegetation be slower than predicted, a likely more feasible possibility given past trends (i.e., 9.5% over 12 rather than 6 years to 2024; Fig. 3 f), intact vegetation change would remain ‘active’. It reinforces the hypothesis that provided other factors remain unchanged, a further 9.5% loss of intact vegetation in this landscape is sufficiently large in size to effect change dynamics over short, and longer, temporal extents.
As such, we argue that further losses of 9.5% likely represent a potential ‘critical threshold of change’ for scheduling action, which then can be directed at the appropriate BR zone (Figs. 3 e and f). Although a substantial portion of K2C's intact vegetation remains sheltered from potential transformation in core and buffer conservation areas (yet with disparities in protection effectiveness linked to regional administration [e.g., Limpopo vs. Mpumalanga provinces] and land ownership [private vs. provincial vs. national environmental management; Fisher et al. Reference Fisher, Erasmus, Witkowski, Van Aardt, Asner, Wessels and Mathieu2014]; Figs. 1 c and 4 e), half of K2C's remaining intact vegetation is located beyond existing conservation areas (51% in 2012), and thus available for conversion. We argue that the remnant intact vegetation of the transition zone specifically, and its role in facilitating connectivity across the BR, will most likely need to become a scheduling priority in the near future.
From 2006–2012, the transition zone suffered losses of 2.5% of intact vegetation cover (25.6 vs. 28.12%) and 4.17% loss since 1993 (Table 5 in Coetzer et al. Reference Coetzer, Erasmus, Witkowski and Reyers2013). Based on past trends, a 9.5% loss of intact vegetation to 2018 exclusively from the ‘unprotected’ transition zone exaggerates the potential for transformation here. However, over longer timeframes (i.e., to 2024; Fig. 3 f), recognizing the potential for change acceleration (i.e., Fig. 3 a), such a loss is not improbable. Within this extended temporal extent, 9.5% loss still signals a theoretical threshold for change across K2C (Fig. 3 f), establishing K2C above the 50% threshold of landscape transformation (Fig. 2), whereafter there is a rapid decline in the probability of a landscape supporting viable populations and climatically resilient areas (Flather & Bevers Reference Flather and Bevers2002; Jewitt et al. Reference Jewitt, Erasmus, Goodman, O'Connor, Hargrove, Maddalena and Witkowski2015).
Within areas of the transition zone, the observed gains of intact vegetation (Fig. 4 e) may initially appear ecologically promising, particularly in terms of ‘softening’ (sensu Franklin Reference Franklin1993) the landscape structure within the heavily utilized rangeland areas. However, we question the validity of a homogenous and functional transformation from impacted to intact vegetation at the scale of this landscape without additional research. Theoretically, impacted vegetation may potentially return to a state structurally (as opposed to compositionally) similar to what has been classified as intact habitat (in so far as it is distinguishable at Landsat resolution [Coetzer et al. Reference Coetzer, Erasmus, Witkowski and Bachoo2010; Reference Coetzer, Erasmus, Witkowski and Reyers2013], spectrally mimicking the structurally densely wooded intact Bushland and Thicket cover class; Fig. S1). However, observations from within the transition zone suggest the densification of woody vegetation through increases in biomass and bush encroachment of certain species (i.e., rather than rehabilitation) at local sites in the communal rangelands (Mograbi et al. Reference Mograbi, Erasmus, Witkowski, Asner, Wessels, Mathieu, Knapp, Martin and Main2015). Coppice growth as a result of intensive resource harvesting changes tree structure to a denser shrub-like growth form, which at larger scales might be considered bush-encroachment (Fisher et al. Reference Fisher, Witkowski, Erasmus, Van Aardt, Asner, Wessels and Mathieu2012). Whether this is a wide-scale occurrence or can be effectively ‘up-scaled’ across different resolutions beyond specific socio-economic contexts and certain village sites requires further critical review and consideration of place- and zone-specific drivers of change (Giannecchini et al. Reference Giannecchini, Twine and Vogel2007; Rosa et al. Reference Rosa, Ahmed and Ewers2014).
CONCLUSIONS
Given that BR management is a largely voluntary commitment held in addition to other professional management responsibilities elsewhere, a ‘future view’ on landscape change may assist with designing pre-emptive management interventions for the BR stakeholders, before it escalates beyond what can be realistically managed. The Intensity Analysis approach has been used to complement a more typical spatial analysis of land-cover change, with the switches in change activity as signals of more intensive transformation (vs. changes that are a function of the spatial contribution to the landscape only; see Pontius et al. Reference Pontius, Shusas and McEachern2004) proposed as indicators for scheduling management intervention. The increased rate of change in recent years poses challenges for landscape management, with future expectations of escalating transformation likely to undermine BR sustainability. At broad scales, further losses of intact habitat from the existing transition zone erodes the notion of a graduated scale of utilization across K2C's zonation, with significant consequences for the integrity of matrix areas and achieving a connected conservation landscape for global change scenarios.
We suggest that the K2C case study presented here, and our specific interpretation of Aldwaik and Pontius’ (Reference Aldwaik and Pontius2012) multi-time point approach, may be valuable for informing management decisions in other multi-use conservation landscapes; areas where environmental utilization, with its associated land-cover changes, must coincide with conservation objectives. The ease with which the framework can be applied to existing land-cover data, at all scales, makes it an attractive option to assist with more comprehensive decision-making, especially in instances where action is constrained by both time and finances. It can be readily down-scaled and applied on a BR zonation basis, rather than the full extent of a particular landscape, and assist with the determination of acceptable levels of transformation for specific habitat types (as defined by bioregional land-use plans) through scenario planning and landscape futures analysis (Bryan et al. Reference Bryan, Crossman, King and Meyer2011). The activity thresholds and ‘activity switches’ for focal habitat provide inputs into spatial policy options, and can inform decision-making and the prioritization of cost versus benefits of proposed developments/interventions in certain areas. Similarly, for provincial conservation agencies, where Intensity Analysis (and associated habitat-specific research) can be applied to PA networks, it has the potential to help with decisions around strategic adaptive management thresholds, that is, setting the wider limits of overall thresholds of potential concern for specific vegetation types (Venter et al. Reference Venter, Naiman, Biggs and Pienaar2008).
ACKNOWLEDGMENTS
This research was funded by grant B8749.R01 from the Carnegie Corporation of New York to the Global Change and Sustainability Research Institute at the University of the Witwatersrand. Additional support was received from Palabora Mining Company (PMC), National Research Foundation (NRF2069152) and Department of Trade and Industry (DTI) ‘THRIP’ for funding awarded to E.T.F. Witkowski (project: TP2009072900060). The authors thank Professor Nicholas Polunin for his suggestions and revisions on this paper.
Supplementary material
To view supplementary material for this article, please visit http://dx.doi.org/10.1017/S0376892916000084


