1. INTRODUCTION
Automatic Dependent Surveillance-Broadcast (ADS-B) is an important technology in Air Traffic Management (ATM), which automatically, periodically and continuously broadcasts aircraft information such as speed, position, flight number and direction (Radio Technical Commission for Aeronautics (RTCA), 2011). In recent years, aviation losses, such as Malaysian Airways MH-370 and Air France AF-447, have entailed massive search operations (Ashton et al., Reference Ashton, Bruce, Colledge and Dickinson2015). Increasingly, aircraft are required to be equipped with ADS-B Out. The European ADS-B Implementing Rule (European Union, 2011) mandated that new aircraft heavier than 5,700 kg or faster than 250 knots be equipped with ADS-B Out from 2015. Similar mandates exist for some Asian regions and the United States (US) and in Australia, ADS-B Out was required from the end of 2012.
Terrestrial-based ADS-B services are currently deployed as an add-on to radar or as an alternative in regions where radar stations are not cost-effective (Blomenhofer et al., Reference Blomenhofer, Pawlitzki, Rosenthal and Escudero2012). However, due to the limited coverage range of terrestrial ADS-B, in 2008 the German Aerospace Center (DLR) started to investigate whether 1090ES ADS-B signals broadcast by aircraft could be received on board a low earth orbiting satellite. The world's first ADS-B receiver was on the PROBA-V satellite launched on 7 May 2013, which demonstrated the feasibility of space-based ADS-B (Werner et al., Reference Werner, Bredemeyer and Delovski2014). Many institutions and countries have been involved in the development of space-based ADS-B owing to its global, continuous, low-latency and high-performance surveillance. More than a dozen satellites with ADS-B receivers have been launched, such as the GomX (GomX-1, GomX-2, GomX-3 and GomX-4 designed by the GomSpace Company) series satellites (Alminde et al., Reference Alminde, Christiansen, Kaas Laursen, Midtgaard, Bisgard, Jensen, Gosvig, Birklykke, Koch and Le Moullec2012; Gerhardt et al., 2017), STU-2 (Shanghai Technology University) satellite (Wu et al., Reference Wu, Chen and Chao2016), TianTuo-3 (Li et al., Reference Li, Chen, Chen, Zhao, Sheng and Bai2017) and Iridium-NEXT satellites. Live data from ADS-B receivers on the Iridium-NEXT constellation of 66 satellites with 100% global coverage, including over the North Pole and every ocean, will offer a worldwide ADS-B service (Garcia et al., Reference Garcia, Dolan and Hoag2017).
Though we can receive ADS-B messages from space, it must be pointed out that the detection probability of the experimental system at hand does not fulfil the requirements of an operational surveillance system (Delovski et al., 2014). Low detection probability is mainly caused by signal collision. This is because the area covered by a space-based ADS-B is much larger than that for a terrestrial system. For example, the swath width of TianTuo-3 is 1,200 nautical miles compared to approximately 200 nautical miles for a terrestrial receiver. Furthermore, ADS-B shares the Radio-Frequency (RF) channel with all radar and Traffic Collision Avoidance System (TCAS) surveillance signals. The traffic generated by surveillance signals in high density areas exceeds the ADS-B traffic by a factor of five or more (Blomenhofer et al., Reference Blomenhofer, Pawlitzki, Rosenthal and Escudero2012).
Aiming at alleviating the signal conflicts, many studies have been carried out and some efficient methods have been proposed. The signal collisions over the North Atlantic for a space-borne ADS-B receiver using the Aloha protocol has been simulated. The Aloha protocol is a computationally simple method of determining signal collisions and alleviating the necessity of running the full ADS-B model to determine missed messages (Van der Pryt and Vincent, Reference Van der Pryt and Vincent2015a; Reference Van der Pryt and Vincent2015b). Petrochilos and Piracci (Reference Petrochilos and Piracci2009) proposed an algorithm based on a projection technique to separate multiple Secondary Surveillance Radar (SSR) signals in multilateration systems, in which the signal structure is the same as that of ADS-B. Since a projection algorithm needs signal phase differences caused by a large distance between multiple antennae, this method is not suitable for alleviating the signal conflicts in spaceborne ADS-B. In fact, as the initial ADS-B system was not designed for space reception, the signal quality received in space is poor and hard to separate (Kharchenko et al., Reference Kharchenko, Barabanov and Grekhov2013; Delovski et al., Reference Delovski, Bredemeyer and Werner2016; Galati et al., Reference Galati, Piracci and Petrochilos2015). Cheng et al. (Reference Cheng, Chen and Chen2015) investigated a beam scanning method to address the problem of low ship detection probability, which can form a narrow beam to reduce signal collisions of Automatic Identification System (AIS) signals compared with a traditional wide beam antenna. This strategy is also useful for alleviating ADS-B signal collisions, but the control law for antenna scanning is not mature at present. A feasible method to improve detection probability is to sectorise the footprint by using a multi-beam antenna (Bettray et al., Reference Bettray, Litschke and Baggen2013). The Iridium-NEXT satellites, which will host the ADS-B receiver payloads with a uniform seven-beam antenna designed by Aireon, can greatly improve the performance of the space-based ADS-B (Garcia et al., Reference Garcia, Dolan and Hoag2017).
Considering the uneven distribution of aircraft, fixed beams still have the problem of signal collision in high density areas, while the beams oriented to the ocean and poles would receive few messages, leading to wasted power and a low detection probability. The adaptive multi-beamforming method described in this paper, with each beam covering a part of the footprint and the overlaps between beams being properly adjusted, as depicted in Figure 1, can both enable a large coverage area and improve detection probability. Specifically, we use several small beams to cover high density areas, and fewer large beams in low density areas.

Figure 1. Scheme of adaptive multi-beamforming for space-based ADS-B.
The design approach will define the number and arrangements of beams. Firstly, the detection probability of space-based ADS-B is calculated based on theoretical analysis, especially for cases that use multi-beam antennae to receive signals. Then the restrictions are numerically calculated, and the beam design problem is transformed into a multivariate optimisation problem. Finally, a simulation based on the ADS-B data obtained by the TianTuo-3 satellite is conducted to verify the effectiveness of the adaptive multi-beamforming method.
2. GLOBAL AIRCRAFT DETECTION ANALYSIS
2.1. Global aircraft distribution
The Micro and Nano Satellite Center of the Chinese National University of Defense Technology launched the first Chinese ADS-B satellite, TianTuo-3, to Sun-synchronous Low Earth Orbit (LEO) at a height of 496 km on 20 September 2015 (Li et al., Reference Li, Chen, Chen, Zhao, Sheng and Bai2017). The ADS-B payload on TianTuo-3 can receive four million messages transmitted by aircraft over 24 hours. The data users, including the civil aviation administration and some researchers, confirmed that the data can be used to improve aviation safety and efficiency (Zhao and Yu, Reference Zhao and Yu2018).
Figure 2 shows global aircraft distribution observed by TianTuo-3 in May 2017 from the recorded data. We can see that the numbers of aircraft in different areas differ greatly from each other. North America, Europe and eastern Asia have much higher aircraft density compared with other areas, and some fixed routes can be clearly seen.

Figure 2. Aircraft distribution observed by the TianTuo − 3 satellite in May 2017.
Since the detection probability cannot reach 100%, we cannot obtain an instantaneous global aircraft distribution. So, we obtained the global distribution by means of data accumulation with time. In fact, the total number of aircraft worldwide is rather easier to determine than their detailed distribution. We define the instantaneous global aircraft density function, f t(λ, φ), which is related to latitude and longitude. After giving the detection probability P TT3 of TianTuo-3, we have the following relation between density distribution and the total number of aircraft:
 $$\mathop{\vint\!\!\!\vint\!\!\!\vint}\limits_{\lambda\comma \varphi\comma t} P_{TT3} \cdot f_t \lpar \lambda\comma \; \varphi\rpar = M $$
where M is the accumulated number of aircraft in the area of interest within time t.
The number of large civil aircraft is 31,266 by using the historical data at flightradar24.com in 2017 and proportions of flights which were flying is assumed to be nearly equal in all areas. In this paper, only one message sent by the same aircraft was used and re-duplicated messages were deleted according to their Identity (ID), allocated by the International Civil Aircraft Organization (ICAO). If the accumulation time is adjusted to 14·95 hours from 00:00 on 1 May 2017, the position messages we received were exactly equal to 31,266. We then used the points obtained during this time to represent the global aircraft distribution.
2.2. Detection probability analysis
The Probability Of Detection (POD) is defined here as the percentage ratio between the actual number of position messages received and the expected number of position messages. The POD analysis is divided into two parts: the detection probability of the entire system, and the detection probability of each beam.
2.2.1. The POD of the system
If we know the detection probability of each aircraft, then we can define the POD for the entire system by the average detection probability of each aircraft, which is given by:
 $$P_d = \displaystyle{{1}\over{N_{a}}} \sum_{i=1}^{N_{a}} P \lpar a_i\rpar $$
where N a is the number of aircraft and P (a i) is the detection probability of aircraft a i.
It is obvious that the POD of an aircraft depends on whether the receiver can receive its messages. Therefore, the antenna gain and decoding performance of the receiver are two key points to decide the POD. If the antenna gain is high enough to receive the signal, then we can use the POD of the receiver to replace the POD of this aircraft. As shown in Figure 1, we defined P bj as the POD of beam b j. When aircraft a i is covered by only one beam, b j, then we can get  $P\lpar a_{i}\rpar = P_{b_{j}}$; if there is more than one channel that can receive the signal of a i, the POD of a i should be the joint probability of these beams:
  $P\lpar a_{i}\rpar = P \lpar \cup_{j=1}^{n} b_{j}\rpar $, so the relation between the POD of each aircraft and that of each beam can be given by:
 $$P\lpar a_i\rpar = \left\{\matrix{0\comma \; \quad n = 0 \hfill \cr P_{b_{j}}\comma \; \quad n=1 \hfill \cr \sum_{j=1}^{n} P_{b_j} - \sum_{1 \leq j \lt k \leq n}^{n} P_{b_j} P_{b_k} \hfill \cr \quad + \sum_{1 \leq j \lt k \lt l \leq n}^n P_{b_j} P_{b_k} P_{b_i} + \cdots + \lpar -\rpar^{n-1} P_{b_1} P_{b_2} \cdots P_{b_n}\comma \; \quad \hbox{others}\hfill}\right. $$
Since our goal is to achieve global surveillance, the detection probability and refresh rate should be high. The theoretical minimum aggregate average P d necessary to support a detection probability P UI within time T UI can be computed as follows (Garcia et al., Reference Garcia, Stafford, Minnix and Dolan2015):
 $$\lpar 1 - P_{UI}\rpar = \lpar 1-P_d\rpar ^{\lpar T_{UI}^{\ast}\ f_{position_{tx}}\rpar } $$
where f position,tx = 2 Hz is the transmission rate of ADS-B position messages.
2.2.2. The POD of each beam
Because the coverage of a satellite is much larger than that of a ground station, the ADS-B receiver on the satellite may be simultaneously visible to a large number of aircraft and other transmitters using 1,090 MHz, such as an Air Traffic Control Radar Beacon System (ATCRBS), Identification Friend or Foe (IFF) system, and Mode S. In this paper, the objective of beam optimisation is to alleviate co-channel interference. The system detection probability can be regarded as the product of receiver detection probability and environment impact factor:
 $$P_d = P_R P_{env} $$
where P R is mainly caused by False Replies Uncorrelated In Time (FRUIT). The FRUIT, which is a specialised vocabulary used in the Air Traffic Control (ATC) industry, mainly includes interferences of ATCRBS and IFF, Mode S and 1090ES (RTCA, 2008). As these interferences are irrelevant, we can rewrite P env by:
 $$P_{env} = P_{ATCRBS} P_{ES} P_{ModeS} $$
where P env is the ‘penalty’ factor of co-channel interference caused by ATCRBS, 1090ES and Mode S. This means that detection performance can deteriorate due to these combined effects. The most commonly used approach when modelling FRUIT is to assume that its effect corresponds to a Poisson Arrival Rate behaviour (Van der Pryt and Vincent, Reference Van der Pryt and Vincent2015a; Reference Van der Pryt and Vincent2015b). The assumption of a Poisson Arrival Rate system is that the messaging scheme corresponds to that of a random-access channel. For the conservative case of a channel with perfect reception of non-interfered messages and zero reception of overlapped messages, as the offered load, G, increases, the detection probability of a message decreases exponentially, that is, P msg = e −G. The terms G are the offered load values for each respective link technology. For example, G ES = M ESτ ES, and M ES is the Mode S arrival rate (messages/sec) and τ ModeS = 64 + 120 μs is the duration of each Mode S message plus the duration of a 1090ES messages. The other duration values are given by τ ATCRBS = 141μs, τ ModeS = 184μs, and τ ES = 240μs.
The transmission rate of ADS-B equates to an average of 6·2 messages per second. Successive messages of each type are transmitted alternately from top to bottom antennae, so an average of 3·1 messages per second are generated by the top antenna. Only ADS-B transmissions from the upper antenna were considered since reflected signals from the Earth's surface are too weak for detection by the ADS-B payload. Furthermore, the assumption in Table 1 are consistent with results from Garcia et al. (Reference Garcia, Stafford, Minnix and Dolan2015). The four main types of ADS-B message convey position, velocity, event and identification information. Position message transmission rate equates to an average of one message per second.
Table 1. Aircraft transmitter categorisation assumptions

The antenna was designed to receive signals whose power are above 125 W. As the transmitted power of ATCRBS is lower than 125 W, it cannot be detected by the space-based ADS-B payload. Therefore, the interference of ATCRBS is omitted, and the POD for one beam can be reduced to:
 $$P_d = e^{-G_{ADS-B}- G_{ModeS}} $$
Combining Equations (2)–(6) leads to the relation between the POD of the ADS-B system and the number of aircraft. Putting all these assumptions together leads to the basis of our model.
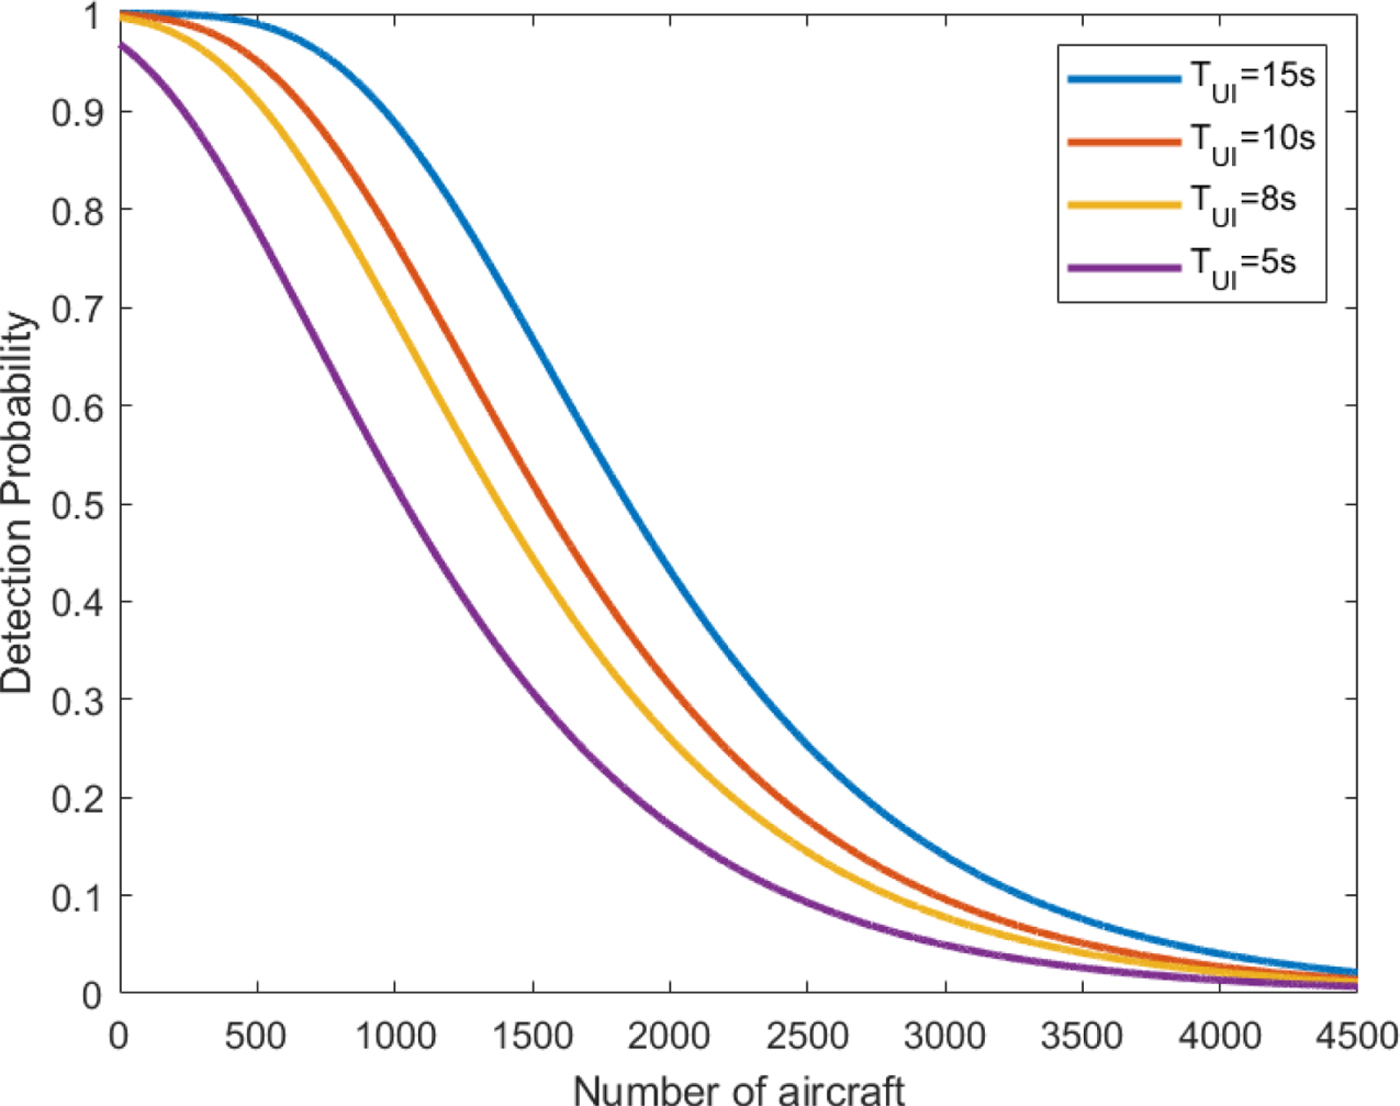
In Iridium-NEXT's case, the service being advertised will be capable of supporting continuous global, near real-time surveillance at a 10 s Update Interval (UI) greater than or equal to 95% of the time for oceanic and low-density aircraft environments. Notionally, with proper navigation communication performance available, this 10 s UI performance could support 10 NM or less separation services depending on the outcome of the ICAO and regional Air Navigation Service Provider (ANSP) safety case assessments. Therefore, for the sake of simplicity, our criterion for the evaluation of performance of core mission is for the 10 s UI to be met greater than or equal to 95% for 125 W equipped aircraft with a top-mounted or diversity antenna.
Figure 3 shows the aircraft detection probability as a function of the number of aircraft within the observation area. For a 10 s UI to be met greater than or equal to 95% of the time, the number of aircraft covered by one beam should be less than 510. Currently, Eurocontrol's GEN-SUR document (Eurocontrol, 2015) describes terrestrial En-Route (5 NM) and Terminal (2-3 NM) surveillance applications requiring 8 s and 5 s UIs, respectively. Hence, the number of aircraft in one beam should be less than 510, at least for ATM use.

Figure 3. Detection probability for different number of visible aircraft.
3. THE ADS-B RECEIVER AND ANTENNA
A complete receiving system includes the antenna and receiver. For practical purposes, the link budget is analysed in detail. The Multi-Beam Antenna (MBA) synthesising technology usually includes the antenna type selection, design and distribution of elements, and design of the phasing network (Guenad et al., 2005).
3.1. Receiver structure
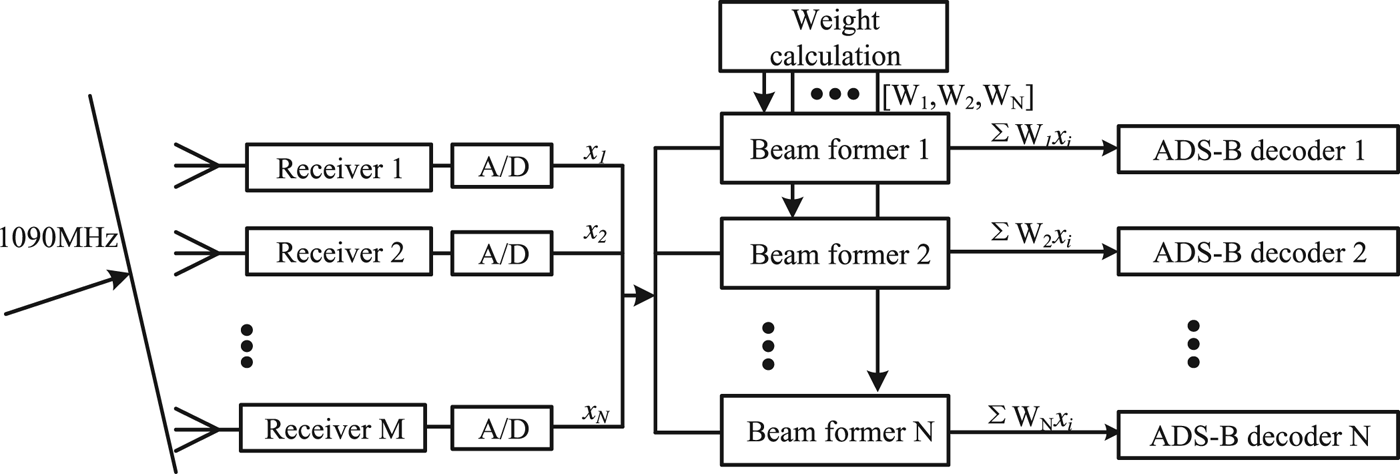
The weighting of antenna elements can be realised in a digital beamforming system through digital signal processing. As Figure 4 shows, M receivers are connected with M elements of antenna. After filtering and amplification, analogue signals are converted to digital signals by an Analogue/Digital (A/D) converter. N beamformers produce N combined signals using these N-way signals. Then, these signals are demodulated and decoded. Finally, the extracted messages are downloaded to the ground station.

Figure 4. Signal processing flow chart for adaptive multi-beamforming.
3.2. Link budget calculation
One of the key points of satellite communication system is the link budget. We take a LEO satellite whose orbit height is 780 km as an example. The transmission power of the transmitter (class A, basic) is 125 W. The transmission loss and antenna gain as well as other factors can be calculated from the data in Table 2. In order to receive the signal, which is 63° off nadir, the antenna gain should be above 21dB.
Table 2. Link budget parameters for ADS-B satellite

3.3. Hexagonal array antenna design
An antenna array is a set of multiple connected antennae which work together as a single antenna, to transmit or receive radio waves. The individual antennae (often called elements) are connected to a single receiver or transmitter by feedlines that feed the power to the elements in a specific phase relationship. When individual antenna elements are aggregated into arrays, new response/radiation patterns are created which depend upon both the element patterns and the geometry of the array. These patterns are called beam patterns. More often, but not always, the array consists of identical antennae. The identical antenna case is interesting because it lets us partition the radiation pattern into two components: one component describes the element radiation pattern and the second describes the array radiation pattern.
In this paper, we discuss arrays whose elements are located on a hexagonal (or equilateral triangular) grid, as shown in Figure 4. We think that the hexagonal array would be an efficient arrangement for space-based ADS-B. In fact, Sharp proved that if the main beam is required to scan inside a cone whose axis is normal to the array, then the number of elements can be reduced by 13·4% (Sharp, Reference Sharp1961).
To illustrate the notion, consider the standard 19-element Uniform Hexagonal Array (UHA) shown in Figure 5. Array elements lie in the y-z-plane. Our discussion will focus on triangular-grid arrays that have six equal sides with d x = λ/2, and  $d_{y} = \sqrt{3} \lambda/4$ where λ is the wavelength corresponding to the operating frequency of ADS-B (1,090 MHz). The total number of elements will be 19, and dimensions of this array will be 1,000 mm ×1,000 mm ×50 mm. Table 3 shows the parameters of this ADS-B hexagonal array.

Figure 5. The uniform hexagonal array for space-based ADS-B.
Table 3. The parameters of the ADS-B hexagonal array

When evaluated at the reference distance, we start with a simple model of the radiation field produced by a single antenna which is given by:
 $$F\lpar \theta\comma \; \varphi\rpar = w_i \cdot f \lpar \theta\comma \; \varphi\rpar \comma \; w_i = I_i e^{j\alpha_i} $$
where I i and αi represent its excitation amplitude and phase, and f(θ, φ) is the normalised element field pattern. Let (y i, z i) be the position of the i-th element, for an array of identical elements, the output of the array is the weighted sum of the individual elements:
 $$B\lpar \theta\comma \; \varphi\rpar = \sum_{i=1}^{Ne}\exp \lsqb jk \sin \theta \lpar y_i \cos \varphi + z_i \sin \varphi\rpar \rsqb \cdot F\lpar \theta\comma \; \varphi\rpar \comma \; \ k = \displaystyle{{2\pi}\over {\lambda}} $$
where N e is the number of the elements. Considering that an antenna forms N b beams:  $\lpar \vec{B}_{1}\comma \; \vec{B}_{1}\comma \; \ldots\comma \; \vec{B}_{Nb}\rpar $, by Ne elements, the weight factor of the i-th element for the j-th beam is w i, j, then the beam forming weight matrix for directions of arrival for receiving arrays has the form:
 $$W_{Nb\comma Ne} = \left[\matrix{w_{1\comma 1} & w_{1\comma 2} &\cdots & w_{1\comma Ne} \cr w_{2\comma 1} & w_{2\comma 2} &\cdots & w_{2\comma Ne} \cr \vdots &\vdots &\ddots &\vdots \cr w_{Nb\comma 1} & w_{Nb\comma 2} &\cdots & w_{Nb\comma Ne}}\right]$$
For the conventional beamformer, the weights are chosen to maximise the response of the array for an arrival direction; for space-based ADS-B, this strategy may not be optimal. The detail will be discussed in Section 4.
4. ADAPTIVE MULTI-BEAMFORMING DESIGN
4.1. The idea of the adaptive multi-beamforming design
To maximise the probability of detection by the array antenna, we should give a reasonable design of beam size and direction. Considering that the aircraft density distribution is extremely uneven in different regions, if we apply one beam in high density areas, the system still faces the elevated risk of signal conflict, while an identical size beam oriented to a low-density area (such as ocean and polar regions) may receive only a few messages. Therefore, an adaptive beam adjustment algorithm is proposed in this paper, which uses a small number of large beams to cover low-density regions and more narrow beams to cover high-density regions.
In antenna array problems, there are many commonly-used parameters that can be applied to evaluate the characteristics, such as gain, side lobe level and directivity, but it is hard to give a specific relationship between detection probability and antenna using these parameters. We shall give an analytic relation between detection probability and design of antenna first. It can then be transformed to a multi-variable optimal problem. Finally, a genetic algorithm will be used to find the optimal solution.
4.2. Analysis of ground coverage
Since LEO satellites have large coverage angles, the ‘marginal problem’ and ‘near-far effect’ are obvious, thus the attenuation difference must be compensated by adjusting antenna gain.
In our model, every targets' attenuation should be calculated, for the probability of signal conflict depends on the number of signals which can trigger the receiver's sensitivity level. Spherical coordinates are used to describe the antenna pattern. As Figure 5 shows, the azimuth angle of a vector is the angle between the x-axis and the orthogonal projection of the vector onto the x-y plane. The elevation angle is the angle between the vector and its orthogonal projection onto the x-y-plane. The angle is positive when going toward the positive z-axis from the x-y plane. These definitions assume the boresight direction is the positive x-axis.
To describe the position of an aircraft in the antenna ontology coordinate system, the coordinates described by longitude and latitude will be converted into elevation angles and azimuth angles of the antenna. In geocentric inertial coordinates (see Figure 6) let A be the position of an aircraft, S be the satellite position, and C be the sub-satellite point. Take R as a reference point, which has the same longitude as C. Then the elevation angle can be defined as the angle between vector  $\overrightarrow{SC}$ and
  $\overrightarrow{SA}$ and the azimuth angle can be defined as the angle between two planes: SAC and SCR.

Figure 6. Position relations of different coordinate systems.
 $$el = \hbox{arccos} \left(\displaystyle{{\overrightarrow{SC}\cdot \overrightarrow{SA}} \over {\vert \overrightarrow{SC}\vert \vert\overrightarrow{SA}\vert}}\right)\comma \; \quad az=\hbox{arccos} \left(\displaystyle{{\vec{r_1}\cdot \vec{r_2}} \over {\vert \vec{r_1}\vert \vert\vec{ r_2}\vert}}\right)$$
where  $\vec{r_{1}}=\overrightarrow{SC}\times \overrightarrow{SA}\comma \; \vec{r_{2}} = \overrightarrow{SC}\times \overrightarrow{SR}$. It is easy to find that the line of sight distance between the aircraft and the satellite is
  $\vert\overrightarrow{SA}\vert$, then the free-space path loss can be computed from:
 $$L_{Fs} \lpar dB\rpar = 32{\cdot}4 + 20\hbox{lg} f + 20 \hbox{lg} \vert \overrightarrow{SA}\vert $$
where L FS is the free-space path loss and f = 1, 090 MHz.
Also, we need to convert location from longitude and latitude to rectangular coordinates:
 $$\left\{\matrix{x= \lpar N + H\rpar \cos B \cos L \cr y = \lpar N + H\rpar \cos B \cos L \cr z = \lsqb N \lpar 1 -e^2\rpar + H\rsqb \sin B}\right. $$
where B, L and H represent geodetic latitude, longitude and height, respectively, and  $N = \displaystyle{{a} \over {\sqrt{1- e^{2} \sin^{2} B}}}$ is the radius of curvature of the prime vertical ring. Furthermore, we can calculate the antenna's field strength on a flat Earth and display it on the map by the algorithm mentioned above; an example is given in Section 5.
4.3. Adaptive multi-beamforming design using Genetic Algorithm (GA)
The synthesis of an antenna array with a specific radiation pattern, limited by several constraints, is a nonlinear problem. It can be solved by many known analytical optimisation methods. However, in some complex synthesis cases such as a radiation pattern with various main beams, the classical methods become inefficient, because they are vulnerable to local-minima-related difficulties. In this paper, the genetic algorithm is developed to solve problems of antenna-array synthesis.
A GA uses random search methods, which are robust and capable of solving complicated and nonlinear search problems. In computer science and operations research, GA is a metaheuristic inspired by the process of natural selection that belongs to the larger class of Evolutionary Algorithms (EA). Genetic algorithms are commonly used to generate high-quality solutions to optimisation and search problems by relying on bio-inspired operators such as mutation, crossover and selection (Marcano and Duran, Reference Marcano and Duran2000).
In the planar-array case, the GA directly changes the phase and amplitude of each element of the array until the desired radiation pattern is achieved. Considering a problem that requires the optimisation of a specific fitness function which depends on multiple variables, a collection or group of chromosomes is defined, where each chromosome is assigned a random weight matrix as defined by Equation (10). The fitness function related to the system detection probability can be recognised by Equation (4).
 $$\min Fn = 1 - P_{UI} $$
The GA is then used to find the optimum group of weights to minimise the fitness function. As shown in Figure 1, our main research was focused on the satellite-covered area. Since the aircraft in this area should be detected, a penalty factor would be added in a GA algorithm if there was any target that could not be covered.
In this paper, the GA is improved for better system performance. A fixed-seven-beam weight with random disturbance is used in the algorithm in order to accelerate its convergence speed. Once antenna weights are given, the beam pattern can be synthesised according to Equation (9). Whether a signal can trigger the receiver's sensitivity level or not can be calculated from Table 2. Counting the number of signals which can be detected by the payload on the satellite, detection probability can be calculated by Equation (2). Combining Equations (4) and (14) will allow us to conclude whether these weights meet the mission requirements. The following outlines how the adaptive multi-beamforming procedure works using GA:
(1) Input the current time and the orbit parameters of the satellite. The footprint of the satellite can then be computed based on these parameters.
(2) Read the ADS-B historical database and capture the aircraft position distribution within the satellite's footprint.
(3) Begin with a group of random patterns by generating initial coefficients. A group of chromosomes are assigned with a random weights matrix as defined by Equation (10).
(4) Use GA to find the minimum of this fitness function. The detection probability is calculated at each point and then the algorithm creates a sequence of new populations. At each step, the algorithm uses the individuals in the current generation to create the next population. To do so, the algorithm performs the following steps:
a. Compute optimisation criterion: score each member of the current population by computing its fitness value according to Equation (14).
b. Select members, called parents, based on their fitness.
c. Some of the individuals in the current population that have lower fitness are chosen as the elite. These elite individuals are passed to the next population.
d. Produce children from the parents. Children are produced either by making random changes to a single parent (mutation) or two parents (crossover).
e. Replace the current population with the children to form the next generation.
(5) The algorithm stops when one of the stopping criteria is met: generations limit, time limit, fitness limit, function tolerance.
(6) Determine whether the designed antenna meets the requirements. If the answer is no, then rearrange the antenna design and go to the third step, otherwise output the results.
Adapting the weights of the antenna in real time can realise the maximum detection probability, because the number and distribution of aircraft is changing all the time. Considering that the GA consumes significant resources and time, which is a heavy load for the computer on a satellite, the update cycle should not be too short. Through analysis of 31 months ADS-B data obtained by the TianTuo-3 satellite, there were hardly any changes of the number of aircraft and their distribution in the world over a month. Therefore, the weights will be changed based on analysis of traffic every month. Figure 7 shows a flowchart diagram of the main steps of the adaptive multi-beamforming design using GA.

Figure 7. Flowchart of adaptive multi-beamforming design.
5. SIMULATION AND EVALUATION
As an example, we discuss the performance of the adaptive multi-beamforming algorithm in eastern China. The height of the satellite was set to the same as that of Iridium-NEXT, which announced that they will achieve the first global ADS-B surveillance system.
In contrast, we first use the traditional uniform hexagonal array with seven fixed uniform beams: beams 1 to 6 point to a specific elevation direction within a specific azimuth plane (az = 0°, 60°, 120°, 180°, 240°, 300°); beam 7 points to the nadir (el = 0°). The beam pattern in UV space is shown in Figure 8(a). Noting that the pattern function of each element in the array is constant over each angle, that is, f(θ, φ) = 1, the gain of the antenna is normalised for purposes of simplicity.

Figure 8. Simulation synthesis results for uniform seven-beam. (a) Normalised pattern of antenna. (b) Contours projected on map of eastern China. The scatters are marked by different colour to represent the aircraft covered by different beams.
In our simulation of adaptive multi-beamforming methods using GA, the population size is 20. By using an N-bit phase shifter to form a uniform seven-beam pattern, the algorithm converged after 150 generations.
The link budget is calculated to judge whether a signal can trigger the Receiver's sensitivity level. If the received signal level is bigger than −95 dBm, it can be detected in the ADS-B payload on the satellite, because the sensitivity of the ADS-B receiver on TianTuo-3 satellite is −95 dBm. A message collision will occur if there are several signals whose levels are above the sensitivity level simultaneously flushed into the ADS-B receiver, which leads to an exponential decline of detection probability.
Figure 8(b) shows the contours projected on the ground of eastern China. The off-nadir beams form several irregular ovals, and this is caused by the tilt projection.
In Figure 9, we plot the magnitude as a function of longitude and latitude. It is easy to see that the beams oriented to the sparse area are large, while the beams oriented to high density areas are relatively small. For example, the beam pointing to Beijing is small, for this city is a transport hub and many flights take-off and land here. In contrast, the beam that points to the ocean is wide. The narrow beam can mitigate signal collisions and has stronger detection capacity. The results we obtained generally fitted our theoretical analysis.

Figure 9. Simulation synthesis results for adaptive multi-beam array. (a) Normalised pattern of antenna. (b) Contours projected on map of eastern China.
Figure 10 shows the relationship between missing probability and the number of flights in the areas of interest. The number on the horizontal coordinate represents the number of flights ranging from 500 to 3,500, since the maximum number of flights a LEO satellite can cover simultaneously is less than 3,000. The probability of missing a detection sharply increases with the increase of the number of flights. Specifically, the adaptive multi-beam design can halve the miss probability compared to a uniform seven-beam antenna with the same number of flights. The greater the number of flights covered, the more detection probability improved compared to traditional methods, and the POD improves by18% when the number of aircraft reaches 3,500.

Figure 10. The relationship between missing probability and the number of flights.
6. CONCLUSION
In this paper, we investigated a uniform hexagonal array. An adaptive multi-beamforming method based on this antenna is proposed to enhance aircraft detection probability. The preliminary analysis of the results for an ADS-B satellite at an altitude of 780 km shows these improvements are considerable. Firstly, the narrow beam has a large gain that improves the strength of the ADS-B signal and suppress interference, which improves detection capacity in high density regions. The higher the number of flights covered, the more detection probability improved compared to traditional methods. Secondly, by using this adaptive multi-beamforming method, the array antenna can cover a larger area compared to fixed multi-beam antennae. Our algorithms can take full advantage of the antenna capabilities.
Although all the above conclusions are drawn from the assumption that an ADS-B satellite moves in a 780 km orbit, similar performance can be obtained at different orbit altitudes in LEO. The difference may lie in satellite's field of view, number and size of beams. In conclusion, the adaptive multi-beamforming method is a promising innovation in space-based ADS-B detection and would be expected to apply in our space-based ADS-B system.
Future work may focus on the manufacturing and deployment of systems for verification on a satellite platform.
ACKNOWLEDGEMENTS
This research has been supported by the National Key Research and Development Program of China under grant 2016YFB0502402.