


Introduction
The African tomato is an important fruit and vegetable crop. It is widely used in salads as well as for culinary purposes. The fruit contains significant amounts of vitamin A and C, lycopene, β-carotene, magnesium, iron, phosphorus, potassium, riboflavin, niacin, sodium and thiamine with antioxidant properties and potential beneficial health effects (Zhang et al., Reference Zhang, Sebastiani, Liu, Schembri, Dumas, Langer, Alekseyev, O'Connor, Brooks and Spira2010).
The African tomato exhibits broad diversity and can be produced in peripheral areas. The identification of variability among landraces is essential to the maintenance and utilization of germplasm resources (Shirasawa et al., Reference Shirasawa, Ishii, Kim, Ban, Suzuki, Ito, Muranaka, Kobayashi, Nagata, Isobe and Tabata2013). The study and evaluation of germplasm is importance for current, future agronomic and genetic improvement of the tomato crop (Reddy et al., Reference Reddy, Reddy, Reddy and Begum2013). Morphological and molecular markers can be used to identify and estimate the genetic diversity of plants.
In Africa, tomato production has been greatly affected by biotic and abiotic stresses. However, African tomato species which are adapted to harsh growing conditions may possess genes for adaptation to these biotic and abiotic stresses. In Africa, there are diverse Solanaceae species whose phenotypic and genotypic traits are neither characterized nor documented. Lack of molecular markers that detect differences between best breeding lines of tomato has prevented a detailed study of most qualities of economic importance within genetic backgrounds that are relevant to plant breeders, growers and processors. Morphological and genetic diversity of the African tomato is therefore required to progress the genetic resource base for future crop improvement programmes. Single nucleotide polymorphisms (SNPs) can be mined from sequence data to characterize allelic variation, genome-wide mapping and for marker-assisted selection (Yang et al., Reference Yang, Bai, Kabelka, Eaton, Kamoun, vander Knaap and Francis2004). This study was done to characterize the African tomato landraces using morphological and molecular biology tools.
Materials and methods
Morphological characterization
Sampling sites and sampling
Seventeen African tomato landraces were collected from the Solanaceae gene (Table 1) conservation stations at the Asian Vegetable Center, Regional Center for Africa (AVRDC- RCA), and Arusha, Tanzania.
Table 1. African tomato landraces used in this study
Viability check and pre-germination
Ten seeds of each landrace were planted on petri-dishes with wet paper for 10 d ensuring the paper did not dry out during this time. All African landraces with 70% and above germination rates were used for pre-germination on trays containing peat moss media in the greenhouses at the Jomo Kenyatta University (JKUAT) Institute of Biotechnology Research laboratory (IBR).
After 4 weeks, germinated seeds were transplanted in potting bags containing well-mixed forest soil, and manure in the ratio of 3:1 and placed in the IBR greenhouse.
Experimental design and layout
Complete Random Block Design (CRBD) was used to set up an evaluation plot in an open field at the JKUAT farm. The 17 landraces were sown in three blocks each containing three plots. Six replicates of each landrace were grown in each plot but data were collected of six samples from each block such that each landrace had a total of 18 plants, with a total of 306 plants from all 17 African Tomato landraces.
Phenotypic characterization
Measurements and observations were taken from six tagged individual plants selected from 18 plants of each landrace. Phenotyping was carried out using nine quantitative and nine qualitative traits to estimate the levels of variation among the African tomato landraces. Vegetative data were collected when 50% of the plants had flowered (Table 2), while the fruit data were collected at mature green, mature breaker and mature red stages.
Table 2. Morphological characterization at vegetative and reproductive stages at the JKUAT greenhouse
PH, plant height; determ, determinate; indeterm, indeterminate; ST, stem colour; LBL, leaf blade length; LW, leaf width; LVC, leaf vein colour; LBC, leaf blade colour; PC, petiole colour; LBS, leaf base shape; FS, fruit shape; FC, fruit colour; FL, fruit length; FW, fruit width; FT, fruit texture; FY, fruit yield; G + P, green and purple stripes; ASY, asymmetrical; Sym, symmetrical. Significant differences were observed in the various morphological characteristics evaluated at the vegetative and reproductive stages.
Data analyses
Analysis of variance (ANOVA) was carried out to determine genetic diversity of the measured nine quantitative traits. Means for each trait were separated by the least significant difference at (P < 0.05). Phenotypic correlation coefficients were computed to examine the degree of association among the quantitative traits. Multivariate ANOVA was conducted to reveal the patterns of phenotypic diversity of quantitative traits studied. Means of each quantitative character were standardized before subjecting to principal component analysis (PCA) as was suggested by Reddy et al. (Reference Reddy, Ramesh, Reddy and Kumar2009). The standardized data of nine quantitative traits were then used as an input for the PCA biplot loading and cluster analysis. An agglomerative, hierarchical cluster classification technique with average linkage strategy was performed. Statistical analysis was done using GenStat Discovery, Edition 4.
Molecular characterization
Sample collection
Seeds from the 17 African tomato landraces were planted at the Boyce Thompson Institute for plant research at Cornell University, USA. Leaf samples after the 3 weeks and fruit samples at the three fruiting stages (mature green, mature breaker and mature red/yellow) were used.
RNA extraction
Leaf and fruit sample were collected using sterile forceps and immediately kept in well-labelled falcon tubes containing liquid nitrogen. This was followed by RNA extraction using the modified Trizol method by Kumar et al. (Reference Kumar, Tyagi and Sharma2011). The leaf and fruit RNA was quantified using a nanodrop and its quality checked by viewing the gel through the UV light.
Library construction
RNA extraction was followed by library construction using the modified protocol by Zhong et al., (Reference Zhong, Joung, Zheng, Chen, Liu, Shao, Xiang, Fei and Giovannoni2011). The library quality and quantity was checked by viewing through the UV light and cubit equipment, respectively. The libraries were later multiplexed using different barcodes to make a lane.
Sequencing
The multiplexed libraries were then sent to the Biotechnology Resource Centre (BRC) at the Cornell University in the USA for sequencing using the Illumina platform.
Phenotypic data collection
Data were collected at both vegetative and reproduction stages. Vegetative data included stem colour, petiole colour, leaf base shape, leaf colour, plant growth habit, height of the plant at 50% fruiting, and at reproductive stage included fruit shape, colour and texture.
Computational data analyses
Differential gene expression
Filtering of the primer, adaptor, ribosomal RNA (rRNA) was done using the next generation sequencing (NGSQ) tool kit to have filtered high-quality reads. Ribosomal contamination was filtered from the high-quality RNA –seq reads using Ribopicker v 0.4.3 (Wang et al., Reference Wang, Li and Hakonarson2010; Lee et al., Reference Lee, Guo, Wang, Kim and Paterson2014). The non-rRNA Fastq sequences were used for differential gene expression. TopHat software was used to align the non-rRNA to Solanum lycopersicum SL2.5.,0 genome from Ensembl Genomes, for initial assembly, this is because Tophat identifies splice junctions and handles assembly of reads to reference genome even where big gaps (introns) are present. This is important for gene expression in coding regions only. Splice junctions occur between an intron and exon, it was also used to convert the non-rRNA sequence to a BAM file, the Cufflink was used to assemble the transcripts followed by the Cuff Compare, which compared two or more transcripts, the compared transcripts were merged using the Cuff Merge and Cuffdiff was used for differential gene expressions. The Cummerbund was used to plot the abundance of the differential genes expressed while the R Studio was used to visualize the graphs charts and tables (Fig. 1).
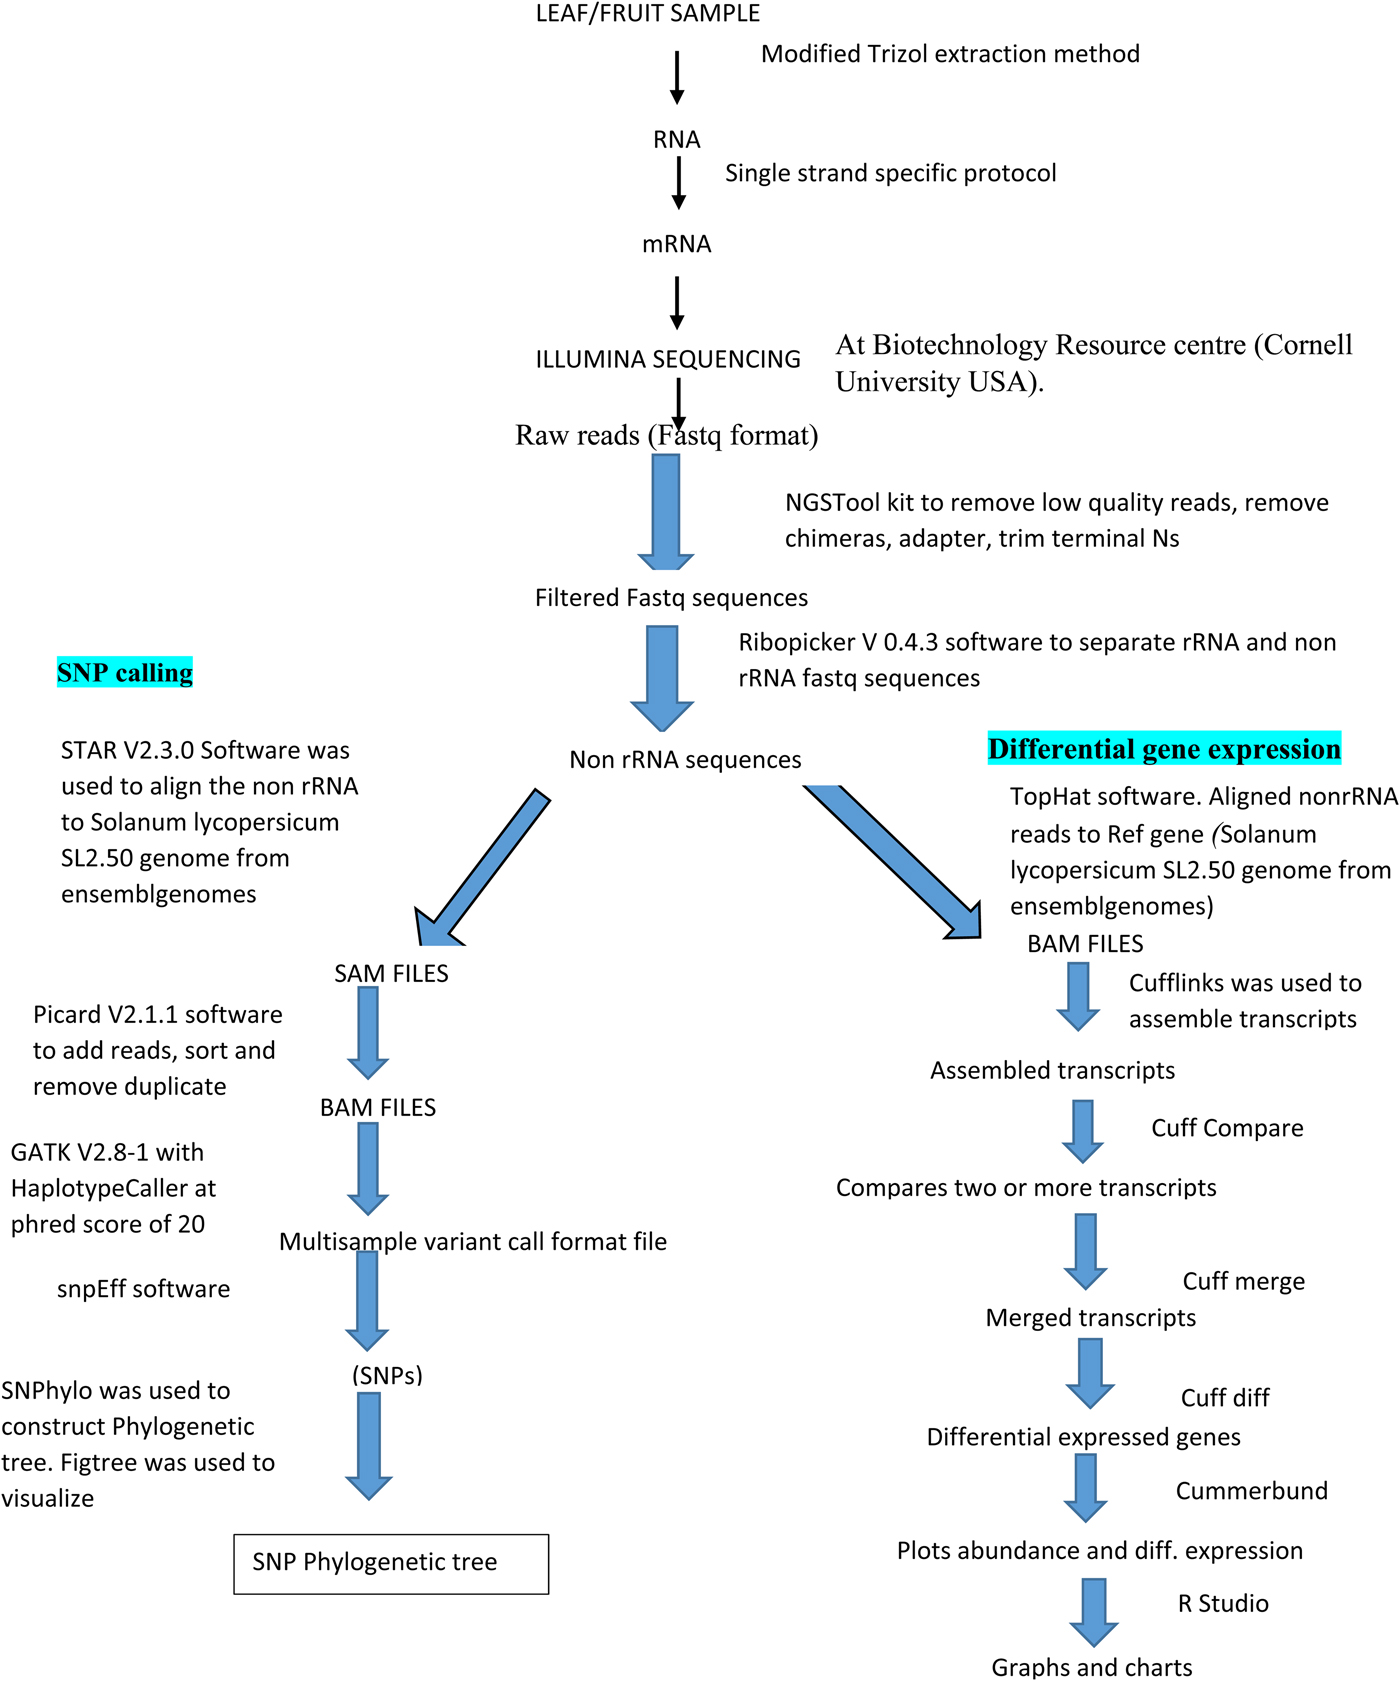
Fig. 1. Workflow showing SNP mining steps and differential gene expression.
SNPs mining
Separate and adapter/barcode trimmed sequences from Illumina were checked for quality using NGS tool kit (Lee et al., Reference Lee, Guo, Wang, Kim and Paterson2014) and high-quality reads filtered. Ribosomal contamination was filtered from the high-quality RNA – seq reads using Ribopicker v 0.4.3 (Nielsen et al., Reference Nielsen, Albrechtsen and Song2011; Lee et al., Reference Lee, Guo, Wang, Kim and Paterson2014). The reads were aligned to the S. lycopersicum SL2.50 genome from Ensembl Genomes using STARv 2.3.0 (Nielsen et al., Reference Nielsen, Albrechtsen and Song2011; Lee et al., Reference Lee, Guo, Wang, Kim and Paterson2014) using default settings. STAR v 2.3.0 was used because nucleotide polymorphism mining was done from both exons and introns yielding to a SAM alignment file, to the SAM file, read groups were added, duplicate reads removed, reads sorted by coordinates and the file converted to BAM file and indexed using Picard – tools v2.1.1 (Nielsen et al., Reference Nielsen, Albrechtsen and Song2011; Lee et al., Reference Lee, Guo, Wang, Kim and Paterson2014). The genome analysis tool kit unified genotyper v2.8-1 (GATK) was used to call SNPs in all the samples, resulting in a multi-sample variant call format (VCF) file (Nielsen et al., Reference Nielsen, Albrechtsen and Song2011; Lee et al., Reference Lee, Guo, Wang, Kim and Paterson2014). Default parameters were used for SNP calling in GATK with HaplotypeCaller set at phred-scaled confidence threshold of 20. Annotation and prediction of effects and variants on genes in the VCF file was done using snpEff and SNP phylogenetic tree constructed with SNPhyo (Wang et al., Reference Wang, Li and Hakonarson2010; Dewey, Reference Dewey2011; Lee et al., Reference Lee, Guo, Wang, Kim and Paterson2014). The generated tree was visualized using Figtree (Fig. 1).
Results
Phenotypic variation
S tem colour: 12 landraces had green stems, while three, one and one landraces had purple and green colour, purple and light purple colours, respectively (Table 2).
Plant growth habit and leaf colour
Variation was observed on the plant growth habit with 13 accessions having the indeterminate growth habit and only four accessions having determinate growth habit. Leaf colour varied from green to light green and dark green (Table 2).
Petiole colour
Variation was observed in the African tomato with most landraces (16) showing the presence of anthocyanin (Table 2).
Leaf margins, leaf vein leaf lobbing margins and leaf base shape
The African tomato showed either asymmetrical leaf base shape (14 landraces) or heart leaf base shape (three landraces) at the point where the stalk meets the leaf (Table 2).
F r u it shape: The African tomato exhibited diversity in shapes including – three landraces showed kidney shape, two landraces showed oblong shape, three had oval shape while most landraces (nine) had a round shape (Fig. 2 and Table 2).
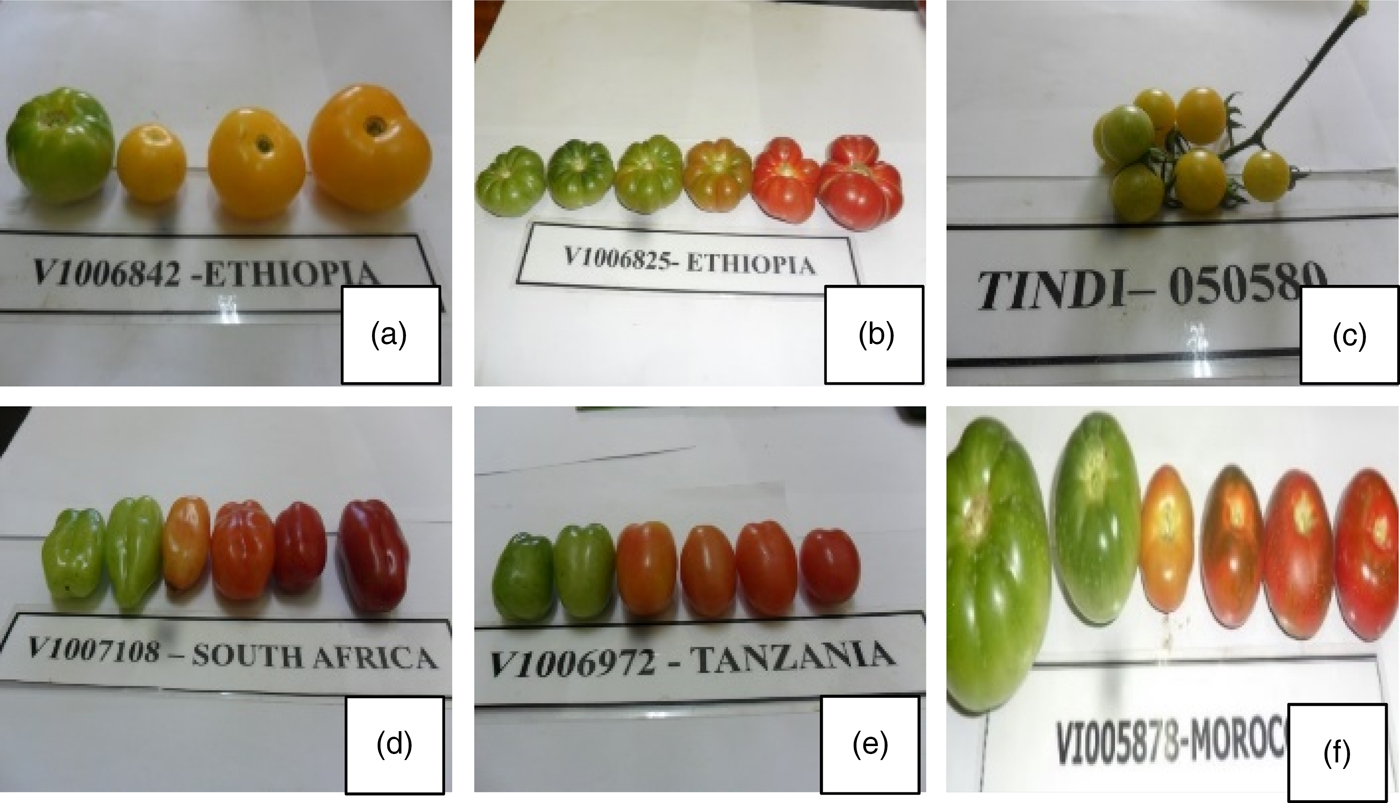
Fig. 2. African tomato was either round (nine landraces – a, b, c, f), oval (three – e), oblong (two – d) or kidney (three – b) in shape. The surface was either smooth (eight – a, c, d, e, f) or ridged (nine – b, d). African tomato was either red (12 – b, d, f,) (accessions), pink (two – e) or yellow (three – a, c) in colour when ripe.
F r u it colour: African tomato had red colour (12). Two landraces had pink, while two landraces were yellow in colour (Fig. 2 and Table 2).
Fractional analysis presentation of the African tomato
The fraction analysis shows that the African tomato is wide diverse. However, overlapping of the landraces was observed showing that some landraces are closely associated, for instance, landraces V1005878 and L05942 and V1006833 and RV102112. Other landraces clustered far from others showing high divergence, while Tindi 050589 and Tindi 050590 are closely located but far from other landraces (online Supplementary Fig. S1).
Dendrogram presentation
The 17 African landraces grouped into three major clusters with many sub clusters using morphological data (online Supplementary Fig. S2). Cluster 1 had four accessions, cluster 2 had two accessions while cluster 3 had 11 accessions. Main contributing factor in cluster 1 was green and purple stripes petiole colour and same green leaf blade colour; with all the four accessions having green colour.
Cluster 2 had landraces that had similar phenotypes, i.e. Tindi 050589 and Tindi 050590 which were of cherry type grouped closely using morphological data. These two landraces had same fruit size (cherry), same fruit colour (yellow), same fruit shape (round) same fruit surface texture (smooth) and were both indeterminate.
Cluster 3 comprised of landraces which were closely related in leaf blade colour, stem colour and fruit texture. Examples of these landraces included V1005872, V1005987, V1006842 and V1005874.
PCA of the quantitative traits
The first seven principal components (PC1, PC 2, PC3, PC4, PC5, PC6 and PC7) analysed covered 68.51% variation within the 14 dimensions generated (online Supplementary Table S1). The quantitative traits that contribute more to PC1 were fruit length, width internode height and leaf length accounting for 20.89% of the total variation. The PC2 accounted for 11.63% of the total variation due to fruit length and fruit mass; PC3, PC4, PC5 and PC6 accounted for 9.54, 7.92, 6.75, 6.16% of total variation due petal number, plant height, petal number and plant width, respectively; PC7 accounted for 5.52% due to leaf length, leaf width, plant height and plant width (online Supplementary Table S1).
Simple matrix correlation of the phenotypic traits
There was significant positive correlation between leaf blade length (r = 0. 72, P < 0.01), leaf width and fruit yield and plant height and plant width (r = 0.446, P < 0.01); significant positive correlation was also observed in leaf blade colour and petiole colour (r = 0.48, P < 0.01). Other parameters which showed significant positive correlation included fruit colour and fruit shoulder colour (r = 0.761, P < 0.01), fruit length and fruit width (r = 0.64, P < 0.01), fruit length and fruit yield (r = 0.65, P < 0.01) and between fruit width and fruit yield (r = 0.93, P < 0.01) (online Supplementary Table S2).
There was a negative correlation observed between stem colour and internode colour (r =−0.34, P < 0.01), stem colour and fruit yield (r = −0.28, P < 0.01); fruit texture had a negative correlation with fruit yield (r = −0.37, P < 0.01); others with negative correlation included leaf blade length and fruit shoulder colour, leaf length and petiole numbers, internode height and fruit texture, fruit width and fruit texture and fruit yield at r = −0.26, −0.27, −0.29, −0.39, P < 0.01, respectively (see online Supplementary Table S2).
Morphological characterization using qualitative traits
Phenotypic diversity for individual qualitative traits revealed a high degree of variation among the studied landraces (see online Supplementary Table S3) using the Shannon–Weaver diversity index to estimate phenotypic diversity of eight qualitative traits studied.
The highest phenotypic diversity index (H ') for traits studied recorded was 0.99 in petiole colour, stem colour and vein colour with a total mean phenotypic diversity index of 7.89. Substantial variation was observed in stem colour and vein colour (see online Supplementary Table S3).
Qualitative morphological parameters showed a close relationship between the 17 landraces. Morphological features used in the delimitation of the accessions were the presence or absence of ridge on the fruit, fruit shape and colour, leaf orientation and general fruit morphology. Fruit morphology is the major qualitative character used in the identification of the selected African tomatoes
Molecular characterization
Raw reads were received from the BRC in FASTQ format (see online Supplementary Fig. S3). A procedure to identify SNPs diversity included pre-processing the sequence data and filtering low-quality bases, mapping reads to the Tomato reference genome and post-processing of the alignment results in order to find the effect of variation.
Pre-, post-processing and alignment
Initially the sequencing quality was scrutinized using FastQC tool. NGSQC toolkit was used to filter the low-quality reads and discard the primer/adapter contaminated reads with default parameters (see online Supplementary Fig. S3) according to Patel and Jain (Reference Patel and Jain2012). After filtering based on the quality score, 90.8 million reads before fruiting, 91.6 million reads at mature green stage, 84.2 million reads at mature breaker and 82.4 million reads mature red were retained and used for further analysis. Short sequencing reads were mapped to the annotated tomato reference genome (S. lycopersicum GCF-000188115.3_SL2.5.0) using TopHat with the default parameters. Properly mapped reads were separated from the unmapped reads using Filter SAM by setting the flag values in SAMtool. Among the 90.8 M reads in before fruiting stage, about 80.89–94.87% reads were properly mapped to the tomato genome. In the 91.6 M reads in mature green stage, 74.9–94.3% mapped to the tomato genome. In mature breaker, 73.64–94.64% of the 84.2 M reads mapped to the tomato genome, while 73.59–94.64% of the 82.4 M mapped to the tomato genome (Pabinger et al., Reference Pabinger, Dander, Fischer, Snajder, Sperk, Efremova, Krabichler, Speicher, Zschocke and Trajanoski2013).
Variant calling
SNP calling and annotation
A total of 115,965 SNPs and 689 multiallelic SNPs were mined from all the 17 African tomato landraces used in this study (Table 3). The annotation was performed based on genomic location and the SNPs and were distributed in exonic and splicing region.
Table 3. Total number of SNPs at mined from all the 17 African tomato landraces
Analysis of differentially expressed genes
A total of 140,909 differentially expressed genes were mined from the 17 landraces used in this study, 4000 genes were differentially expressed in V1005987, 4640 from V1006833, 2787 from V1005872, 7065 from V1005878, 3586 from RV102114, 10,161 from V1007108, 9269 from Tindi 050580, 7125 from RV102112, 7374 from Tindi 050589, 13,028 from V1006838, 11,854 from V1006842, 11,515 from V1006826, 11,033 from V1005874, 8275 from V1030380, 9538 from V1006892, 8513 from V10035028 and 11,146 from V1005875 (see online Supplementary Table S4).
A total of 115,965 SNPs were discovered in the 17 landraces. These SNPS were discovered across all the 12 chromosomes as a result of insertions and deletions (Table 3).
Phylogenetic tree representation of the SNPs showed the 17 clustered according to their geographical locations (Fig. 3 and see online Supplementary Fig. S4). However, some landraces from different geographical regions clustered closely. For instance, V1030380, an oval red landrace from Mauritius, grouped closely with RV102112, an oval pink landrace from Madagascar, and Tindi 050580, a round yellow Kenyan landrace. V1005872, a kidney-shaped red landrace from Morocco, grouped closely to an oblong red Ethiopian V1006833. V1007108, an oblong-shaped red landrace from South Africa, grouped closely to Tindi 050580, a round yellow Kenyan landrace, and V1006838, a round red Ethiopian landrace.
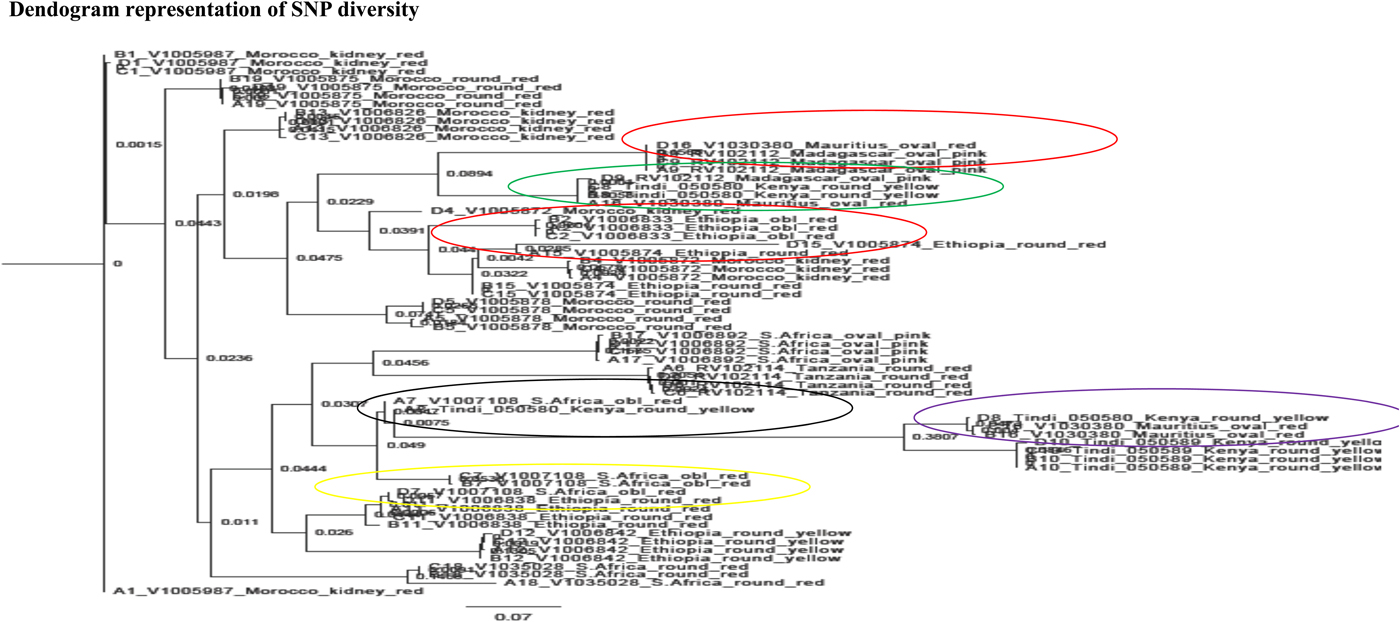
Fig. 3. Phylogenetic tree showing diversity in the 17 landraces as a result of variation in gene expressions at four different fruiting stages.
Discussion
The results of the clustering analysis using the Darwin's 6 software showed that branching occurred at a very low phenon line, which suggests a broad to overall similarities among all landraces; this can be attributed to hybridization and ability of tomato to self-pollinate (Lawal et al., Reference Lawal, Grierson and Afolayan2015).
In this study, the first seven principal components (PC1, PC 2, PC3, PC4, PC5, PC6 and PC7) analysed covered 68.51% variation within the 14 dimensions generated (see online Supplementary Table S1). According to Chatfield and Collins (Reference Chatfield and Collins1980), components with an eigenvalue of <1 should be eliminated so that fewer components be dealt with; moreover, eigenvalues >1 are considered significant.
Strong positive correlations were observed in this study using the simple correlation matrix (see online Supplementary Table S2); similar results were obtained by previous findings of Kisua et al. (Reference Kisua, Mwikamba, Makobe and Muigai2015). Strong positive correlation on yield, leaf width and plant diameter would contribute to the quantity of food synthesized by the plant during photosynthesis, the plant width could serve well in H2O and translocated food from aerial part of the plant. This finding was in agreement with the findings of Shafiei (Reference Shafiei2015) that parameters with strong positive correlation could be used in a breeding programme.
The significant positive correlation between fruit width and fruit yield (r = 0.93, P < 0.01) can be used in selection of more promising genotypes; similar results were obtained by Santos et al. (Reference Santos, Alexandre, Marta, Almy and Daniele2017) who observed that this correlation can be used to recognize the heaviest fruit in the field using simpler instruments which can be of great importance since it benefits works aimed at genotype selection.
As expected, there was a negative correlation between plant height and plant yield (r = −0.003, P < 0.01), which according to Santos et al. (Reference Santos, Alexandre, Marta, Almy and Daniele2017) may indicate an effect of competition among fruits for photo assimilates and hence a dilution effect brought about by the increased or reduced yield (see online Supplementary Table S2).
The existence of high variability as shown by diversity values recorded in online Supplementary Table S3 indicates that the diversity among the landraces is due to variation in qualitative traits. Overall, a high value of (H') represents a diverse and equally distributed classes for an individual trait. On the contrary, a lower value that indicates less diversity since Shannon–Weaver diversity index accounts for abundance and evenness of a population present in a community according to Hirakawa et al. (Reference Hirakawa, Shirasawa, Ohyama, Fukuoka, Aoki, Rothan, Sato, Isobe and Tabata2013).
The number of SNPs tabulated in Table 3 shows a Ti/Tv ratio ranging from 1.4 to 1.57. Previously, Ni et al. (Reference Ni, Hall, Battenhouse and Iyer2012), Wencai et al. (Reference Wencai, Xiaodong, Eileen, Christina, Sophien, Esther van der and David2004) and Sathya et al. (Reference Sathya, Akila and Gopal2015) proclaimed that Ti/Tv ratio for a random variation resulting from systematic errors in the sequencing technology, alignment artefacts and data processing failures should be close to 0.5. In this study, transition to transversion ratio ranged from 1.40 to 1.57, a difference of 0.17 (Table 3). The SNPs were mined across all the 12 chromosomes at varying numbers. Giovannoni, (Reference Giovannoni2007) also observed similar results from his work on tomato fruit ripening with variation occurring in all the 12 chromosomes and that these variations were caused by either deletions or insertions.
SNPs diversity was mainly contributed by geographical locations unlike the morphological characterization which grouped the landraces according to fruit shape, colour and size. SNPs diversity also revealed population admixture among specific landraces from Kenya, South Africa, Ethiopia, Morocco and Madagascar (Fig. 3 and see online Supplementary Fig. S4). This is in agreement with what Wu et al. (Reference Wu, Yu, Wang, Li and Xu2015) and Hamilton et al. (Reference Hamilton, Sim, Stoffel, Van, Buell and Francis2012) found out that environmental variables can have an impact on the movement of gametes and individuals among natural populations, hence affecting gene flow patterns. This may also lead to spatial and progressive dispersal of genetic variation and evolutionary advancement of regular populations. In conclusion, morphological description is important in initial characterization of African tomato landraces with similar phenotypes, i.e. Tindi 050589 and Tindi 050590 grouped together using morphological traits.
There was a significant variation among African tomato contributed by vegetative growth stages of the African tomato landrace like plant height, leaf blade length, leaf blade width and fruit width. Substantial variation among the 17 African tomato landraces was observed in the reproductive stages of the African tomato landraces, i.e. fruit colour, fruit shape, fruit texture, leaf base and leaf lade colour. However, transcriptome SNP analysis revealed significant variation among the African tomato according to their geographical location indicating that morphological characterization of African tomato can only lay a foundation but it does not reveal genetic diversity. While transcriptome analysis goes beyond the phenotypic traits and showed which of the landraces from different geographical locations had been mixed.
It was found out that environmental variables can have an impact on gene flow patterns, which may influence spatial and progressive dispersal of genetic variation and evolutionary advancement of regular populations. This study represents an important step forward in genomics, genetics and for the breeding of cultivated tomato.
Recommendations
Next generation sequence should be used to fully characterize and unveil the responsible genes for the unique traits in the African tomato landraces for breeding purposes.
Acknowledgement
The support for this research work was provided by U.S. Agency for International Development through the Partnerships for Enhanced Engagement in Research (PEER) program Sub-Grant Number: PGA-2000003426 to Prof. Willis Owino and Prof. James Giovannoni. We also acknowledge the support from National Commission for Science Technology and Innovation (NACOSTI). The authors would like to thank Dr. Tsvetelina Stoilova of AVRDC- World Vegetable Center in Arusha, Tanzania for the provision of a number of the tomato accessions. We also thank the Boyce Thomson Institute for Plant Research (BTI), Cornell University, USA for hosting GWM during her research study visit and technical assistance in the current study.
Supplementary material
The supplementary material for this article can be found at https://doi.org/10.1017/S1479262117000314


