


Introduction
The starchy root of cassava (Manihot esculenta Crantz) feeds over 500 million of the world's poorest people. This crop is the primary source of carbohydrates in sub-Saharan Africa, and it is a major food and industrial crop in Latin America and south-east Asia (FAO, 2001). Cassava shows a remarkable degree of phenotypic variability and a wide range of adaptability to agriculturally marginal environments. It is routinely cultivated in conditions ranging from the humid tropics of the Amazon basin to arid regions such as the north-east of Brazil and northern West Africa; it also tolerates a wide range of altitudes, soil fertility and pH.
Understanding the genetic diversity present in cassava is the first step in harnessing its phenotypic variability for crop improvement efforts. The Generation Challenge Programme (GCP; www.generationcp.org), of the Consultative Group on International Agricultural Research, seeks to use advances in molecular biology to harness natural crop genetic variation for the creation of a new generation of hardy crops for small farmers. By examining genetic diversity in a large sample of cassava germplasm, the GCP proposes to identify a subset of germplasm to be used in breeding programs and in association mapping.
The largest cassava germplasm collections are held at two international agriculture research centres, namely the International Center for Tropical Agriculture (CIAT, Colombia), which holds over 5500 accessions from 23 countries worldwide; and the International Institute for Tropical Agriculture (IITA, Nigeria), which holds >2000 African cassava accessions.
Several genetic marker systems have been used for the assessment of genetic diversity of cassava germplasm. They include allozymes (Ocampo et al., Reference Ocampo, Hershey, Iglesias, Iwanaga, Roca and Thro1992), random amplified polymorphic DNA (RAPDs Bonierbale et al., Reference Bonierbale, Maya, Claros and Iglesias1995), amplified fragment length polymorphisms (AFLPs; Second et al., Reference Second, Allem, Emperaire, Ingram, Colombo, Mendes and Carvalho1997), simple sequence repeats (SSRs; Chavarriaga-Aguirre et al., Reference Chavarriaga-Aguirre, Maya, Bonierbale, Kresovich, Fregene, Tohme and Kochert1998; Fregene et al., Reference Fregene, Suarez, Mkumbira, Kulembeka, Ndedya, Kulaya, Mitchel, Gullberg, Rosling, Dixon and Kresovich2003) and diversity array technology (DArT; Xia et al., Reference Xia, Peng, Yang, Wenzl, De Vicente, Fregene and Killian2005). These molecular markers typically show a trade-off between the number of loci that can be efficiently sampled and the amount of information provided per locus.
At one end of the spectrum, SSR genotyping is a fairly low-throughput and lab-intensive approach. This constrains the number of SSR loci that can realistically be used in genotyping a large germplasm collection. On the other hand, SSRs often show high levels of allelic diversity per locus, and as co-dominant markers they can be used to infer genotype information. At the other end of the spectrum, DArT is a new genotyping method that offers the highest throughput genotyping available to date. DArT uses a microarray platform to score hundreds of polymorphic markers across the genome in a single assay ( Jaccoud et al., Reference Jaccoud, Peng, Feinstein and Kilian2001; Wenzl et al., Reference Wenzl, Carling, Kudrna, Jaccoud, Huttner, Kleinhofs and Kilian2004); however, DArT loci are scored as binary characters and must be treated as dominant markers and this limits the genetic information provided by a given locus.
The first report of DArTs for assessing diversity in cassava (Xia et al., Reference Xia, Peng, Yang, Wenzl, De Vicente, Fregene and Killian2005) has opened up the possibility of applying this technology for large-scale germplasm characterization in this crop. However, the potential benefits of this newest high-throughput marker system can extend only as far as its ability to accurately detect patterns of genetic diversity and differentiation in the samples analysed. In this study, we compared the ability of DArTs and SSRs to reveal genetic differentiation in a sample of global cassava genetic resources. A previous genetic analysis, using a large number of SSR markers (67 loci) in a group of 283 cassava accessions, revealed genetic differentiation between African and Neo-tropical accessions, with identifiable structure within each of these groups (Fregene et al., Reference Fregene, Suarez, Mkumbira, Kulembeka, Ndedya, Kulaya, Mitchel, Gullberg, Rosling, Dixon and Kresovich2003). Genetic differentiation between African and Latin American landraces has also been detected using AFLPs (Fregene et al., Reference Fregene, Bernal, Duque, Dixon and Tohme2000). In the present study, we compared the ability of SSRs and DArTs to reveal these previously detected patterns of genetic differentiation in a larger sample of accessions.
Materials and methods
Plant materials
A random set of 436 accessions from over 3000 genotypes maintained at CIAT and IITA was selected for this study. These accessions represent the diversity of agronomic traits present in the crop (Table 1), and include 155 from the IITA collection and 281 from CIAT's cassava germplasm bank. The former are composed principally of west African landraces and elite IITA varieties, while the latter comprise a wide diversity of south and central American landraces (Supplementary Table 1, available online only at http://journals.cambridge.org).
Table 1 Description of selection criteria for assembly of 3000 cassava accessions included in Generation Challenge Programme

Molecular marker analysis
Leaf tissue was collected for DNA extraction from tissue culture plantlets or plants maintained in the screen house or field. Fresh leaves were crushed in extraction buffer or dried at 50°C for 48 h before grinding with sand. In both cases, DNA extractions were carried out using the Dellaporta et al. (Reference Dellaporta, Woods and Hicks1983) extraction method. DNA extraction and determination of quantity and quality of DNA samples were carried out at CIAT, where SSR analyses were also conducted. DNA aliquots were sent to the Center for the Application of Molecular Biology to Agriculture (CAMBIA), Canberra, Australia, for DArT analysis.
More than 800 SSR markers are available for cassava (Mba et al., Reference Mba, Stephenson, Edwards, Melzer, Mkumbira, Gullberg, Apel, Gale, Tohme and Fregene2001; Fregene et al., Reference Fregene, Angel, Gómez, Rodríguez, Bonierbale, Iglesias, Tohme and Roca1997; Fregene et al., 2002 unpublished data) and 200 have been placed on a genetic map of cassava (Okogbenin et al., Reference Okogbenin, Marin and Fregene2006). A subset of 36 markers, 2 from each of the 18 haploid chromosomes of cassava, was selected for assessing genetic diversity. All 36 loci have previously been used in analysis of cassava diversity and show high polymorphism information content (PIC; CIAT, 2002, 2003, 2004).
PCR assays of SSR markers used 30 ng of genomic DNA in 15 μl reactions containing 0.1 mM dNTP, 1 × PCR buffer, 2.5 mM MgCl2, 0.2 μM each primer (Supplementary Table 1, available online only at http://journals.cambridge.org) and 1 U Taq DNA polymerase. PCR amplification was performed using following thermal profile: 2 min at 95°C, 30 cycles of 30 s at 94°C, 55/45°C at 1 min and 60 s at 72°C and a final step of 5 min at 72°C. PCR products were denatured and electrophoresed on 4% polyacrylamide gels and visualized by silver staining. The raw SSR data were scored as allele sizes and allele numbers and used for statistical analysis. A strictly bi-allelic model of inheritance was assumed; SSR markers showing three or more alleles were eliminated.
DArT markers were obtained from a cassava DArT array of approximately 1000 polymorphic clones constructed at CAMBIA (Xia et al., Reference Xia, Peng, Yang, Wenzl, De Vicente, Fregene and Killian2005). This DArT chip was developed using cassava accessions, a wild progenitor (M. esculenta ssp. flabellifolia) and three more distantly related wild species (Xia et al., Reference Xia, Peng, Yang, Wenzl, De Vicente, Fregene and Killian2005). About 100 ng of total genomic DNA from the 436 accessions was labelled with Fluorescent Cy3-dUTP or Cy5-dUTP (Pharmacia, USA) and used to probe the DArT arrays according to standard methods (Jaccoud et al., Reference Jaccoud, Peng, Feinstein and Kilian2001). Slides were scanned using the Affymetrix 418 Scanner adjusting the PMT voltage as required.
Spot signal intensities were analysed by Scanalyse v. 2.44 (Stanford University) as well as GenPix Pro v. 3 (Axon Instruments) and GMS Pathways (Affymetrix v. Beta). Outputs of image analysis programs were further analysed using a program, Mathcard v. 8, developed for DArT markers ( Jaccoud et al., Reference Jaccoud, Peng, Feinstein and Kilian2001). To ensure statistical significance, the median of log-transformed signal ratios of three replicates on each slide was used for comparison. A matrix with binary scores for accessions analysed (66.5–94.8% data/genotype) at polymorphic spots was used as the input file for genetic diversity analysis.
Statistical analysis
The PIC for each marker in both marker systems (SSR and DArT) was determined using Botstein et al.'s (Reference Botstein, White, Skolnick and Davis1980) formula, in which
where p i is the frequency of the ith allele and n is the number of alleles.
Similarity matrices generated from SSR and DArT data employing Jaccard's similarity index were used as input files for principal coordinate analysis (PCoA). Coordinates of each point in a Cartesian space were used as input file in a UPGMA cluster analysis based on Euclidian distances in NTSYS v. 2.1 (Rohlf, Reference Rohlf1998). To define the number of clusters, a cophenetic correlation and the incremental contribution of each new subdivision were used. Once the clusters were identified, average similarities among and between the clusters were calculated.
Results
For the SSRs, all 36 loci were polymorphic among the 436 accessions; a total of 200 alleles were obtained. Between 3 and 12 alleles per locus were observed (average of six alleles per locus). A total of DArT 251 loci (~25%) were polymorphic. The PIC of each marker is shown in Figs 1 and 2. The average PIC for the SSRs was 0.63 with a standard deviation of 0.16; the lowest value was observed for SSRY38 (0.2) and the highest for SSRY182 (0.85). Among the DArT markers, the average PIC value was 0.33 (standard deviation = 0.05, range = 0.09–0.37). Thus, SSRs were expected to more effectively detect genetic differentiation than DArT.

Fig. 1 Polymorphic information content (PIC) calculated for each of the 36 simple sequence repeat markers included in the study. The horizontal line indicates the PIC average in this marker set (0.63).
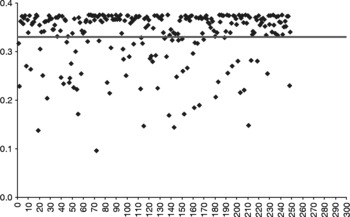
Fig. 2 Polymorphic information content (PIC) calculated for each of the 251 diversity array technology markers included in the study. The horizontal line indicates the PIC average in this marker set (0.33).
Genetic differentiation by continent
Previous genetic analyses, using AFLPs and SSRs, have indicated differentiation between African and Latin American cassava accessions (Fregene et al., Reference Fregene, Bernal, Duque, Dixon and Tohme2000, Reference Fregene, Suarez, Mkumbira, Kulembeka, Ndedya, Kulaya, Mitchel, Gullberg, Rosling, Dixon and Kresovich2003). PCoAs in the present SSR and DArT datasets indicate that this pattern of genetic differentiation was apparent in the former (Fig. 3A) but not in the latter, where accessions from the two continents are largely intermingled (Fig. 3B). For the DArT dataset, quantification of genetic identities between African and Latin American accessions indicates higher genetic similarity (0.25) and thus low differentiation between these two groups, whereas the similarity value for the SSR dataset is lower (0.23), indicating a more clear differentiation between these two groups (Table 2). In the DArT dataset, the similarity among accessions from the same continent was higher (Table 2) indicating a low genetic differentiation between them.
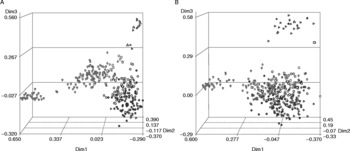
Fig. 3 Principal coordinate analysis of (A) simple sequence repeat and (B) diversity array technology markers representing genetic differentiation between continents. African accessions are represented in grey and Latin American accessions in black. The shapes represent the countries as follow: triangle, Costa Rica and Puerto Rico; flag, Guatemala and Cuba; square, Cape Verde, Gambia and Sierra Leone; diamond, Cameroun; heart, Nigeria; circle, Brazil; club, Ghana, Benin and Togo; cross, Mexico and Panama; start, Colombia; cube, Tanzania; spade, Peru, Ecuador, Venezuela and Argentina.
Table 2 Genetic identities (similarities) between and among African and Latin American accessions in the simple sequence repeat (SSR) and diversity array technology (DArT) datasets

Genetic differentiation within continents
A cophenetic correlation (r 2) was used to define the number of clusters in DArT and SSR datasets. Six DArT and five SSR groups explained 80% of the genetic variance (r 2 = 0.8). The composition of each cluster was assessed based on the origin of the accessions. Both SSRs and DArTs indicate that, among the Latin American accessions, samples from Guatemala are clearly differentiated from other samples from other countries (Fig. 4A,B). Genetic similarity estimates confirm that the Guatemalan accessions show a high degree of similarity to one another (0.67 for SSRs and DArTs) and a low similarity to other groups (Table 3A,B). This same genetic differentiation of Guatemalan accessions was also detected in a previous SSR analysis (Fregene et al., Reference Fregene, Suarez, Mkumbira, Kulembeka, Ndedya, Kulaya, Mitchel, Gullberg, Rosling, Dixon and Kresovich2003). Within the African accessions, a group of primarily Nigerian accessions (labelled B in Fig. 4) was clearly differentiated from the others. A high degree of relatedness obtains within the Nigerian cluster (genetic similarities were 0.78 (SSRs) and 0.75 (DArTs); Table 3A,B). The SSRs, but not the DArTs also revealed a second distinguishable set of primarily Nigerian accessions (group E; Fig. 4; Table 3).
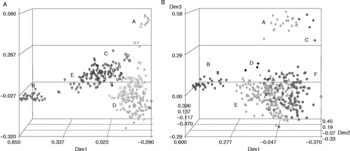
Fig. 4 Principal coordinate analysis of (A) simple sequence repeat and (B) diversity array technology markers showing the groups explaining 80% of the genetic variance in the sample. In (A) and (B), the letters represent the groups and shape, the countries. In (A), the letters represent the groups [A, group A (80% from Guatemala); B, group B (100% from Nigeria); C, group C (37% from Cameroun); D, group D (86% from Brazil); E, group E (86% from Nigeria)] and the shapes correspond to country of origin (triangle, Costa Rica and Puerto Rico; flag, Guatemala and Cuba; square, Cape Verde, Gambia and Sierra Leone; diamond, Cameroun; heart, Nigeria; circle, Brazil; club, Ghana, Benin and Togo; cross, Mexico and Panama; start, Colombia; cube, Tanzania; spade, Peru, Ecuador, Venezuela and Argentina). In (B), the letters and shapes represent the groups [(A) diamond, group A (80% from Guatemala); (B) heart, group B (93% from Nigeria); (C) start, group C (40% from Guatemala); (D) cross, group D (100% from Nigeria); (E) club, group E (23% from Brazil); (F) ball, group F (12% from Ghana)].
Table 3 Similarity within and between the groups defined by principal coordinate analysis of (A) simple sequence repeat and (B) diversity array technology markers

Discussion
Genetic resolution of DArTs and SSRs
Our analysis of 251 polymorphic DArTs in comparison with 36 SSRs indicates that the SSRs are more effective at revealing the patterns of genetic differentiation. The SSRs more clearly recover the population structure inferred in earlier genetic analyses (Fregene et al., Reference Fregene, Bernal, Duque, Dixon and Tohme2000, Reference Fregene, Suarez, Mkumbira, Kulembeka, Ndedya, Kulaya, Mitchel, Gullberg, Rosling, Dixon and Kresovich2003), including differentiation between African and Latin American cassava accessions (Fig. 3A), as well as differentiation of Guatemalan accessions from other Latin American and differentiation of some Nigerian accessions from other African samples (Fig. 4A). In addition, the SSR analyses suggest that there may be additional differentiation among the African accessions (e.g. group E in Fig. 4A) that is not identified in the DArT analysis.
Taken at face value, these results suggest that there is a greater pay-off in using a low number of SSRs than a large number of DArTs. At least one caveat should be considered, however. Our primary criterion for ‘correct’ detection of genetic differentiation is whether or not the cluster analyses recover patterns of differentiation observed in earlier genetic analyses. Thirty of the 36 SSR loci in the present study were used in the analysis by Fregene et al., Reference Fregene, Bernal, Duque, Dixon and Tohme2000. Thus, if there were some inherent bias in the type of polymorphism information revealed by these SSRs, we may have biased ourselves in favour of detecting the same patterns with the present SSR analysis. It is conceivable that lower genetic differentiation revealed by the DArT analysis (Fig. 3B) is actually a more accurate representation of genetic relationships in the sample set. Nonetheless, the fact that the African–Latin American differentiation is detectable with both SSRs (Fregene et al., Reference Fregene, Suarez, Mkumbira, Kulembeka, Ndedya, Kulaya, Mitchel, Gullberg, Rosling, Dixon and Kresovich2003) and AFLPs (Fregene et al., Reference Fregene, Bernal, Duque, Dixon and Tohme2000) strongly suggests that the patterns of differentiation observed in the present SSR analyses are real.
Although the DArT analysis included 1000 loci, only about one-quarter were polymorphic. This likely reflects the selection of taxa used in designing the cassava DArT array. The chip was designed to reflect diversity present not only in cassava but also its wild ancestor (M. esculenta ssp. flabellifolia) and three Manihot species that are distantly related to the crop. Cassava's wild relatives contain much greater genetic diversity than the crop (e.g. Roa et al., Reference Roa, Maya, Duque, Tohme, Allem and Bonierbale1997; Olsen and Schaal, Reference Olsen and Schaal1999; Olsen, Reference Olsen2004). Designing a DArT array solely from cassava germplasm would be likely to yield an array with more power to detect genetic variation within the crop.
Because loci assessed by DArT markers can be significantly increased beyond the number employed here with minimal additional costs, it may well be possible that the level of genetic resolution obtained with DArTs could be fairly easily made comparable to that of SSRs. More conclusive evidence will have to await analysis using denser DArT arrays and a larger sample set. While the initial investment for development of both marker systems (labour and consumables) is approximately similar, the cost per assay is far less for DArTs than SSRs, making DArTs an attractive marker alternative. This will be especially true for ‘orphan crop’ species, where existing marker systems have not yet been developed.


