


INTRODUCTION
Since the last century, archaeological excavations around the Nihewan Basin and Zhoukoudian sites have been investigating the small-flake-tool Paleolithic cultural tradition in North China, which is also known as the “Zhoukoudian Locality 1-Shiyu sequence” or “Donggutuo-Shiyu sequence” (Jia et al., Reference Jia, Gai and You1972; Liu et al., Reference Liu, Hu and Wei2013). Stone artifacts in China have long been regarded as simple and primitive (Gao and Norton, Reference Gao and Norton2002). As indicated by the appearance of microlithic technology (Gao, Reference Gao1999; Nian et al., Reference Nian, Gao, Xie, Mei and Zhou2014; Kato, Reference Kato2015; Wang, Reference Wang2017; Li and Gao, Reference Li and Gao2018), these artifacts did not show obvious changes until ca. 30–35 ka. The late Pleistocene in North China witnessed a transformation from the traditional small-flake-tool industry to the microblade industry. With regard to the origin and evolution of modern humans, the origin and emergence of microblade techniques has long been a controversial topic of archaeological research (Jia, Reference Jia1978; Nian et al., Reference Nian, Gao, Xie, Mei and Zhou2014; Yi et al., Reference Yi, Gao, Li and Chen2016; Song et al., Reference Song, Cohen, Shi, Wu, Kvavadze, Goldberg, Zhang, Zhang and Bar-Yosef2017; Wang, Reference Wang2018, Reference Wang2019; Guan et al., Reference Guan, Wang, Wang, Olsen, Pei, Zhou and Gao2020; Sun et al., Reference Sun, Wen, Lu, Zhou, Curnoe, Lu and Li2021). The focus of contention is whether microblade techniques came from the north, such as Siberia and Altai, or from a local source. Therefore, the relationship between the small-flake-tool and microblade industries is worthy of discussion. Recent site excavations and studies suggest that the small-flake-tool industry had a certain degree of advancement, which may support the local emergence of microlithic technology, or at least technological interaction and diffusion at the beginning of the late Pleistocene in North China (Du, Reference Du2003; Liu et al., Reference Liu, Hu and Wei2013; Li et al., Reference Li, Chen, Wang and Gao2016; Wang, Reference Wang2019), supporting the opinion that microlithic technology may have developed from traditional Paleolithic industries in China. However, this assumption is partly contested because of insufficient evidence resulting from few study materials and poor dating.
The Nihewan Basin has a long development history of the small-flake-tool industry and sufficient materials for microlith studies, thus it is an important region for investigating the relationship between the small-flake-tool and microblade industries. The Nihewan Basin is located on the northeastern margin of the Loess Plateau at the junction of the North China Plain and the Inner Mongolia Plateau, which is an important area for research on the development of Paleolithic culture and living environments of hominins in China and East Asia (Schick et al., Reference Schick, Toth, Wei, Clark and Etler1991; Li and Ma, Reference Li and Ma2014; Nian et al., Reference Nian, Gao, Xie, Mei and Zhou2014; Guo et al., Reference Guo, Li, Zhang and Roberts2015, Reference Guo, Li, Zhang, Yuan, Xie and Roberts2016, Reference Guo, Li, Zhang, Yuan, Xie and Roberts2017; Li et al., Reference Li, Zhang, Ding, Xu, Wang, Chi, Dong and Zhang2019; Yang et al., Reference Yang, Deng, Zhu and Petraglia2019). Many archeological excavations have been conducted since the 1920s, and most Paleolithic sites are buried in fluvial-lacustrine sediments and overlying aeolian (Malan) loess or river-bank deposition on the Sangganhe River terraces (Liu et al., Reference Liu, Hu and Wei2013; Yang et al., Reference Yang, Deng, Zhu and Petraglia2019). Studies show that fluvial-lacustrine sediments were deposited during the early Pleistocene and ended at the beginning of the late Pleistocene. The overlying sediments were deposited from S1 to L1 (Marine Isotope Stage [MIS] 5–2) of the Chinese loess-paleosol sequence (Wei et al., Reference Wei, Li, Pei, Yuan, Xia and Niu2011; Deng et al., Reference Deng, Hao, Guo and Zhu2019). Previous studies determined the numerical ages of several important sites through stratigraphic correlation and various types of dating methods (Chen et al., Reference Chen, Yuan, Gao, Wang and Zhao1982, Reference Chen, Yuan and Gao1984; Yuan., Reference Yuan1993; Zhu et al., Reference Zhu, An, Potts and Hoffman2003, Reference Zhu, Deng and Pan2007; Deng et al., Reference Deng, Wei, Zhu, Wang, Zhang, Ao, Chang and Pan2006; Wang, Reference Wang2007; Liu et al., Reference Liu, Deng, Li and Zhu2010, Reference Liu, Murray, Buylaert, Jain, Chen and Lu2016; Ao et al., Reference Ao, An, Dekkers, Wei, Pei, Zhao and Zhao2012; Nian et al., Reference Nian, Gao, Xie, Mei and Zhou2014; Guo et al., Reference Guo, Li, Zhang and Roberts2015, Reference Guo, Li, Zhang, Yuan, Xie and Roberts2016, Reference Guo, Li, Zhang, Yuan, Xie and Roberts2017, Reference Guo, Li and Zhao2020; Lin et al., Reference Lin, Ao, Cheng, Wei, Zhang, Shu and Li2018; Guan et al., Reference Guan, Wang, Wang, Olsen, Pei, Zhou and Gao2020; Rui et al., Reference Rui, Li, Guo, Zhang, Yuan and Xie2019). However, many sites still need to be dated, especially those with ages ranging from 140–30 ka, which is a transition period before the emergence of microliths. Therefore, using suitable methods to obtain a valid chronology is the basis for understanding the development of the Paleolithic industry in the Nihewan Basin.
Luminescence dating methods are widely used in archaeological research (Sun et al., Reference Sun, Mercier, Falgueres, Bahain, Despriee, Bayle and Lu2010, Reference Sun, Lu, Wang and Yi2012, Reference Sun, Lu, Wang, Yi, Shen and Zhang2013; Lu et al., Reference Lu, Sun, Wang, Cosgrove, Zhang, Yi, Ma, Wei and Yang2011; Nian et al., Reference Nian, Gao, Xie, Mei and Zhou2014; Roberts et al., Reference Roberts, Jacobs, Li, Jankowski, Cunningham and Rosenfeld2015; Guo et al., Reference Guo, Li, Zhang, Yuan, Xie and Roberts2017; Jacobs et al., Reference Jacobs, Li, Farr, Hill, Hunt, Jones and Rabett2017; Hu et al., Reference Hu, Marwick, Zhang, Rui, Hou, Yue, Chen, Huang and Li2019; Zhang et al., Reference Zhang, Li, Han, Wang and Zhou2019). The development of thermally transferred (TT) optically stimulated luminescence (OSL) and post-infrared infrared-stimulated luminescence (pIRIR) dating methods effectively extends the upper limit of luminescence to 200–300 ka in practical applications (Buylaert et al., Reference Buylaert, Jain, Murray, Thomsen, Thiel and Sohbati2012; Sun et al., Reference Sun, Yi, Lu and Zhang2017), thereby permitting the dating of Middle Paleolithic sites between 140–30 ka. Luminescence dating and other dating methods have been applied in the Nihewan Basin. The luminescence dating of young samples from different sites, such as Youfang (YF; Nian et al., Reference Nian, Gao, Xie, Mei and Zhou2014), Xibaimaying (Guo et al., Reference Guo, Li, Zhang, Yuan, Xie and Roberts2017), and Yujiagou (Rui et al., Reference Rui, Li, Guo, Zhang, Yuan and Xie2019), is primarily based on single-aliquot regenerative dose (SAR) OSL (SAR-OSL) methods. Recuperated OSL (i.e., TT-OSL) is also applicable to sediments in the Nihewan Basin, but this method is seldom used (Zhao et al., Reference Zhao, Lu, Wang, Chen, Liu and Mao2010; Liu et al., Reference Liu, Wu, Deng, Tong, Qin, Li, Yuan and Zhu2016). The pIRIR protocol was first used to date ancient Nihewan lacustrine sediments (Nian et al., Reference Nian, Zhou and Yuan2013). In recent years, further studies on the pIRIR protocol have been conducted in the Nihewan Basin. This protocol was then applied to date several middle Pleistocene sites (Guo et al., Reference Guo, Li, Zhang and Roberts2015, Reference Guo, Li, Zhang, Yuan, Xie and Roberts2016), such as the Motianling, Queergou, and Banjingzi sites, determining reliable ages of up to ca. 300 ka. Based on previous studies and considering the upper dating limit, we primarily applied the feldspar pIRIR290 method (Buylaert et al., Reference Buylaert, Jain, Murray, Thomsen, Thiel and Sohbati2012; Li and Li, Reference Li and Li2012) on the newly excavated Youfangbei (YFB) sites in the Yangyuan Basin.
STRATIGRAPHIC AND ARCHAEOLOGICAL SETTINGS
The YFB site is located on the slope of the northern edge of the Datianwa Platform, which is ~300 m south of YF Village, Yangyuan County and has an elevation of ~924 m. On the other side, ~190 m south of the YFB site, is the YF microblade site (Xie and Cheng, Reference Xie and Cheng1989). Approximately 1 km southwest of the YFB site is the Donggutuo site (Fig. 1, No.3). Other small-tool sites in the late Pleistocene considered in this study include Xibaimaying, Banjingzi, and Xujiayao, most of which are in the Yangyuan Basin near the YFB site (except for Xujiayao; Fig. 1).

Figure 1. (color online) Location of YFB and other related sites, including those that belong to the small-flake-tool industry and those with two different cultural layers that reflect technological changes. Small-tool sites: 1-YFB, 2-Banjingzi, 3-Donggutuo, 4-Xibaimaying, and 5-Xujiayao, 9-Lingjing; microblade sites with two different cultural layers: 6-YF, 7-Xishahe, 8-Shizitan S29, and 10-Xishi.
Excavation of the YFB site was hosted by the School of History and Culture, Heibei Normal University, in the spring of 2018. Two trenches—the upper (T2) and lower (T1) profiles—were dug from the slope of the southern bank of the Sangganhe River (Fig. 2a). Owing to intensive erosion of lacustrine deposits on the slope that developed in the middle and early Pleistocene, deposition was composed mainly of fluvial sediments, with loess and paleosol that developed in the late Pleistocene (Deng et al., Reference Deng, Zhu, Zhang, Ao and Pan2008; Zhao et al., Reference Zhao, Lu, Wang, Chen, Liu and Mao2010; Nian et al., Reference Nian, Gao, Xie, Mei and Zhou2014; Liu et al., Reference Liu, Wu, Deng, Tong, Qin, Li, Yuan and Zhu2016; Deng et al., Reference Deng, Hao, Guo and Zhu2019). T2, which was excavated from the top of the slope, was 8.6 m thick (Fig. 2b) and contained two geological units (~6.5-m-thick loess-paleosol accumulation, except for the 30-cm topsoil and the lower units that correspond to 3–4 units of T1). Below the topsoil is a ~4.5-m-thick loess layer, followed by a 40-cm-thick gravel layer and then a ~60–100-cm-thick black soil layer. A few artifacts were found in the loess deposits at a depth of ~3.8 m and the lower part of the soil deposits. T1 consisted of 3.6-m-thick river terrace deposits with unearthed stone artifacts and covered an area of 1×3 m2. This trench was divided into six units (labeled 1–6; Fig. 2c). The first and second layers were composed of 60-cm-thick modern soil and ~30-cm-thick loose gray-yellow soil, respectively. The subsequent four units primarily consisted of silty soil that varied in color and contained stone artifacts. The six units formed an unconformity with the underlying bedrock made of red sand and gravel. Below the black soil layer on T2 is >1 m thick loess, following 30-cm-thick gray-black silty soil that has the same characteristics as the third layer of T1. There is an ~20-cm-thick black silty soil at the bottom of T2, which is consistent with the fourth layer of T1 as well. Because the soil has a gray color and a partial unconformity in the bottom of the fourth layer (the sand invasion layer marked by a dash line in T1), the third and fourth layers may have developed in a relatively humid and unstable environment. However, deposition in each layer is uniform and sample collection was conducted in the homogeneous part. The fifth and sixth units were composed of yellow-brownish and red-brownish silty soil, respectively. Their features are consistent with the lithological character of the paleosol at Haojiatai section, which is ~2 km away from YFB site (Zhao et al., Reference Zhao, Lu, Wang, Chen, Liu and Mao2010) and developed at 130–80 ka. Therefore, there was no disconformity between T1 and T2, and they were likely to have developed in the late Pleistocene.
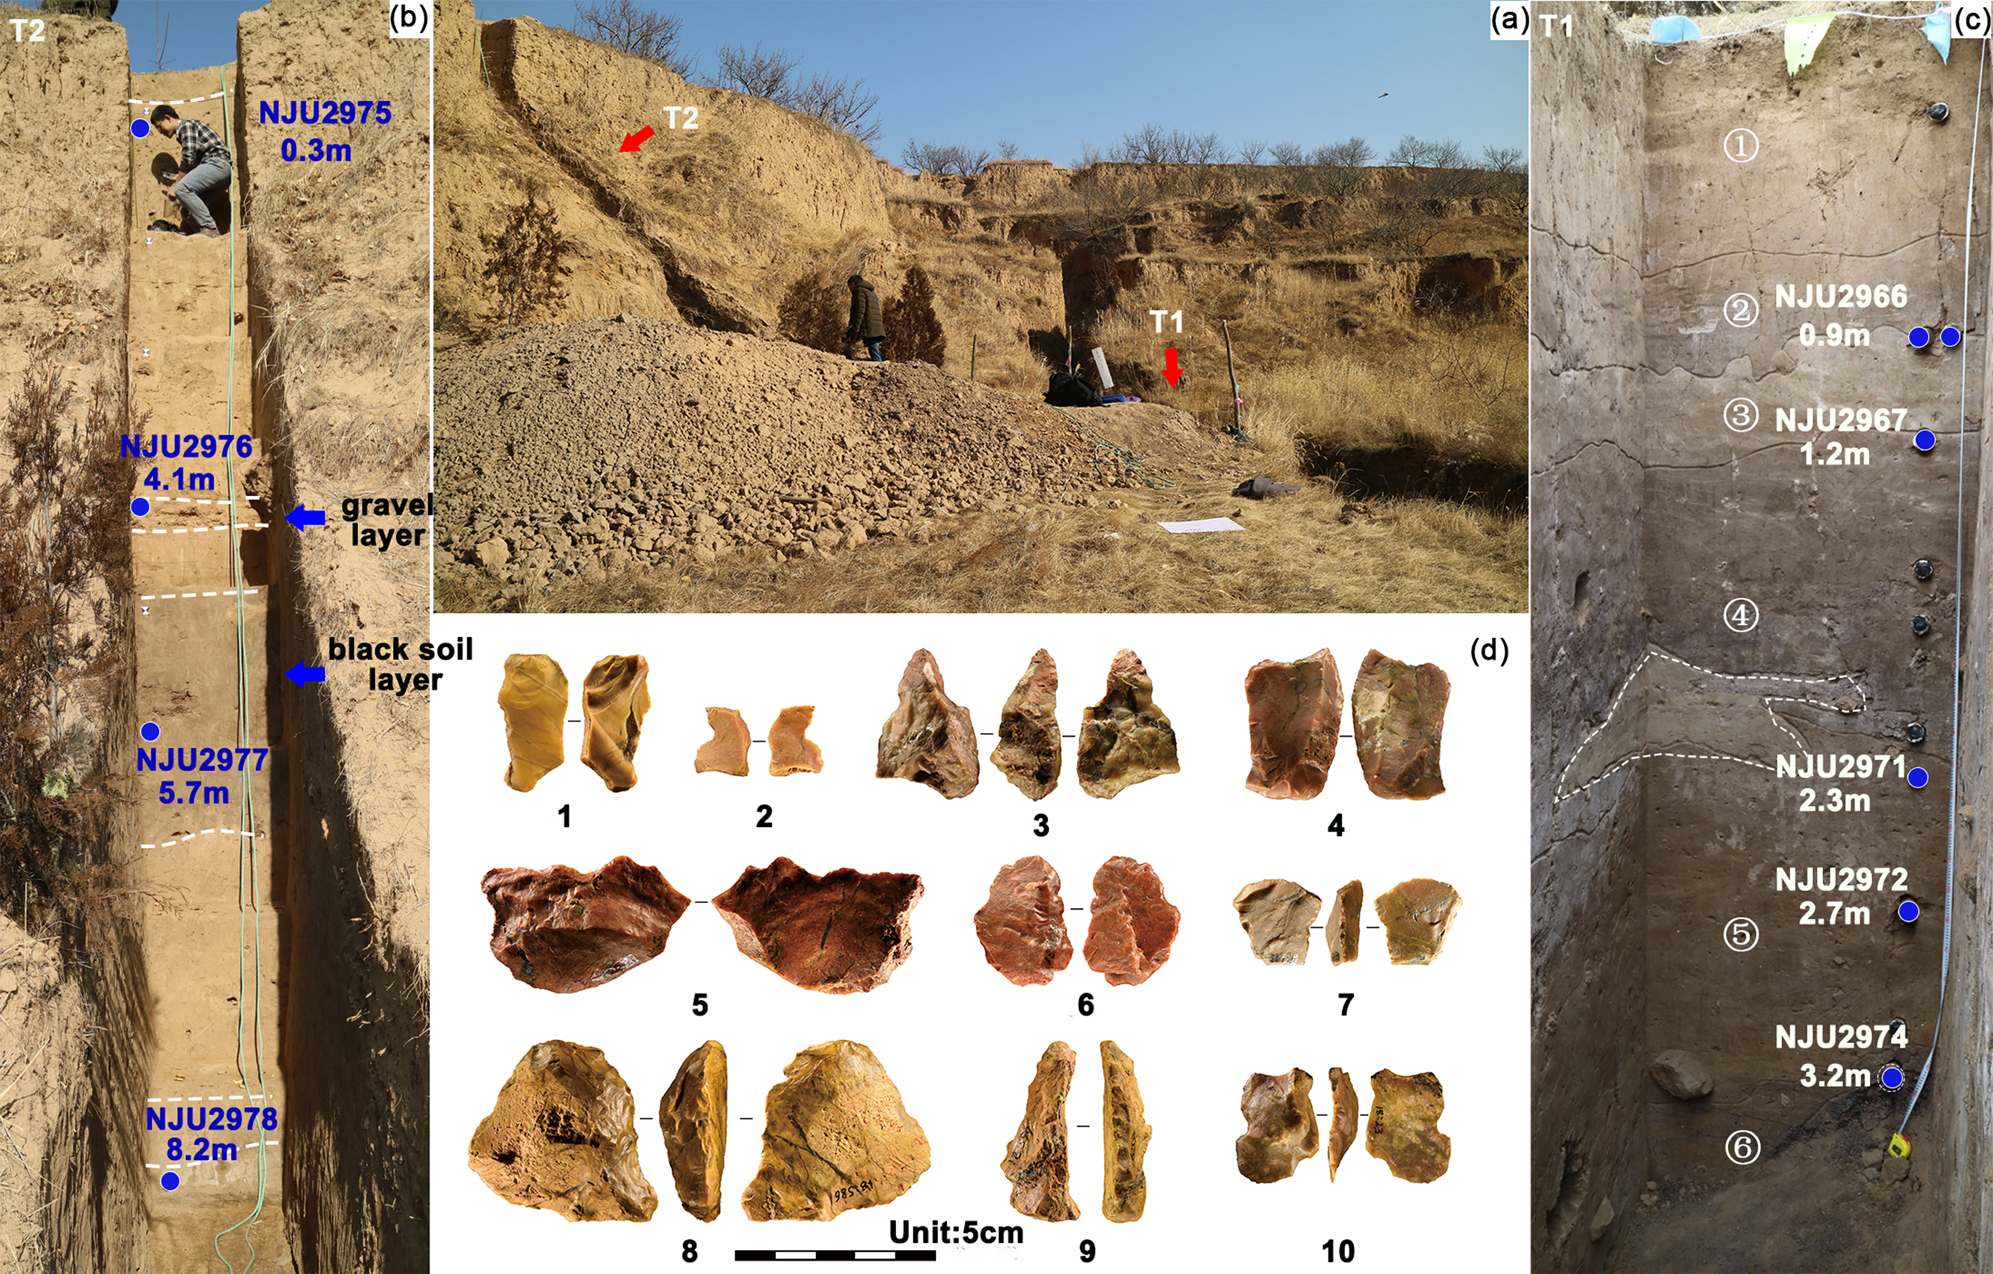
Figure 2. (color online) Stratigraphic analysis of the YFB site, luminescence sampling points, and unearthed stone artifacts: (a) field excavation and locations of the two trenches, stratigraphic analyses of (b) T2 and (c) T1, from which most of the artifacts were excavated; (d) shows typical stone artifacts (1 = flakes; 2, 10 = notch; 3 = drill; 4 = point; 5–9 = scraper).
Stone artifacts (totaling 587) were unearthed below 0.9 m in T1, of which most were retrieved at a depth of 2.3–2.7 m. Forty-eight animal fossil fragments also were unearthed in this profile. The stone artifacts included 38 cores, 101 blades (17.2%), 370 fragments, and 78 tools (13.3%). Among the stone tools, 59% were scrapers and the remaining were classified as notches, flakes, stone drills, and choppers (Fig. 2d). These artifacts were primarily made of flint from the nearby Zhoujiashan Mountain. This study applied direct hammer percussion as the core reduction strategy. Moreover, flake reduction was not standardized. A few cores suggested the conscious selection of high-quality raw materials. The implemented retouch technology was simple. The various small tools and irregular stone cores indicate that the YFB site belongs to the traditional small-tool industry in North China (Liu et al., Reference Liu, Hu and Wei2013; Yang et al., Reference Yang, Deng, Zhu and Petraglia2019; Wang, Reference Wang2019). Furthermore, the different kinds of tools imply that this site might have been a temporary Paleolithic workshop and camping site of hominins.
METHODS
Luminescence samples were collected by inserting a metal tube into a clean loess profile, sealing the tube with tape, and preserving the tube and loess sample in black plastic bags to avoid sunlight exposure and water dispersion. Nine samples were collected and measured. The five samples in the cultural layer below 0.9 m in T1 were labeled as NJU2966, NJU2967, NJU2971, NJU2972, and NJU2974, whereas the four samples in T2 were labeled as NJU2975–NJU2978 (Fig. 2b, c). Among the samples in T2 (Fig. 2b), several stone artifacts were unearthed above the gravel layer and in the black soil layer; NJU2976 was sampled at ~4 m in the first loess layer, and NJU2977 was sampled at ~5.7 m in the black soil layer. Magnetic susceptibility samples (totaling 151) were collected at intervals of 5 and 10 cm from the T1 and T2 profiles, respectively, to analyze the climatic proxy indexes. These samples were prepared for the low-frequency magnetic susceptibility test (470 Hz) after drying at 38°C for 40 hours using a Batington MS2 magnetic meter in the laboratory at Nanjing University.
The samples for De measurements were prepared using standard procedure (Aitken, Reference Aitken1998) under dim red light in the laboratory. The materials at both ends of each tube (~2–3 cm) that might have been exposed to sunlight were removed to measure the environmental dose rate and water content. Grains with sizes of 40–63 and 90–150 μm were selected through wet sieving and subsequently treated with 30% H2O2 and 10% HCl to remove organic matter and carbonates. The 40–63 μm particles for quartz extraction were treated with 10% HCl for 40 min before being immersed in 40% H2SiF6 for 14 days to remove the feldspars. After drying, the purity of the isolated quartz was measured using the OSL IR depletion ratio (Duller, Reference Duller2003). The samples were re-treated until the influence of the infrared-stimulated luminescence (IRSL) signal could be disregarded (i.e., when the OSL IR depletion ratio was <10%). The 90–150 μm particles for the extraction of feldspar were immersed in 10% HF for 10 min to remove the alpha-irradiated outer layer, and subsequently cleaned with 10% HCl for 20 min. The feldspar grains were separated using a heavy-liquid solution with a density of 2.58 g/cm−3. The quartz grains were settled on stainless steel discs as large aliquots (~8 mm diameter), whereas the feldspars were placed on cups as small aliquots (~2 mm diameter).
All luminescence measurements were performed on a Risø TL/OSL reader (model DA-20) with an accurately calibrated 90Sr/90Y beta source at the luminescence laboratory of Nanjing University. Blue light-emitting diodes (LEDs; 470 nm, ~80 mW cm−2) were utilized for quartz stimulation, and IR LEDs (870 nm, ~135 mW cm−2) were used to stimulate the feldspar (Bǿtter-Jensen et al., Reference Bǿtter-Jensen, Thomsen and Jain2010). The quartz OSL signal was detected using a 7.5 mm Schott U-340 (UV) filter, whereas the feldspar pIRIR290 signals were detected using combined Corning 7-59 and Schott BG-39 filters. The standard SAR protocol involving a signal stimulated using blue light at 125°C for 40 seconds with preheating and cut heat temperatures of 260°C and 220°C, respectively, was applied to the quartz (Murray and Wintle, Reference Murray and Wintle2000, Reference Murray and Wintle2003). The dose recovery test at the selected preheat temperature of quartz from NJU2975 was conducted with a given dose of 40 Gy and obtained dose recovery ratio of 1.12 ± 0.12 (n=5), validating this protocol. The pIRIR290 protocol was used to determine the De value of the feldspar (Thiel et al., Reference Thiel, Buylaert, Murray, Terhorst, Hofer, Tsukamoto and Frechen2011; Buylaert et al., Reference Buylaert, Jain, Murray, Thomsen, Thiel and Sohbati2012). This protocol can effectively minimize the effects of anomalous fading by stimulating the pIRIR signal at an elevated temperature of 290°C after a prior low-temperature IR stimulation at 200°C (Thiel et al., Reference Thiel, Buylaert, Murray, Terhorst, Hofer, Tsukamoto and Frechen2011; Buylaert et al., Reference Buylaert, Jain, Murray, Thomsen, Thiel and Sohbati2012; Li and Li, Reference Li and Li2012). The feldspar aliquots from the NJU2975 were given a dose of 644 Gy using the pIRIR200, 290 protocol and obtained a dose recovery ratio of 1.10 ± 0.04 (n=3), which also recovered fully on the selected measurement condition. Afterwards, the dose response curves were fitted using single saturating exponential function provided in the Analyst program, version 4.31.7 (Duller, Reference Duller2015a).
The environmental dose rate can be attributed to the beta and gamma radiation from radionuclide decay and cosmic radiation. The concentrations of uranium (U), thorium (Th), and potassium (K) were determined using inductively coupled plasma mass spectrometry. The internal dose rate of quartz was small, and the concentrations of K and Rb for the calculation of the internal dose rate of feldspar were assumed to be 12 ± 0.5% and 400 ± 100 ppm, respectively (Huntley and Baril, Reference Huntley and Baril1997; Zhao and Li, Reference Zhao and Li2005). Moreover, the small internal dose rates from U and Th were 0.035 ± 0.15% and 0.06 ± 0.03% for quartz and feldspar, respectively, and were included in the calculation (Zhao and Li, Reference Zhao and Li2005; Vandenberghe et al., Reference Vandenberghe, De Corte, Buylaert, Kucera and Van den haute2008). The cosmic dose rate was calculated according to the formula proposed by Prescott and Hutton (Reference Prescott and Hutton1994). The elemental concentrations were converted into the corresponding annual dose rates using the conversion parameters proposed by Guérin et al. (Reference Guérin, Mercier and Adamiec2011).
RESULTS
Luminescence characteristics of quartz and feldspar
To select reliable De values, several rejection criteria from a previous study (Jacobs et al., Reference Jacobs, Wintle and Duller2006), including poorly fitted dose response curves, a natural luminescence signal exceeding 80% of the saturation level (i.e., De > 2D0), a recycling ratio exceeding 0.9–1.1, and a recuperation >5%, were adopted. These criteria are applicable to quartz and feldspar. The results of the quartz samples show that only NJU2975 is unsaturated. Most of the De values were concentrated within the standard deviation between 1.5–1.8 Gy (Fig. 3e). The overdispersion (OD) value of dose distribution, calculated using the Central Age Model (CAM; Galbraith et al., Reference Galbraith, Roberts, Laslett, Yoshida and Olley1999; Galbraith and Roberts, Reference Galbraith and Roberts2012) is 17.69 ± 5.03%, the skewness is −0.17, which is close to normal distribution, and the central age is the same as the mean age. Therefore, the mean value of ~1.6 Gy was used as the final De of the NJU2975. However, the De values of the remaining samples may be underestimated. The minimum De of quartz in the study area was saturated at ~200 Gy based on 2D0 (Wintle and Murray, Reference Wintle and Murray2006; Table 1).
Table 1. U, Th, and K concentrations; dose rates; Des; and ages of the samples obtained through the quartz SAR protocol and feldspar pIRIR290 protocol. “>” means that the signal is saturated, and we can only get the minimum age of that sample; the water content is estimated to be 10% for NJU2975 and NJU2976, 15% for other samples and used to calculate the dose rate and age.

Feldspar had a higher saturation dose than quartz, and the feldspar pIRIR290 protocol demonstrates satisfactory results for older samples. The pIRIR290 protocol with 200°C preheat was suitable for our samples because the doses ranged from 300–400 Gy (Buylaert et al., Reference Buylaert, Vandenberghe, Murray, Huot, Corte and Haute2007; Li and Li, Reference Li and Li2012; Yi et al., Reference Yi, Li, Han, Lu, Liu and Wu2018; and the review of Zhang and Li, Reference Zhang and Li2020; Table 1).The growth curve of the representative NJU2966 sample (Fig. 3a) shows that feldspar has high saturation doses that continuously increase to 600 Gy; these doses were accepted after the 2D0 test. The decay curve in Fig. 3b shows that the decay of the signal was slower than that of quartz, but the intensity and brightness of the former were higher than those of the latter. The recycling ratio and recuperation of the 71 aliquots (n=71) were 0.9–1.08 and 0.2–5.7%, respectively (Fig. 3c, d), suggesting that the samples behave well. One aliquot of NJU2576 obtained a recuperation value of 5.67%, which was extracted from the De calculation. The distribution of De values of all the samples measured by pIRIR290 were concentrated. As is shown in Figure 3f, the De values of the representative sample NJU2971 distributed in the end of the gray bar with an OD of ~11.19% and a small skewness of -0.13. These statistical parameters implied the De distribution was close to normal distribution. Therefore, the average values of the Des were used to represent the final De values for all samples.
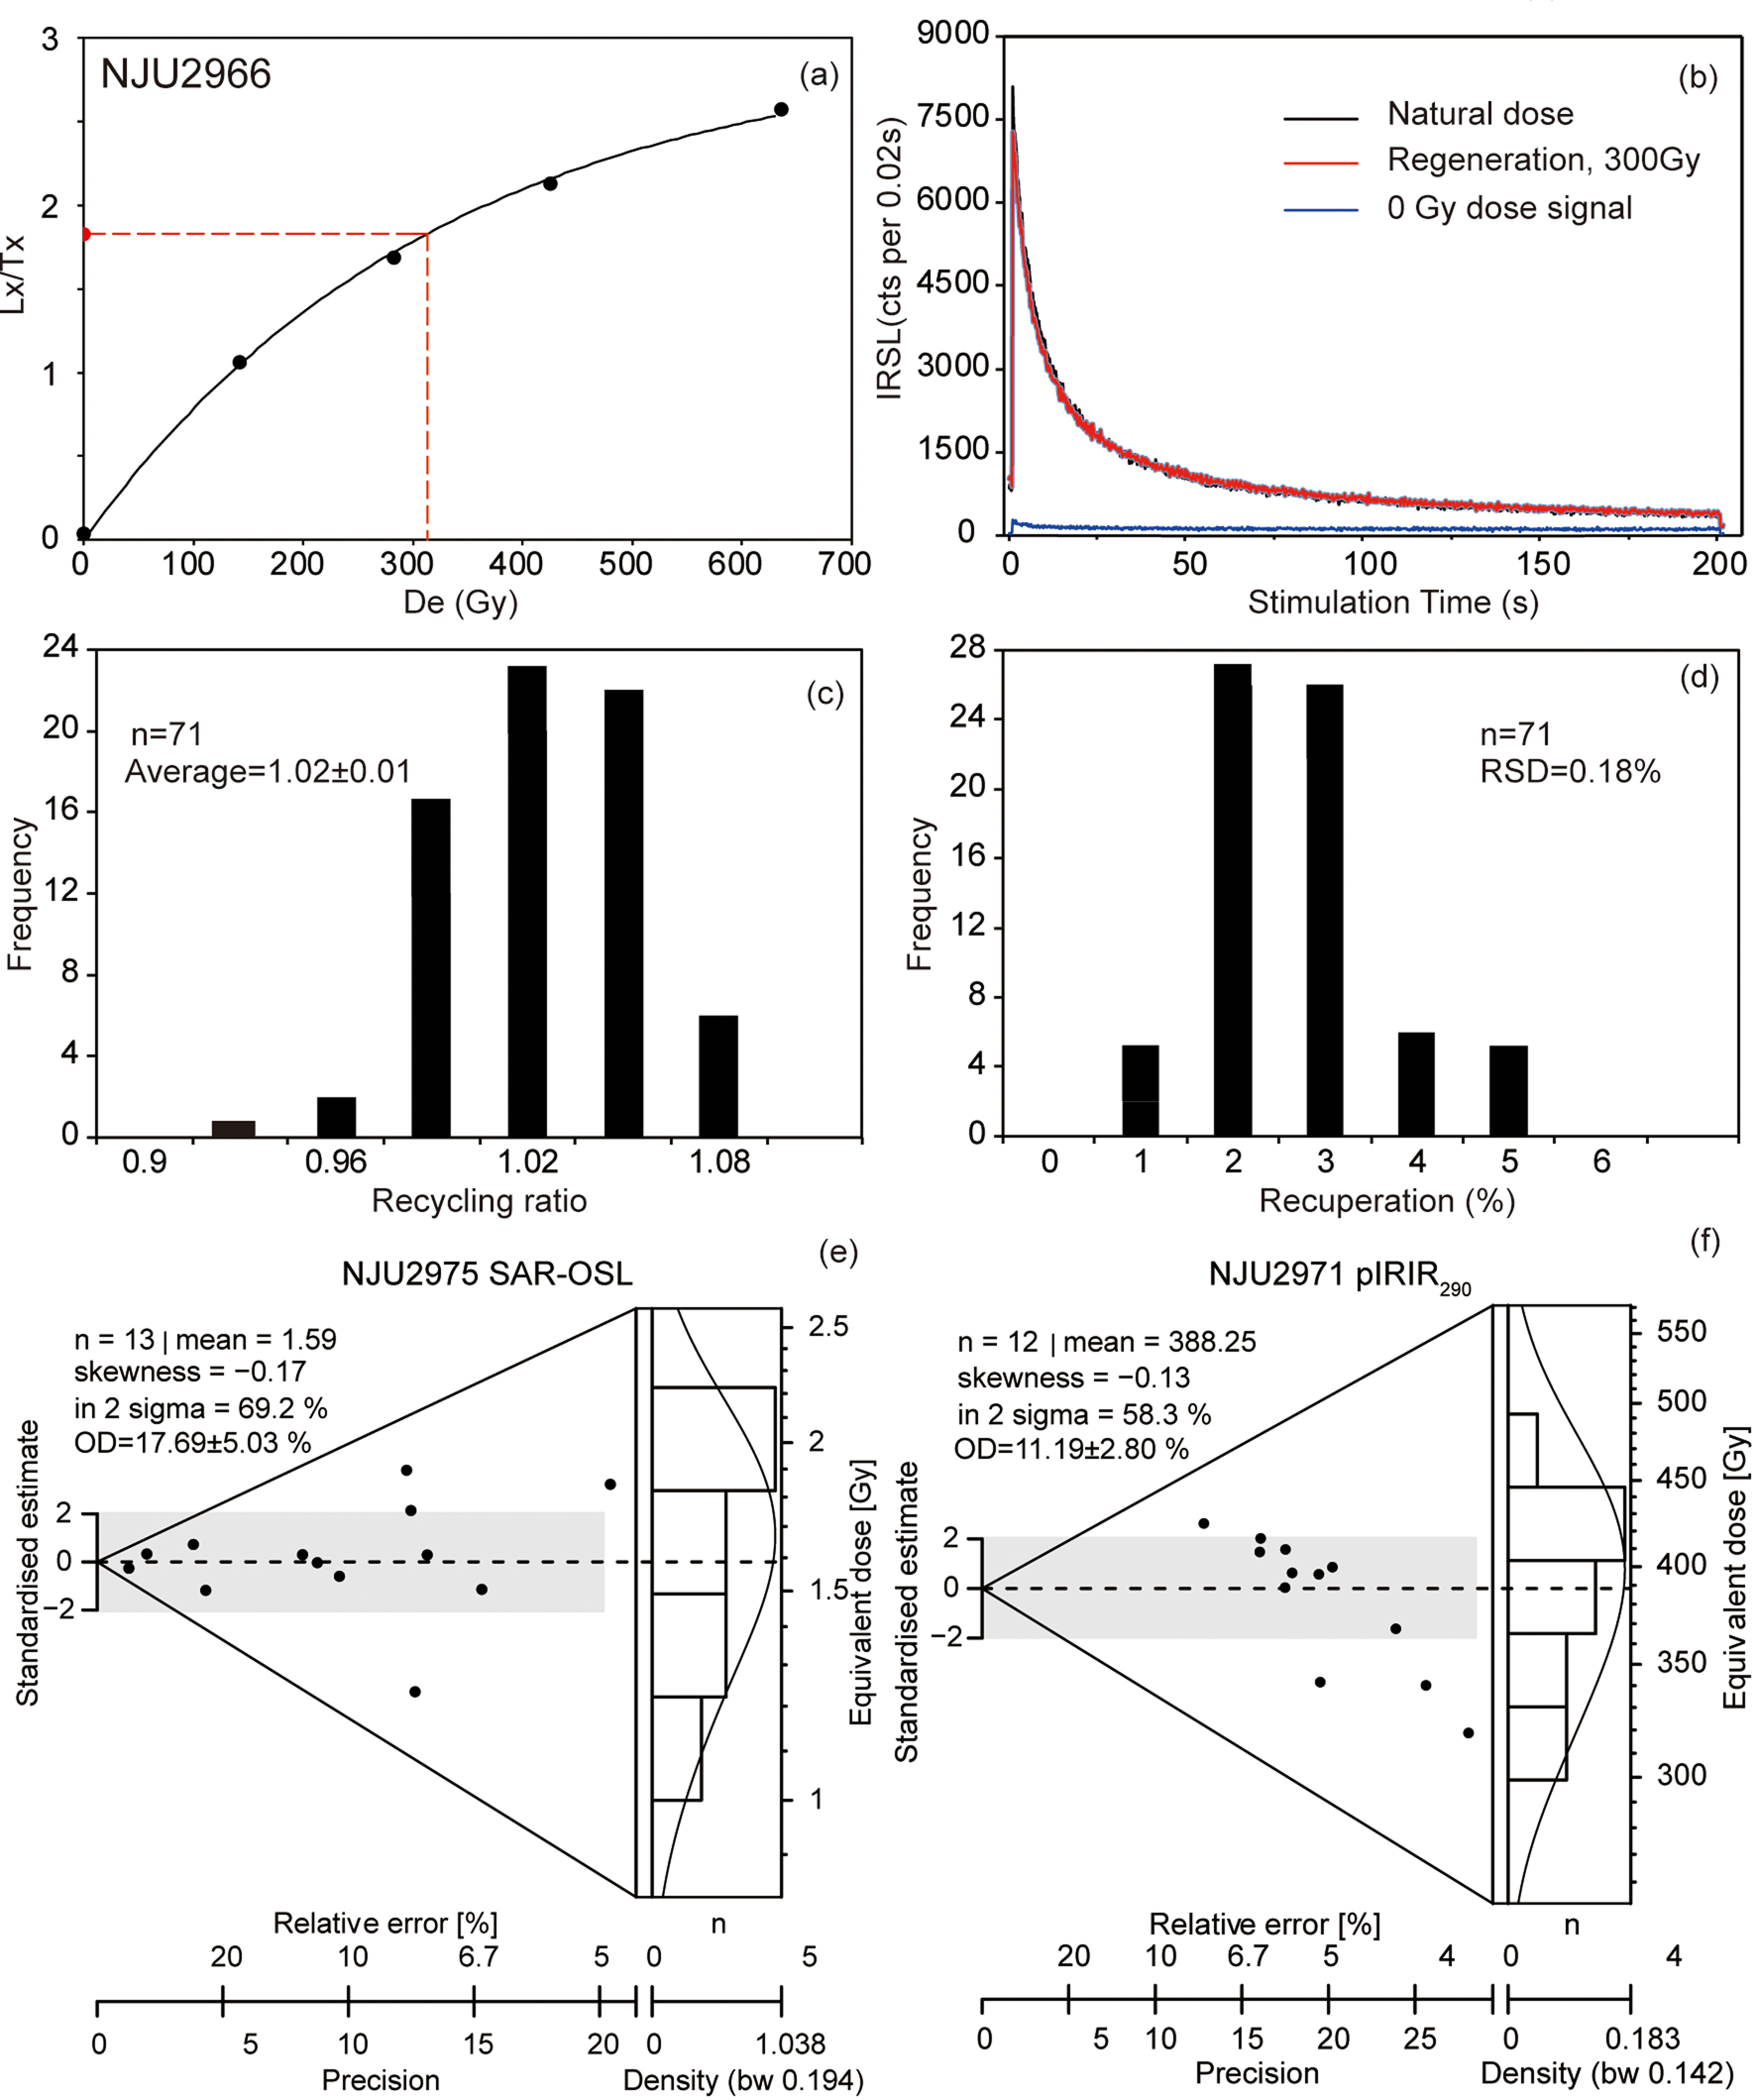
Figure 3. (color online) Luminescence signal features of typical samples: (a), (b) dose response and decay curves acquired using pIRIR290 protocol for NJU2966; (c) recycling ratio; and (d) recuperation of feldspar aliquots (n=71) after removing the rejected aliquots of NJU2976 and De distributions of all accepted aliquots of (e) NJU2975 using the SAR protocol and (f) NJU2971 using the pIRIR290 protocol.
Although the high-temperature IRSL signal is difficult to bleach, previous studies have suggested that the residual dose of the pIRIR signal is not a key factor in the calculation (Rui et al., Reference Rui, Li and Guo2020a, Reference Rui, Li and Guob; Zhang and Li, Reference Zhang and Li2020). Guo et al. (Reference Guo, Li, Zhang and Roberts2015, Reference Guo, Li, Zhang, Yuan, Xie and Roberts2016) dated some sites in the study area, and found “10–45 Gy” residual doses in those samples. Liu et al. (Reference Liu, Wu, Deng, Tong, Qin, Li, Yuan and Zhu2016) studied the bleaching features of TT-OSL and pIRIR290 at the Xiaochangliang section, ~2 km southwest of the study site in the same basin, indicating that the final ages of the upper aeolian section could be obtained after subtracting only 5 ka from the pIRIR290 ages. For the fluvial deposits in T1, the ages of Liu et al. (Reference Liu, Wu, Deng, Tong, Qin, Li, Yuan and Zhu2016) and Zhao et al. (Reference Zhao, Lu, Wang, Chen, Liu and Mao2010) were consistent; thus, there was no evidence of serious bleaching problems of the sediments at T1 in this basin. In order to define the residual dose of T1 and T2 and make a cross-check, the NJU2975 was also measured using the feldspar pIRIR290 procedure. As is shown in the Table 1, the average dose of NJU2975 was taken as the residual dose of the other samples. Then the residual dose was subtracted from the De values in the present study. Table 1 shows that the De values range from ~310–400 Gy, except that of NJU2574 (291.4 ± 32.3 Gy).
The environment dose rate
The dose rates of the remaining quartz and feldspar samples, except that of NJU2974 at the bottom of T1, were stable and fluctuated within a 10% error range (Table 1). The low total dose rate of NJU2974 could be ascribed to the following reasons. On the one hand, the higher water content of the bottom sample NJU2974 might have been caused by its lower position that more easily kept water, increasing the attenuation in dose rate (Duller, Reference Duller, Rink and Thompson2015b). On the other hand, soil-formation processes, which probably involved the loss of K and grain-size reduction, may have resulted in the change of U/Th value (Durcan et al., Reference Durcan, King and Duller2015). The U/Th ratio of NJU2974 (1:7) become smaller than that of the others (~1:5), but still wasn't too far removed from others. Therefore, the dose rates of all the samples were accepted. The measured water content of T2 increased from 1.92% to 7.34% with depth, whereas that of T1 varied from 5.42% to 7.55%. Considering that the sample collection was conducted a few months after the excavation in winter, water loss might have resulted in the decreased water content of the upper part of T2. According to the previous studies at some sections, such as Huojiadi, Motianling, Banjingzi, Xiaochangliang, the water content of loess is 10% and ~15% for paleosol and fluvial sediments (Zhao et al., Reference Zhao, Lu, Wang, Chen, Liu and Mao2010; Guo et al., Reference Guo, Li, Zhang and Roberts2015, Reference Guo, Li, Zhang, Yuan, Xie and Roberts2016; Liu et al., Reference Liu, Wu, Deng, Tong, Qin, Li, Yuan and Zhu2016). The long-term water content of the samples was therefore assumed to be 10% for the loess sample of NJU2975 and for NJU2976 in the T2, and 15% for other samples.
Chronological results
The age results for the feldspar samples were obtained after subtracting the residual dose, as summarized in Table 1 (corrected age column). In fact, they are consistent with each other, considering the errors, and have little effect on the discussion of environment and the development of Paleolithic industry. The final ages of all the samples were obtained through the pIRIR290 protocol as the doses of quartz samples were saturated. The feldspar age of NJU2975 is ~10 ka lager than its quartz ages. The ages of other samples were obtained after subtracting the residual dose (i.e., the dose of NJU2975 obtained by pIRIR290). The age of NJU2976 at a depth of 4.14 m is 78 ± 5 ka. The ages of NJU2977 and NJU2978 below 5.7 m are ca. 86 and 85 ka, respectively, and are consistent with each other, considering the relative age errors. These results indicate that the age of the lower part of T2 (below ~4 m) ranges from 78–86 ka, suggesting a rapid deposition process over a few thousand years. The ages of the samples on T1 range from 82–102 ka, which also is the age range of the ~2.7-m-thick cultural layer below 0.9 m. The ages of NJU2971 and NJU2972, which are 40 cm apart in the same layer, are 100 ± 6 ka and 102 ± 7 ka, respectively, which is consistent with each other within the error ranges. Therefore, the age of the layer was assumed to be ca. 100–102 ka. The NJU2974 sample at the bottom of T1 is ca. 108–140 ka, which might imply that hominins appeared here at the start of the late Pleistocene. Overall, the age results are generally identical to the stratigraphic context in the late Pleistocene. In addition, the ages of the cultural layer were consistent with the results of the upper layers of Xiaochangliang and Haojiatai sections (Zhao et al., Reference Zhao, Lu, Wang, Chen, Liu and Mao2010; Liu et al., Reference Liu, Wu, Deng, Tong, Qin, Li, Yuan and Zhu2016).
DISCUSSION
Environmental implications
The magnetic susceptibility, grain-size records, pollen analysis, and oxygen and carbon isotopic analyses in the Nihewan Basin and adjacent area (such as the loess Plateau and North China Plain) could provide references to hominin living environments in the Nihewan Basin. The high-resolution magnetic susceptibility of loess at loess Plateau and grain-size records from northern China showed sub-stage climate shifts from 5a to 5e (An et al., Reference An, Kukla, Porter and Xiao1991; Yang and Ding, Reference Yang and Ding2014; Luo et al., Reference Luo, Ma, Wang and Li2019). There is little evidence of climate features in the last interglacial period in the Nihewan Basin. As indicated by the oxygen and carbon isotope analyses at Hutouliang section, the climate altered between hot-dry and cool-wet climate, with the peak of hot-dry climate at 90 ka and 130 ka (Xia et al., Reference Xia, Han, Jin and Zhou1998). Study of the environment at the Xujiayao Site using magnetic susceptibility, grain-size records, and other proxy indexes suggested shifts mainly between hot-wet and cool-dry climate during MIS 5 (Li and Ma, Reference Li and Ma2014). It appears to have been a steppe-forest landscape during MIS 5 with a mild but fluctuating climate in the Nihewan Basin.
This study used magnetic susceptibility as a climate proxy index, combined with the global deep sea oxygen isotope variation curves. Figure 4 shows that the age range of the entire section spans from 0.5 ka at the top of T2 to 110 ka at the bottom of T1. The ages of T2 correspond to the changes in magnetic susceptibility and transformation of stratigraphic features. High values of magnetic susceptibility were observed at a depth of 4–6 m, where the developed black soil suggests the existence of a warm period between ca. 78–86 ka, corresponding to the MIS 5a sub-stage as well. However, a slight decrease trend in magnetic susceptibility occurred after 86 ka, indicating a small climatic shift. The luminescence ages of NJU2978 at the bottom of T2 are consistent with those of NJU2966 and NJU2967 at T1; this consistency verifies the accumulation of the deposits of these samples during the same period. The magnetic susceptibility at T1 matches the ages and climatic shifts as well. It also shows that the age of the artifact-bearing layer of the YFB site ranges from 82–102 ka, corresponding to MIS 5 (Fig. 4; i.e., the last interglacial period). The age range of 82–86 ka also corresponds to the MIS 5a sub-stage, and 102 ka corresponds to the end of the MIS 5c sub-stage. The last reddish soil layer on T1 also showed high magnetic susceptibility, which might correspond to MIS 5e sub-stage, according to its age of 124 ± 16 ka. All in all, most of the artifacts were found in the fourth and fifth layer during the MIS 5a and MIS 5c sub-stages, showing that hominins resided in an environment with mild but fluctuating climates (Li and Ma, Reference Li and Ma2014; Luo et al., Reference Luo, Ma, Wang and Li2019).

Figure 4. (color online) Stratigraphy, luminescence ages, magnetic susceptibility, and MIS corresponding to the YFB site.
Paleolithic industry implications
A chronological sequence of late Pleistocene sites that is shown in Figure 5 includes most sites with published ages in the Nihewan Basin. The revolution of Paleolithic industries in the Nihewan Basin during the late Pleistocene is unclear, partly because of chronological gaps at 50–100 ka. The chronological estimates of the YFB site bridge the long gap between 86 ka and 100 ka (Fig. 5). This site preserves the traditional small-tool industry, but also provides materials for further archaeological research on small-flake traditions in the area. Paleolithic sites have been dated to MIS 5, which was an important period for the evolution of archaic Homo sapiens (Gao et al., Reference Gao, Peng, Fu and Li2017) and associated Paleolithic industries (Wang, Reference Wang2019) that remain limited in China. Typical Paleolithic sites in northern China from this period include Xujiayao, Banjingzi, and Lingjing (Fig. 6). As the only hominin fossil-bearing site in Nihewan Basin, the age of the Xujiayao site remains controversial—with a possible age of 160–200 ka (Wang and Li, Reference Wang and Li2020) or 104–120 ka (Chen et al., Reference Chen, Yuan, Gao, Wang and Zhao1982, Reference Chen, Yuan and Gao1984)—and was not included in the discussion in this paper.
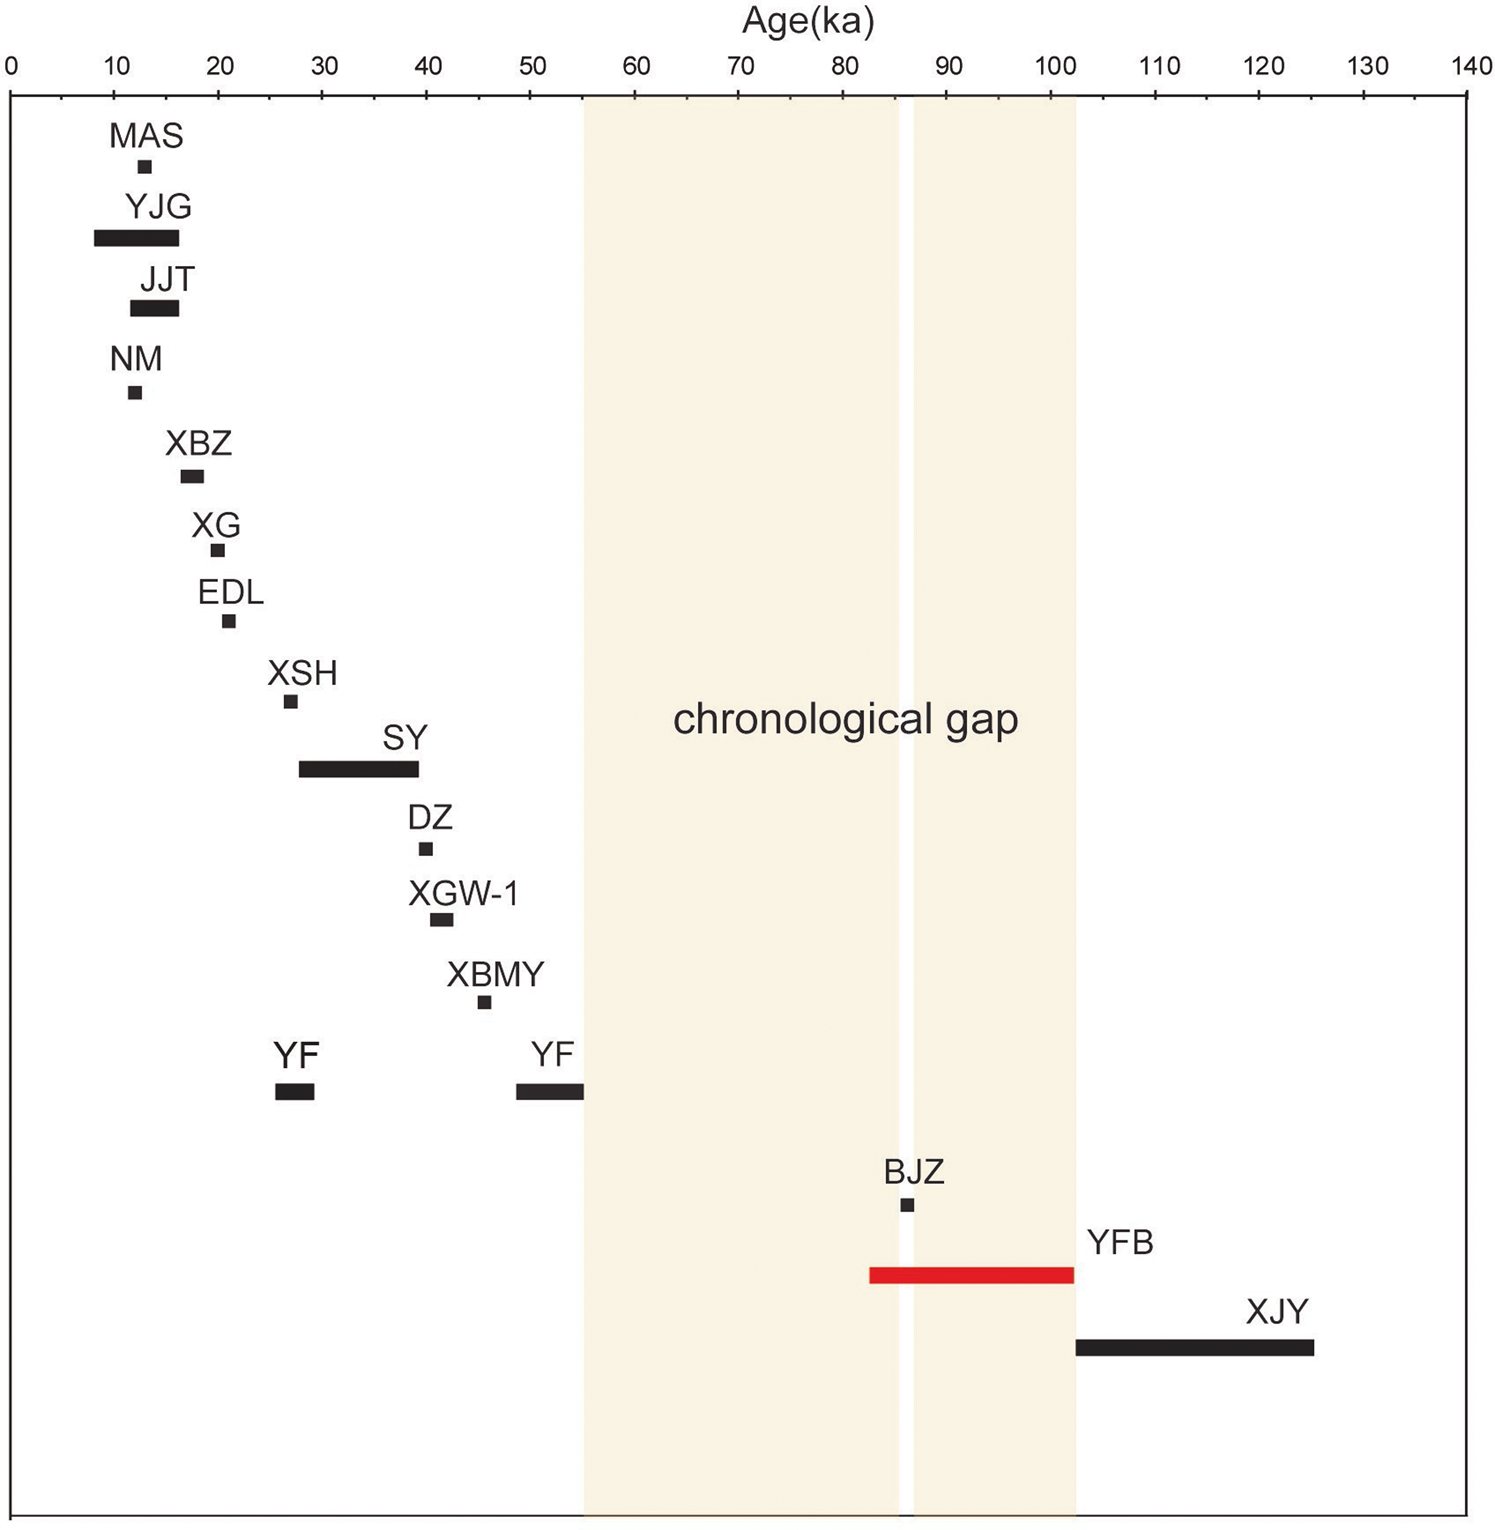
Figure 5. (color online) Chronological framework of the Paleolithic sites in the Nihewan Basin during the late Pleistocene, including MAS (Maanshan), YJG (Yujiagou), JJT (Jijitan), NM (Nanmo), XBZ (Xiabuzhuang), XG (Xigou), EDL (Erdaoling), XSH (Xishahe), SY (Shiyu), DZ (Duzhuang), XGW-1 (Xigouwan-1), XBMY (Xibaimaying), YF (Youfang), BJZ (Banjingzi), YFB (Youfangbei), and XJY (Xujiyao).
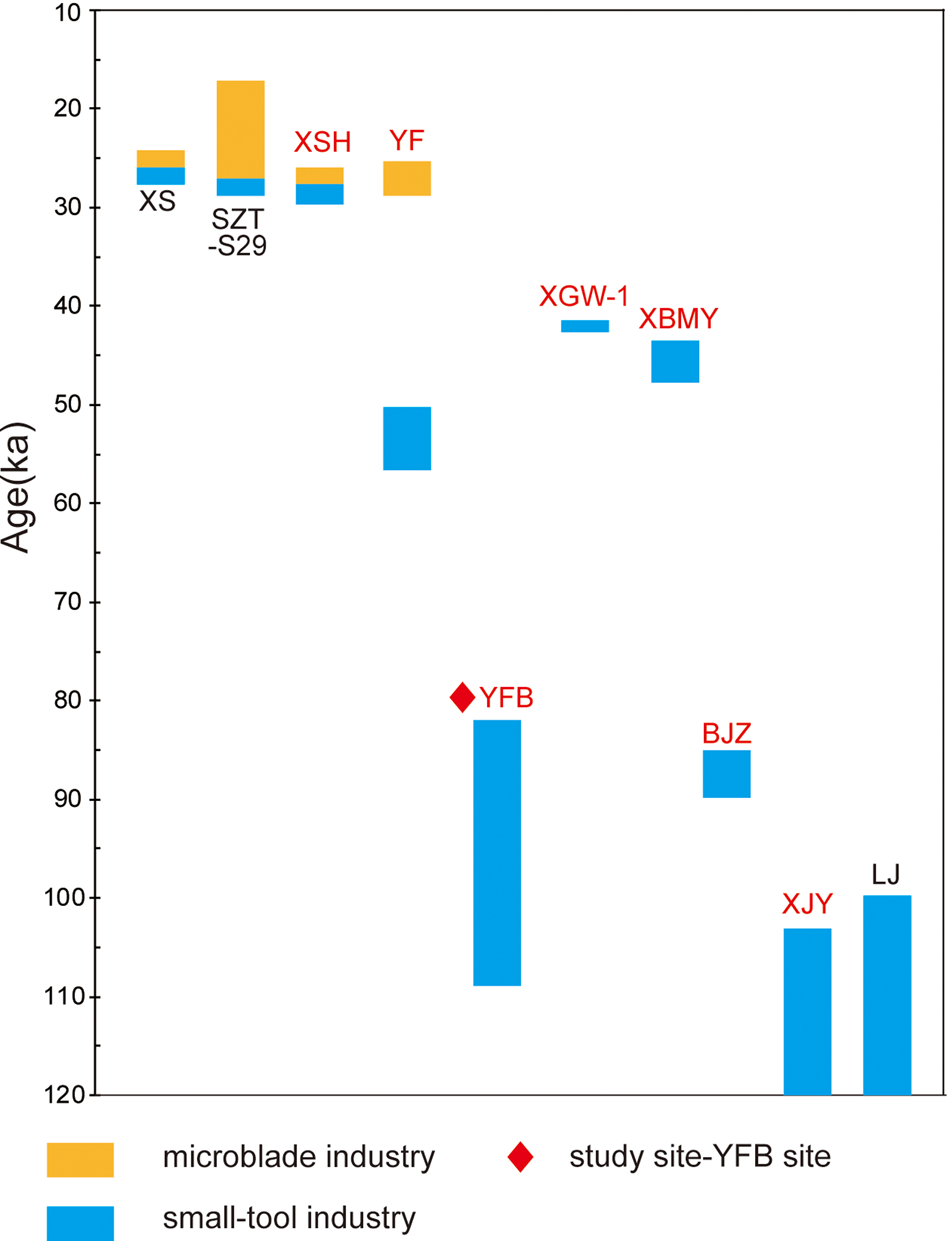
Figure 6. Chronological sequence of the stone technology of several typical sites in North China; site abbreviations colored red are located in the Nihewan Basin and include XSH (Xishahe), YF (Youfang), YFB (Youfangbei = the study site), XGW-1 (Xigouwan-1), XBMY (Xibaimaying), BJZ (Banjingzi), XJY (Xujiayao), and other related sites, including XS (Xishi), SZT-S29 (Shizitan 29), and LJ (Lingjing). (For interpretation of the references to color in this figure legend, the reader is referred to the web version of this article.)
The Banjingzi and Lingjing sites are most likely dated as 86 ka (Guo et al., Reference Guo, Li, Zhang, Yuan, Xie and Roberts2016) and 100–120 ka (Li et al., Reference Li, Li, Lotter and Kuman2018), respectively. Both sites have regular cores, which were characterized in this study using a simple core reduction strategy. However, the Banjingzi and Lingjing sites also contain discoid cores, which indicate the planning and organization of stone tool manufacturing. In contrast, all cores at the YFB site are conventional. These differences reflect the complexity of stone technology during this period.
From the perspective of Paleolithic development during the late Pleistocene, some researchers have tried to prove that microblade technology resulted from the technological adaptation of indigenous hominins (Yi et al., Reference Yi, Gao, Li and Chen2016). Several microblade sites in North China recently have been re-excavated and newly excavated. The most typical sites include Xishi, Shizitan 29, and Xishahe (Fig. 1, No. 8–10). The results further reveal the existence of a cultural layer of small-flake and -tool assemblages below the layer where the microblade is located (Fig. 6). Additionally, a small-tool assemblage-bearing layer closely connected to the Xishi upper microblade artifact layer was discovered. In accordance with AMS14C dating, the age of the former is estimated to be slightly older than 25 cal ka BP (Wang and Wang, Reference Wang and Wang2014). The Shizitan 29 site has a small-tool-bearing layer, microblade, and small-tool industry layers coexisting at 26–24 cal ka BP, and an underlying layer with small flakes at ca. 28 ka (Song et al., Reference Song, Cohen, Shi, Wu, Kvavadze, Goldberg, Zhang, Zhang and Bar-Yosef2017). The recently studied Xishahe site, which has an initial microblade culture, is dated to 29–28 ka and 27 ka (Guan et al., Reference Guan, Wang, Wang, Olsen, Pei, Zhou and Gao2020).
Although the YFB site does not have a microblade-bearing layer in the upper part of the section, the related excavation around the YF site might help us understand Paleolithic industry development in North China. The age of the YF site is 26–29 ka, which is regarded as the earliest microblade site in the northern high latitudes of China (Nian et al., Reference Nian, Gao, Xie, Mei and Zhou2014). Recent excavations indicate that this site might have two cultural layers with OSL dates from 56–27 ka (Li et al., Reference Li, Li, Li, Mei, Liu, Yu and Wang2017). The age of the lower cultural layer is assigned to the traditional small-tool industry, whereas that of the upper cultural layer belongs to the microblade industry (Li et al., Reference Li, Li, Li, Mei, Liu, Yu and Wang2017). However, because of the lack of detailed archeological reports, we can only assume that the YF site contains small flakes at 56–50 ka, but that the small-flake tool did not disappear after 50 ka, as indicated by the age of the Xibaimaying and Xigouwan sites (Fig. 6). In terms of chronology, the YFB site expands the time range of hominin occupation around the YF site to up to 102 ka, even to the beginning of the late Pleistocene. The Paleolithic sites related to the YFB site present long-term evidence for analyzing the emergence of microlithic technology. The results confirm that the change in Paleolithic technology in the Nihewan Basin was not obvious until ca. 30 ka (Fig. 6). Further excavations and chronological studies are necessary to analyze the revolution of Paleolithic industries during the late Pleistocene.
CONCLUSIONS
In this study, the feldspar pIRIR290 dating method was used to date the samples collected from the YFB site. The age of the YFB cultural layer ranged from ca. 124–82 ka, after an age correction based on the experimental differences between quartz and feldspar bleaching. The YFB Paleolithic technology belonged to the traditional small-flake-tool industry in North China, which also bridged the long chronological gap of human occupation in the Nihewan Basin. According to the age results and magnetic susceptibility, the YFB site corresponded to the interglacial stage from MIS 5a to MIS 5c, and even extend to MIS 5e, which had an alternative but generally mild climate. Given that only a few sites in the Nihewan Basin have been dated during this period, the dating of the YFB site added new materials to the research on the early late Pleistocene and provided new clues about human activities during the late Pleistocene in this area.
Acknowledgements
We would like to thank Yi Shuangwen and Yang Chuanbin for their help with the luminescence experiments and Xu Xinghua for his assistance in field sampling. We are grateful to Shannon Mahan (USGS) and the anonymous reviewers for their helpful suggestions.
Financial Support
This research was supported by the National Natural Science Foundation of China (grant nos. 41972185 and 41690111).


