


1. Introduction
With currently over 3.2 million km2 of remaining native vegetation, the Brazilian Amazon has long been the world's most active agricultural frontier in terms of forest loss and CO2 emissions (FAO, 2006). Yet, the pace of forest clearings in the Amazon slowed down substantially in the second half of the 2000s. After peaking at more than 27,000 km2 per year in 2004, the Amazon deforestation rate fell sharply over the following years to about 7,000 km2 in 2009 (INPE, 2012). Understanding how to best combat tropical deforestation – and thereby simultaneously tackle the threats of climate change and irreversible loss of biodiversity – has become a topic of global concern. Although crucial from both national and international policy perspectives, empirical knowledge about the drivers of the recent decrease in Amazon deforestation is still scant.
Figure 1 reveals two potential explanations for the deforestation slowdown. On the one hand, the Amazon deforestation rate appears to be highly correlated with agricultural output prices, especially in the first half of the decade. While price increases provide incentives for producers to convert forest areas into farmland to profit from expanded production, price decreases inhibit this behavior and thereby alleviate the pressure on forests. Market conditions – namely falling agricultural commodity prices in the mid-2000s – may thus have contributed to containing forest clearings. On the other hand, Brazilian conservation policies aimed at controlling and preventing deforestation in the Amazon underwent significant revisions during the 2000s, marked by two key policy turning points. First, the launch of the Action Plan for the Prevention and Control of Deforestation in the Legal Amazon (PPCDAm) in 2004 integrated action across different government institutions and introduced novel procedures for monitoring, environmental control, and territorial management. Secondly, new policy measures implemented beginning in 2008 targeted municipalities with critical rates of deforestation and conditioned rural credit upon proof of borrowers' compliance with environmental regulations. As shown in Figure 1, the policy turning points were followed by sharp drops in deforestation rates, suggesting that conservation policies helped curb deforestation.
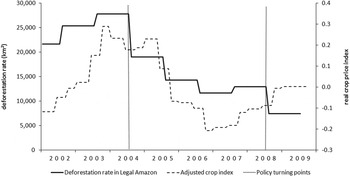
Fig. 1. Amazon deforestation rate and agricultural price trends, 2002–2009
In this paper, we assess the contribution of agricultural prices and conservation policies to the recent Amazon deforestation slowdown. The empirical challenge we face is twofold. First, we must disentangle the effect of policies from potentially relevant price effects. Secondly, we must explore cross-sectional variation in our empirical setting to identify the effect of policies, isolating it from other contemporaneous effects.
We start by developing a conceptual framework, which yields two main implications to guide our empirical analysis. First, it indicates that we must control for agricultural output prices to evaluate the impact of conservation policies on deforestation. Secondly, it suggests that the farmer's response to changes in policy stringency depends on the tightness of the land constraint he faces. In particular, conservation policies are expected to have no effect in places where the area that is suitable for production within landholdings is large enough to fully accommodate optimal farmland. We should therefore only expect policies to be effective in places where land constraints for agricultural production are tight. This second implication introduces cross-sectional variation in response to a new policy across localities with different land endowments.
Based on this conceptual framework, we conduct an empirical evaluation of the effectiveness of conservation policies introduced beginning in 2004 and 2008, as well as of the role played by agricultural output prices in the slowdown in Amazon deforestation in the 2000s. Our analysis uses a 2002 through 2009 municipality-by-year panel of data containing municipalities from four Legal Amazon states.Footnote 1 Our main dependent variable, the normalized annual deforestation increment, is constructed from satellite-based deforestation data.
The sets of conservation policies are represented by two time dummy variables – one for each of the 2004 and 2008 policy turning points – and their interaction with a proxy for the tightness of land constraints at the municipality level. Our first coefficient of interest thus captures policy impacts on deforestation by comparing deforestation trends before and after 2004, in municipalities where the tightness of land constraints is lower compared to those where it is higher. Our second coefficient of interest is analogously defined for 2008. Drawing on implications from our conceptual framework, we select the share of land that is not legally available to farmers for use in agricultural production relative to total municipal land area as our baseline proxy for the tightness of municipal land constraints. The interaction between the proxy and the policy turning points thus results in policy variables with sharp time and cross-sectional variation within our municipality-level panel of data.
We take advantage of our data set's panel structure to control for municipality fixed effects, year fixed effects and municipality-specific time trends, thereby filtering out the impact of intrinsically different municipal characteristics, common shocks, initial conditions, and differences in municipality-level dynamics. We argue that, since the tightness of the land constraint is determined by either fixed or slow-moving factors at the municipality level, and conditioned upon high-frequency variation in market forces, the variation captured by our policy variables should be orthogonal to any latent determinant of deforestation in our empirical setting.
We first analyze the effect of crop and cattle prices on deforestation. Cross-sectional variation in prices is obtained using agricultural output prices recorded in a non-Amazon Brazilian state, weighted by the relative importance of each agricultural product at the municipal level. Results indicate that deforestation is sensitive to crop and cattle prices, even after controlling for year and municipality fixed effects, as well as for municipality-specific time trends. Our findings suggest that crop and cattle prices exhibit different dynamic relationships with deforestation.
Having shown that agricultural output prices affect deforestation, we perform policy impact evaluation controlling for prices. Results indicate that the conservation policies associated with the policy turning points were effective at curbing Amazon deforestation. In counterfactual simulations we estimate that, had the set of conservation policies implemented beginning in 2004 and 2008 not been introduced, deforestation in sample municipalities from 2005 through 2009 would have added up to more than 130,000 km2. Yet, observed sample deforestation in this period totaled about 57,000 km2 – 56 per cent less than in the absence of the policies. Our results therefore suggest that conservation policies avoided 73,000 km2 of Amazon forest clearings.
We take a first step in the direction of cost-benefit analysis by performing a simple calculation of the monetary benefits of protecting the forest. We find that the 73,000 km2 of avoided deforestation are equivalent to a store of 2.7 billion tonnes of CO2.Footnote 2 Given the price of US$ 5/tCO2 commonly used in current applications, this store is valued at US$ 13.2b. We also investigate whether the conservation policies associated with the two policy turning points affected key economic variables at the municipality level. Results suggest that there is no relevant trade-off between conservation policies and local development in the Amazon.
Our empirical findings yield important policy implications for the design of payment for environmental services (PES) policies. Given that agricultural commodity prices are shown to be relevant drivers of Amazon deforestation, the shadow price of preserving the forest is expected to change with changing agricultural prices. Output price variations should therefore be incorporated into PES compensation schemes to ensure that producers' forest-clearing incentives do not surpass their preservation ones at any one point in time. To the best of our knowledge, compensation schemes that vary according to agricultural output prices have not been implemented in current PES setups.
The remainder of this paper is organized as follows. Section 2 presents an overview of the related literature. Section 3 provides the policy background for the analysis. Section 4 introduces the conceptual framework. Section 5 describes the data set and the main variables. Section 6 details our empirical strategy. Section 7 discusses the results. Section 8 performs robustness checks. Section 9 concludes.
Finally, note that this paper's length was reduced to meet publication requirements. The interested reader will find relevant additional material in the online Appendix. This material is referenced throughout the text that follows.
2. Related literature
A substantial stream of the literature on the determinants of tropical deforestation is dedicated to documenting the impact of long-run economic drivers of deforestation, such as population pressures, income level and economic growth, technological change, soil quality and climate (Cropper and Griffiths, Reference Cropper and Griffiths1994; Panayotou and Sungsuwan, Reference Panayotou, Sungsuwan, Brown and Pearce1994; Barbier and Burgess, Reference Barbier and Burgess1996; Chomitz and Gray, Reference Chomitz and Gray1996; Cropper et al., Reference Cropper, Griffiths and Mani1997; Pfaff, Reference Pfaff1999; Chomitz and Thomas, Reference Chomitz and Thomas2003; Foster and Rosenzweig, Reference Foster and Rosenzweig2003). The influence of factors affecting household and firm-level forest clearing decisions has also received significant attention in the literature. Rising agricultural output prices, rural credit, roads and road building and tenure insecurity have been identified as some of these more immediate causes of deforestation (Reis and Margulis, Reference Reis, Margulis, Dornbusch and Poterba1991; Panayotou and Sungsuwan, Reference Panayotou, Sungsuwan, Brown and Pearce1994; Reis and Guzmán, Reference Reis, Guzmán, Brown and Pearce1994; Barbier and Burgess, Reference Barbier and Burgess1996; Chomitz and Gray, Reference Chomitz and Gray1996; Pfaff, Reference Pfaff1999; Pfaff et al., Reference Pfaff, Robalino and Walker2007; Araujo et al., Reference Araujo, Bonjean, Combes, Motel and Reis2009; Hargrave and Kis-Katos, Reference Hargrave and Kis-Katos2013).
This paper contributes to the literature on drivers of deforestation in four ways. First, our core analysis evaluates the role of conservation policies as possible deterrents of forest clearing activity. In particular, we evaluate the impact of broad changes in land use regulation on deforestation at the local level. Despite being potentially crucial to shaping economic incentives that determine household- and firm-level land use decisions, changes in environmental regulation have been relatively less studied in micro-level impact evaluations. Existing studies looking at specific contexts have found that restrictive regulations can help mediate market demand influences on natural resources (for example see the case of fishery management studied in Reddy et al., Reference Reddy, Wentz, Aburto-Oropeza, Maxey, Nagavarapu and Leslie2013). However, sources of exogenous within-country variation in policy adoption are often rare, while longitudinal data typically suffer from both quality and time frame limitations. Within this context, many approaches tend to be only descriptive, such as those provided in Ewers et al. (Reference Ewers, Laurance and Souza2008) and Mendonça et al. (Reference Mendonça, Loureiro and Sachsida2012); see Pfaff et al. (Reference Pfaff, Amacher and Sills2013) for an overview of studies regarding policy impacts on deforestation.
Recently, the greater availability of satellite data on land cover has helped promote the evaluation of specific policy interventions, particularly those for which spatial or geographical factors are most relevant.Footnote 3 In this paper, we exploit key local heterogeneities to gain cross-sectional variation in how binding conservation policy actually was. Similarly to the existing studies, we argue that policy impacts vary across locations because baseline deforestation depends on location-specific characteristics. This strategy allows us to advance with the evaluation of major policy interventions in the Brazilian Amazon, as well as to test whether conservation policies played a relevant role in what was one of the greatest declines in deforestation rates recently experienced by a developing country.
Secondly, our study contributes to the investigation of the causal effects of market forces on forest clearings. The earlier literature provides evidence that higher agricultural output prices stimulate forest clearings (Panayotou and Sungsuwan, Reference Panayotou, Sungsuwan, Brown and Pearce1994; Andersen, Reference Andersen1996; Barbier and Burgess, Reference Barbier and Burgess1996, Reference Barbier and Burgess2001; Angelsen and Kaimowitz, Reference Angelsen and Kaimowitz1999). Yet, more recent studies have found mixed results regarding the significance and even the direction of the correlation between agricultural output prices and Amazon deforestation (Ferraz, Reference Ferraz2001; Arima et al., Reference Arima, Simmons, Walker and Cochrane2007; Barreto et al., Reference Barreto, Pereira and Arima2008; Araujo et al., Reference Araujo, Bonjean, Combes, Motel and Reis2009; Hargrave and Kis-Katos, Reference Hargrave and Kis-Katos2013). The lack of reliable micro-economic data and exogenous variation in agricultural output prices at the local level limits the identification of price effects (Angelsen and Kaimowitz, Reference Angelsen and Kaimowitz1999; Arcand et al., Reference Arcand, Guillaumont and Jeanneney2008). In this paper, we show that agricultural output prices recorded at a non-Amazon Brazilian state serve as indicators of local market conditions in the Amazon. We then use these non-Amazon prices to explore exogenous variation in constructed agricultural price indices and assess their effect on deforestation.
Thirdly, it investigates the causes of a deforestation phenomenon that has seldom been explored in the literature, the recent Amazon deforestation slowdown. Although several studies focus on the determinants of deforestation specifically in the Brazilian Amazon (Reis and Margulis, Reference Reis, Margulis, Dornbusch and Poterba1991; Reis and Guzmán, Reference Reis, Guzmán, Brown and Pearce1994; Pfaff, Reference Pfaff1999; Chomitz and Thomas, Reference Chomitz and Thomas2003; Arima et al., Reference Arima, Simmons, Walker and Cochrane2007; Pfaff et al., Reference Pfaff, Robalino and Walker2007; Weinhold and Reis, Reference Weinhold and Reis2008; Araujo et al., Reference Araujo, Bonjean, Combes, Motel and Reis2009; Hargrave and Kis-Katos, Reference Hargrave and Kis-Katos2013), there is scarce empirical evidence on the immediate drivers of the sharp decrease in Amazon deforestation observed in the second half of the 2000s. In this paper we not only focus on disentangling the effects of policies and market forces on deforestation, but also evaluate the aggregate policy impact on deforestation, and take a first step in the direction of a cost-benefit analysis. To the best of our knowledge, this is the first paper to implement such aggregate analysis, which is useful for policy design.
Finally, our paper also speaks to the literature on the relationship between economic growth and forest preservation. A consensus is yet to be established in the literature, with existing empirical evidence to support both the absence of a significant positive relationship between income and forest growth (Cropper and Griffiths, Reference Cropper and Griffiths1994; Panayotou, Reference Panayotou, Ahmed and Doeleman1995), and the possibility of there being a positive relationship for income levels above a certain threshold (Antle and Heidebrink, Reference Antle and Heidebrink1995) or within closed economies (Foster and Rosenzweig, Reference Foster and Rosenzweig2003). In this paper, we conduct empirical exercises to investigate how the agricultural sector in Brazil behaved during the Amazon deforestation slowdown. From a general perspective, this directly contributes to the ongoing debate about the relationship between economic growth and the environment (Grossman and Krueger, Reference Grossman and Krueger1995; Arrow et al., Reference Arrow, Bolin and Costanza1996).
3. Institutional context
Throughout the 2000s, the Brazilian federal government and the Ministry of the Environment (MMA) sought to inhibit forest clearings and promote forest conservation by focusing on three main policy efforts: strengthening monitoring and law enforcement; expanding protected territory; and adopting a conditional rural credit policy. The pursuit of these efforts led to intense reformulation of conservation policies throughout the decade, with two years standing out as important policy turning points: 2004 and 2008.
3.1. 2004: A new action plan
The launch of a novel action plan for combating deforestation in 2004, the PPCDAm, marks the first policy turning point. The plan was composed of a large set of strategic conservation measures to be executed as part of a collaborative effort between federal, state and municipal governments, alongside civil society and specialized organizations – namely, the National Institute for Space Research (INPE), the Federal Police, the Federal Highway Police and the Brazilian Army. The project focused on three main areas: (i) territorial management and land use; (ii) command and control; and (iii) promotion of sustainable practices.
Several of the changes to Brazilian forestry and conservation policy introduced in the second half of the 2000s happened within the PPCDAm framework. Remote sensing based Amazon monitoring capacity improved significantly with the creation of the Real-Time System for Detection of Deforestation (DETER) in 2004. Developed and operated by INPE, DETER is a satellite-based system that captures and processes georeferenced imagery on forest cover. The images, generated in 15-day intervals, are used to locate deforestation hot spots and to issue alerts signaling critical areas. The Brazilian Institute for the Environment and Renewable Natural Resources (Ibama), which operates as the national environmental police and law enforcement authority, targets law enforcement activities in the Amazon based on these alerts. Prior to the activation of DETER, Amazon monitoring depended on voluntary reports of deforestation activity, seldom allowing law enforcers to reach hot spots in a timely manner. With the adoption of the new remote sensing system, Ibama was able to more closely monitor and more quickly act upon areas with illegal deforestation activity.
Parallel to the PPCDAm's command and control efforts, the creation of protected areas gained momentum in the mid-2000s. From 2004 through 2009, the area covered by conservation units of integral protection and sustainable use in the Legal Amazon increased by over 520,000 km2. By the end of the decade, approximately 43 per cent of Legal Amazon territory was under protection as either conservation units or indigenous lands.
3.2. 2008: Targeting policy and enforcing the law
A combination of institutional changes implemented in late 2007 and throughout 2008 marks the second policy turning point. First, the passing of Presidential Decree 6,321 in December 2007 established the legal basis for singling out municipalities with intense deforestation activity and taking differentiated action towards them. Selected annually based on their recent deforestation history, these municipalities were classified as in need of priority action to prevent, monitor and combat illegal deforestation.Footnote 4 Any Legal Amazon municipality could be added to the list of ‘priority municipalities’. Exiting this list was conditioned upon a significant reduction of deforestation. Issued in January 2008, MMA Ordinance 28 listed the first 36 priority municipalities.
Secondly, law enforcement in the Amazon gained important legal support with the passing of Presidential Decree 6,514 in July 2008. The decree reestablished directives for the investigation and penalization of environmental infractions, determining the administrative processes for the application of sanctions in more detail than had been previously incorporated in legislation. This led to an increase in the clarity and speed of such processes. Moreover, the decree regulated the use of both existing and new instruments for the punishment of environmental crimes, including fines, embargoes, seizure and destruction of production goods and material, and arrest. Overall, these measures brought greater robustness and regulatory stability to the administrative processes for the investigation and penalization of environmental infractions.
Finally, a novel approach towards the concession of rural credit was adopted to restrict financial resources for those who did not abide by environmental law. National Monetary Council (CMN) Resolution 3,545, approved in February 2008, conditioned the concession of rural credit in the Amazon Biome upon presentation of proof of borrowers' compliance with environmental legislation and legitimacy of land claims. All private and public banks, as well as all credit cooperatives, were to implement the resolution's conditions obligatorily starting in July 2008.
Both 2004 and 2008 policy turning points coincide with subsequent decreases in the Amazon deforestation rate (see figure 1). This pattern suggests that conservation policies introduced starting in 2004 and 2008 helped curb deforestation in the second half of the 2000s. Separating the effects of conservation policies from those of agricultural commodity prices and other potential drivers of the deforestation slowdown, however, remains an empirical challenge.
4. Conceptual framework
The model presented in the online Appendix available at http://journals.cambridge.org/EDE describes a situation in which a farmer seeking to increase his agricultural production may do so by expanding farmland beyond the limits of his original landholding. It therefore focuses on the extensive margin of agricultural production. In particular, the model shows how conservation policies may influence the farmer's choice of optimal farmland size, as well as his response to changes in agricultural output prices.
The model and its implications are discussed in detail in section A of the online Appendix. Here, we focus on two key implications that guide our empirical investigation of the relationship between agricultural commodity prices, conservation policies and deforestation. First, the model states that agricultural output prices must be included in the analysis of the effects of conservation policies on deforestation. Because variations in output prices affect incentives to clear forest areas, the observed effectiveness of the policy will also vary with agricultural prices. In particular, if a new set of policy measures is implemented in a period of decreasing agricultural prices, it may not be possible to capture its effects until prices recover. This is one of the empirical challenges we face when estimating the relative contribution of prices and policies to the recent deforestation slowdown. We must therefore control for agricultural output prices to better identify the policy impact.Footnote 5
Secondly, the model predicts that the effect of conservation policies is influenced not only by agricultural output prices, but also by the relative tightness of land constraints. The smaller the land area that is legally available for use in agriculture within a municipality, the tighter the land constraint faced by farmers and, thus, the larger the price range within which we observe deforestation in that municipality. Hence, we should explore the tightness of land constraints within our empirical setup as a means of introducing cross-sectional variation in response to policy.
Although there are no available data that fully characterize the extent to which the land constraint is binding at the municipality level, the model suggests a way to proxy for it – by calculating the ratio between land area that is not legally available for use in agricultural production within a municipality and total municipal land area. This variable depends on the municipality land endowment, a relatively fixed or slow-moving municipality feature. This proxy is valid because, for a given municipality, the greater the calculated ratio, the smaller the relative land area that is legally available for use in agricultural production, and the tighter the relative municipal constraint. Section 5.3 discusses this variable in detail.Footnote 6
5. Data and descriptive statistics
Our analysis is based on a municipality-by-year panel data set covering the 2002 through 2009 period. The sample includes municipalities located in the Legal Amazon states of Amazonas, Mato Grosso, Pará and Rondônia. As variation in forest cover is required for the normalization of our main dependent variable (normalized annual deforestation increment), the sample is restricted to municipalities that portray such variation in the sample period. The final sample comprises 380 municipalities.
5.1. Deforestation
Deforestation data are built from satellite imagery that is processed at the municipality level and publicly released by INPE's Project for Monitoring Deforestation in the Legal Amazon (PRODES). We define deforestation as the annual deforestation increment – the area of forest cleared over the 12 months leading up to August of a given year. The annual deforestation increment of year t therefore measures the area, in km2, deforested between 1 August of t − 1 and 31 July of t.
Cloud coverage during the period of remote sensing may limit the satellite's capability to detect land cover patterns, and thus may require imagery to be produced at a different time. As a result, image records used to calculate deforestation increments for any given municipality over consecutive years may span from less to more than 12 months. We include variables indicating cloud coverage and unobservable areas, both made publicly available by PRODES/INPE, in all regressions to control for measurement error.
Sample municipalities exhibit substantial cross-sectional variation in deforestation increment due to heterogeneity in municipality size. We therefore use a normalized measure of the annual deforestation increment to ensure that our analysis considers only relative variations in deforestation increments within municipalities. In doing so, we also address the second empirical implication of our model, which establishes that
 $\overline{T}$
is a municipality-specific measure of land constraint, as the normalization takes into account the relative nature of
$\overline{T}$
is a municipality-specific measure of land constraint, as the normalization takes into account the relative nature of
 $\overline{T}$
. The variable is constructed according to the following expression:
$\overline{T}$
. The variable is constructed according to the following expression:
 $$D_{it}= \displaystyle{{ADI_{it}-\overline{ADI}_{it}} \over {sd\lpar ADI_{it}\rpar }}$$
where D
it
is the normalized annual deforestation increment for municipality i and year t; ADI
it
is the annual deforestation increment measured in municipality i between 1 August of t − 1 and 31 July t; and
 $\overline{ADI}_{it}$
and sd(ADI
it
) are, respectively, the mean and standard deviation of the annual deforestation increment calculated for each i over the 2002 through 2009 period. The variable ADI
it
replaces D
it
in robustness checks to test whether results are driven by the normalization of deforestation increments.
$\overline{ADI}_{it}$
and sd(ADI
it
) are, respectively, the mean and standard deviation of the annual deforestation increment calculated for each i over the 2002 through 2009 period. The variable ADI
it
replaces D
it
in robustness checks to test whether results are driven by the normalization of deforestation increments.
5.2. Agricultural output prices
Agricultural output prices are endogenous to local agricultural production. Figure B in the online Appendix shows that crop prices collected at the Agriculture and Supply Secretariat of the State of Paraná (SEAB-PR) are highly correlated with local crop prices averaged across sample municipalities.Footnote 7 , Footnote 8 Hence, we use the Paraná price series as exogenous indicators of local market conditions within our empirical context. The set of commodities includes beef cattle, soybean, cassava, rice, corn and sugarcane.Footnote 9
We use the Paraná price series to build two variables of interest. The first of these variables, an annual index of crop prices, is constructed in three steps. In step one, we construct nominal annual price series by averaging nominal monthly price series for each calendar year and culture. Annual prices are deflated to year 2000 Brazilian Reais and are expressed as an index with base year 2000.
In step two, we calculate a weighted real price for each of the crops according to the following expression:
 $$PPA_{itc}=PP_{tc}*{A}_{ic\comma 2000-2001}$$
where PPA itc is the weighted real price of crop c in municipality i and year t; PP tc is the Paraná-based real price of crop c in year t expressed as the index with base year 2000; and A ic,2000–2001 is the share of municipal area used as farmland for crop c in municipality i averaged over the 2000 through 2001 period. This latter term captures the relative importance of crop c within municipality i's crop production in the years immediately preceding the sample period. It thus serves as a municipality-specific weight that introduces cross-sectional variation in the commodity price series.
In the third and final step, we use principal component analysis on the weighted real crop prices to derive the annual index of crop prices. This technique allows the price variations that are common to the five selected crops to be represented in a single measure. The resulting index of crop prices captures the first principal component of the five weighted real prices (see table A in the online Appendix for descriptive statistics). The first principal component explains approximately 38 per cent of the variation in the series, driven mostly by soybean, rice and corn. As the index maximizes the price variance captured by our variable of interest, it represents a more comprehensive measure of the agricultural output price scenario within our empirical setup than the individual prices themselves.
The second variable of interest is an annual index of cattle prices, which is derived analogously to PPA itc in equation (1). However, as annual data on land pasture are not available, the index uses the ratio of heads of cattle to municipal area in municipality i averaged over the 2000 through 2001 period as the municipality-specific weight A ci,2000–2001.
The use of the annual indices of agricultural prices addresses our model's first empirical implication, which establishes that agricultural output prices should be included in conservation policy evaluation.
5.3. Policies
Two key elements guide the construction of our policy variable. First, the two policy turning points, which triggered significant changes to Brazilian conservation policy. We interpret these changes as discontinuous increases in policy stringency – one occurring in 2004 and the other in 2008 – that ultimately increased the cost of deforestation. Secondly, how tight farmers are within their landholdings. According to our conceptual framework, we assume that conservation policies are binding when optimal farmland size exceeds that of the farmer's landholding. If all farmers (and their respective landholdings) operating within a municipality are aggregated, the model's reasoning can be extended to the municipal level. Conservation policies should be binding, and thus potentially effective, in municipalities where agricultural land constraints are tight.
In light of these two elements, we construct policy variables based on interactions between: (i) the 2004 and 2008 turning points, represented by the dummy variables Post2004 = 1(year > 2004) and Post2008 = 1(year > 2008); and (ii) a proxy for the tightness of municipal land constraints, which introduces cross-sectional variation in our policy variables. Since deforestation in the Brazilian Amazon is measured within the 12-month window leading up to August of each year, the policy variables are constructed to match the timing of changes to environmental regulations starting in the second semester of 2004 (2008).
We build our main proxy for the tightness of municipal land constraints based on our conceptual model's empirical implications (see section 4). This proxy measures the land area that is not legally available for agricultural production as a share of total municipal land area. Essentially, this proxy captures how constrained farmers in a given municipality actually are. If the area they can legally deforest for production is relatively small, land constraints are tight. In this case, farmers have a smaller area within which to legally expand production in response to agricultural output price increases, and are thus more likely to illegally deforest when agricultural prices are high. Hence, the tighter the municipal land constraint, the greater the chance that conservation policies are binding in a context in which these policies increase the cost of illegally clearing forest area.
We use data from the 2006 Brazilian Agricultural Census to estimate the tightness of municipal land constraints in our sample.Footnote 10 We are interested in measuring tightness as defined below:
 $${Tight}_{i}= \displaystyle{{{Vegetation}_{i} + {LR}_{i} + {APP}_{i} + {Unsuitable}_{i}} \over {{MunicipalArea}_{i} - {Hydro}_{i}}}$$
where Tight i is the tightness of the land constraint in municipality i. Figure C in the online Appendix provides a graphical representation of the variables used to define the proxy Tight i in equation (2). Vegetation i is the total area covered by native vegetation in public lands, which includes territory under protection as conservation units or indigenous lands. LR i is the total area maintained as Legal Reserve inside private properties, while APP i is total Area of Permanent Protection inside private properties in municipality i.Footnote 11 , Footnote 12 Unsuitable i is the total area that is unfit for agricultural production inside private properties, such as degraded land, constructions and land that is not viable for agricultural use. MunicipalArea i is the total area of municipality i. Hydro i is the total area covered by hydrographic features in municipality i. Note that the numerator measures the total area that is unavailable for agricultural production, be it because it is illegal to deforest these areas, or because these areas are unfit for agricultural use. Thus, Tight i measures the share of land that is not legally available for use in agricultural production in each municipality. The larger the value of Tight i , the smaller the relative size of legally available land, the tighter the municipal land constraint.
Data limitations, however, prevent us from constructing the proxy for tightness of land constraint as stated in equation (2). In particular, Vegetation i is not observed in the Agricultural Census. In practice, we construct the variable as follows:
 $$Tight_{i}= \displaystyle{{{\matrix{ \lpar MunicipalArea_{i} - Hydro_{i} - Landholding_{i}\rpar \cr + \lpar LR_{i} + APP_{i} + Unsuitable_{i}\rpar \cr } } } \over {MunicipalArea_{i} - Hydro_{i}}} $$
where Landholding i is the total area of private properties in municipality i; and all other variables are defined as in equation (2). Here, the area covered by native vegetation is measured as the difference between total municipal land area and the total area of private landholdings. Because Legal Reserves, Areas of Permanent Protection and areas unfit for agricultural use – all of which increase the tightness of land constraints – refer to areas within private landholdings, we must add them back in our numerator. Figure C in the online Appendix shows that equations (2) and (3) are indeed equivalent in terms of capturing the relative size of the land constraint.
The final policy variables are given by Tight i *Post2004 and Tight i *Post2008 in main specifications. It should be noted that Tight i is built from either fixed or slow-moving variables at the municipality level. The interaction of Tight i with the policy turning points thus results in policy variables that exhibit sharp time and cross-sectional exogenous variation in our municipality-by-year panel. We argue that, conditioned upon high-frequency variation in market forces, municipality fixed characteristics, municipality-specific time trends and common time trends, the variation captured by our policy variables should be orthogonal to any latent determinant of deforestation in our empirical setting. This hypothesis is consistent with recent studies that acknowledge the importance of considering location in policy planning to help predict heterogeneous effects of policy on deforestation. Such studies also assume impacts vary by location due to differences in baseline deforestation that are driven by location-specific characteristics, such as Pfaff and Robalino (Reference Pfaff and Robalino2012).
6. Empirical model
Our empirical strategy follows a fixed-effects model based on a panel of annual data at the municipality level. The benchmark specification is defined by:
 $$\eqalign{D_{it} = & \alpha_{i} + \phi_{t} + M_{it}^{\prime}\beta_{1} + \beta_{2}P_{i\comma t-1} + \cr & \beta_{3}\lpar Tight_{i} \ast Post2004\rpar + \beta_{4}\lpar Tight_{i} \ast Post2008\rpar + X_{it}^{\prime}\beta_{5} + \epsilon_{it}} $$
where D it is the normalized deforestation increment in municipality i between the 1 August of t − 1 and 31 July of t. The first two terms on the right-hand side of model (4) are municipality and year fixed effects that control for unobservable fixed municipality characteristics and common time trends, respectively. To strengthen the control for municipality-specific time trends, we introduce a separate time trend for each municipality in the sample, M it .
The term P i, t−1 includes lagged values for both the annual index of crop prices and the cattle price index, as defined in section 5.2. We use lagged price indices to account for the timing of agricultural production in the Legal Amazon. The regional dry season usually lasts from June through September. Crops are sown from October through December, and harvested from January through May of the following year. We assume that, aiming at maximizing their expected end-of-season profits, farmers use prices observed during the early months of t − 1 to decide the size of the area to be sown and harvested starting in mid-t − 1. Prices in t − 1 should thus be associated with forest areas cleared between August of t − 1 and July of t. We also include the cattle price index calculated for the first six months of t as an additional control to account for potential cattle ranching cycles. This issue is further discussed in section 7.1.
As P i, t−1 is based on an interaction between price trends and municipality farmland before 2002, the coefficient β2 captures the exogenous effect of variations in the price indices on the municipal deforestation increment from 2002 through 2009. The policy variables Tight i *Post2004 and Tight i *Post2008 absorb the remaining within-municipality variation in the deforestation increment between the years before 2004 (or, 2008) and those afterwards. The interaction introduces cross-sectional heterogeneity in tightness of land constraints to address our model's implication that conservation policies will only exert an effect over farmers for whom the land constraint is binding.
Our empirical model relies on the identification hypothesis that β3 and β4 capture the effects of increases in policy stringency on deforestation once agricultural commodity prices and municipality time trends have been controlled for. The observed variation in Tight i across municipalities gives us a baseline for comparison among municipalities that are more or less prone to respond to variations in conservation policy stringency from either 2004 or 2008 onwards. Formally, model (4) tests whether, after the 2004 and 2008 policy turning points, deforestation declined relatively more in municipalities where land constraint was tighter, conditional not only on agricultural output price trends at the municipality level, but also on common and municipality-specific time trends, as well as on municipality fixed effects.
We also investigate the impact of interactions between the annual index of crop prices and policy variables to test whether policy influences the relationship between agricultural prices and deforestation.
All regressions include a vector of control variables, X it , containing municipality-level information on cloud coverage and unobservable areas during the period of remote sensing. Note that several potential determinants of deforestation discussed in the literature (population, infrastructure, roads, climate, soil quality, among others – see section 2) exhibit little to no annual variation at the municipality level. We argue that their impacts on deforestation are captured by the combination of our full set of municipality and year fixed effects with municipality-specific time trends. Finally, robust standard errors are clustered at the municipality level to account for serial correlation in error terms.
7. Deforestation slowdown: prices or policies?
This section presents our three main sets of empirical results. First, we discuss the effects of crop and cattle prices on deforestation. Secondly, we test whether conservation policies have affected the pace of forest clearings in the Legal Amazon, controlling for agricultural output prices and municipality-specific time trends. Finally, we use regression-based counterfactual simulations to quantify the contribution of conservation policies to the 2000s deforestation slowdown in terms of avoided forest clearings and associated CO2 emissions.
7.1. The effect of crop and cattle prices on deforestation
Table 1 presents the relationship between deforestation and both crop and cattle price indices (henceforth referred to as crop prices and cattle prices, respectively). Column 1 shows a positive and robust relationship between crop prices and deforestation. The estimated coefficient 0.229 indicates that a one standard deviation increase of this variable leads to a 0.31 standard deviation increase in municipality deforestation (the standard deviation of the price index is 1.37). We also find a heterogeneous relationship between cattle prices and deforestation in column 1. Current variations in cattle prices are negative and significantly associated with deforestation, while the relationship between lagged prices and deforestation is positive and significant.
Table 1. The effect of crop and cattle prices on deforestation
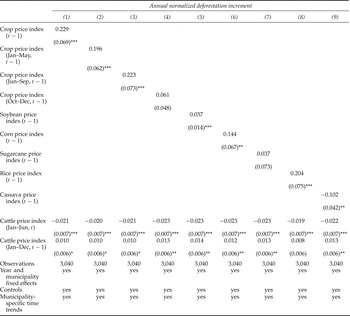
Notes: Analysis is based on a municipality-by-year panel data set covering the 2002 through 2009 period. Sample includes the 380 municipalities located in the Legal Amazon states of Amazonas, Mato Grosso, Pará, and Rondônia, which exhibited variation in forest cover during the sample period. Dependent variable is the annual normalized deforestation increment at the municipality level. All regressions include year and municipality fixed effects, municipality time trends, and controls for cloud cover and unobservable areas. Robust standard errors are clustered at the municipality level to account for serial correlation in error terms. Significance: ***p < 0.01; **p < 0.05; * p < 0.1.
This pattern can be explained by the fact that cattle are both capital and consumption goods. On the one hand, higher prices, when expected to be persistent, create an incentive for expanding herd size so as to capitalize on future gains. On the other hand, a temporary price shock, such as a positive demand shock, may lead producers to increase slaughter rates and thereby decrease herd size. Section C.1 of the online Appendix discusses this further.
In columns 2 through 4, we explore the relationship between deforestation and the timing of the variations in crop prices. In column 2, we use the annual index of crop prices calculated only for January through May of t − 1. This variable captures the variation in crop prices before the dry season. In column 3, we include the index calculated only for the t − 1 dry season months, June through September. Finally, in column 4, index calculation is restricted to the t − 1 sowing period, October through December. We find that deforestation is positively and significantly associated with variation in prices during only the first two periods (columns 2 and 3). This result is consistent with our hypothesis that farmers make decisions about land use and forest clearings before the sowing period. In section 8, we discuss the potential caveats associated with this result and perform robustness checks. Placebo tests confirm that we are accurately capturing the timing of the relationship between crop prices and deforestation.
Finally, the last columns of table 1 use the culture-specific crop price indices defined in equation (1) as regressors. We find positive and robust associations between deforestation and soybean, rice and corn prices. There is no significant relationship between deforestation and sugarcane prices, while the coefficient for cassava prices is negative and robust.Footnote 13
7.2. The effect of policies on deforestation
In column 1 of table 2, we regress the normalized deforestation increment on the policy variables Tight i *Post2004 and Tight i *Post2008, conditional on agricultural prices and the full set of fixed effects. We find a significant drop in deforestation associated with the 2004 policy turning point, and a less significant, but positive, association between deforestation and the 2008 turning point. In column 2, we control for municipality-specific time trends. As a result, we see a sharp increase in the magnitude of the effect associated with the 2004 turning point. The coefficient of the 2008 policy variable is now also negative and statistically significant. Both effects are large in magnitude – for a municipality at the median of the distribution of Tight i , the estimated drop in deforestation associated with the 2004 policy turning point is approximately 1.2 standard deviation points of the deforestation increment, while the 2008 policy turning point is associated with an impact of 0.7 standard deviation points. Note that the possibility of there being a localized trend of growing deforestation (such as the expansion of the agricultural frontier), particularly after 2008 as commodity prices increased, reinforces the case for including the municipality-specific time trends. These controls ensure the separation of the effect of policies from that of prices, particularly during the period of recovering agricultural prices. The stronger policy effects conditional upon the inclusion of municipality-specific time trends are therefore to be expected.
Table 2. The effect of conservation policies on deforestation

Notes: Analysis is based on a municipality-by-year panel data set covering the 2002 through 2009 period. Sample includes the 380 municipalities located in the Legal Amazon states of Amazonas, Mato Grosso, Pará and Rondônia, which exhibited variation in forest cover during the sample period. Dependent variable is the annual normalized deforestation increment at the municipality level. All regressions include year and municipality fixed effects, municipality time trends, and controls for unobservable areas and cloud cover. Robust standard errors are clustered at the municipality level to account for serial correlation in error terms. Significance: ***p < 0.01, **p < 0.05, * p < 0.1.
In the following columns of table 2, we add interactions between policy variables and crop prices. We are now controlling for different sources of price variations and potential heterogeneity in policy effectiveness. In short, we allow policies to affect deforestation responses to prices, as implied by our model. Our conceptual framework suggests that policy stringency affects the relationship between prices and land use by lowering the elasticity of optimal farmland size with respect to prices whenever land constraints are tight. Column 5 shows the results for our most complete specification. Indeed, we find negative coefficients in the triple interactions between Tight i , Post2004 (or Post2008), and the crop price index. However, the statistical significance of these results does not hold.
Overall, the results obtained thus far indicate that the conservation policies adopted beginning in 2004 and 2008 appear to have been effective in restraining deforestation in the Legal Amazon. Robustness checks in section 8 provide further support for this result.
7.3. Counterfactual simulations
We use counterfactual simulations to quantify the contribution of conservation policies to the 2000s Amazon deforestation slowdown in terms of avoided forest clearings and associated CO2 emissions. Our baseline specification is the one presented in column 5 of table 2, which includes the full set of fixed effects, municipality-specific time trends and price interactions. This specification delivers the predicted trend in deforestation increment for each sample municipality, as defined by:
 $$\eqalign{\widehat{D}_{it} & = \widehat{\alpha}_{i} + \widehat{\phi}_{t} +M_{it}^{\prime}\widehat{\beta_{1}} + \widehat{\beta}_{2} P_{i\comma t-1} + \widehat{\beta}_{3}\lpar Tight_{i} \ast Post2004\rpar \cr & \quad + \widehat{\beta}_{4}\lpar Tight_{i} \ast Post2008\rpar + X_{it}^{\prime}\widehat{\beta}_{5} + I_{it}^{\prime}\widehat{\beta}_{6}} $$
where
 $\widehat{D}_{it}$
is the predicted deforestation increment, calculated by using the estimated coefficients represented by the hatted parameters. The term I
it
represents the full set of interactions between prices and policies. Given the hatted parameters, we are able to recalculate each
$\widehat{D}_{it}$
is the predicted deforestation increment, calculated by using the estimated coefficients represented by the hatted parameters. The term I
it
represents the full set of interactions between prices and policies. Given the hatted parameters, we are able to recalculate each
 $\widehat{D}_{it}$
under the alternative condition Post2004 = 0 and Post2008 = 0. This calculation delivers the predicted municipality trend in annual deforestation increment in a hypothetical scenario in which conservation policies introduced starting in 2004 and 2008 were not implemented. We then accumulate
$\widehat{D}_{it}$
under the alternative condition Post2004 = 0 and Post2008 = 0. This calculation delivers the predicted municipality trend in annual deforestation increment in a hypothetical scenario in which conservation policies introduced starting in 2004 and 2008 were not implemented. We then accumulate
 $\widehat{D}_{it}$
across all 380 sample municipalities and all sample years to calculate total predicted deforestation in the absence of these policies.
$\widehat{D}_{it}$
across all 380 sample municipalities and all sample years to calculate total predicted deforestation in the absence of these policies.
Table 3 shows the total observed deforestation trend for the 2002 through 2009 period, as well as the counterfactual trend for the hypothetical scenario described above. Observed deforestation in sample municipalities totaled 57,100 km2 from 2005 through 2009. We estimate that, had the set of conservation policies introduced beginning in 2004 and 2008 not been adopted, this total would have equaled 130,300 km2. Results therefore suggest that conservation policies avoided over 73,000 km2 of forest clearings, or 56 per cent of the deforestation that would have occurred from 2005 through 2009 in the absence of such policies. In a simple first step towards cost-benefit analysis, we estimate that the preserved forest area is equivalent to 2.7 billion tonnes of stored CO2, and is valued at US $ 13.2 b.Footnote 14
Table 3. Counterfactual simulations - observed and predicted deforestation

Notes: Counterfactual simulation is based on model (5) and uses the specification presented in column 5 of table 2, which includes the full set of fixed effects, specific time trends and price interactions. Analysis is based on a municipality-by-year panel data set covering the 2002 through 2009 period. Sample includes the 380 municipalities located in the Legal Amazon states of Amazonas, Mato Grosso, Pará and Rondônia, which exhibited variation in forest cover during the sample period. Regressions include year and municipality fixed effects, municipality time trends, and controls for unobservable areas and cloud cover. Robust standard errors are clustered at the municipality level to account for serial correlation in error terms.
Figure D in the online Appendix plots observed and simulated deforestation trends over the period of interest. The dotted lines give a 95 per cent confidence interval to the simulated trend. The simulation indicates that deforestation would have peaked in 2005 if the conservation policies associated with the 2004 turning point had not been implemented. This is consistent with the peak in crop prices observed during the first half of 2004, which could have led to more forest clearings during that year's sowing period and thus raised the accumulated deforestation increment from August 2004 through July 2005. Moreover, the deforestation trend would have bent upward beginning in 2007 in the absence of the conservation policies. This suggests that deforestation would have increased with the recovery of agricultural prices.
7.4. Impacts on population, GDP and agricultural production
In this section we examine whether the conservation policies associated with the two turning points are correlated with other economic variables at the municipality level, such as population, municipal GDP per capita and agricultural production. We follow our benchmark model (4), but replace the deforestation increments by the following alternative outcome variables: (i) log of municipality population; (ii) log of GDP per capita; (iii) ratio of sowed area to municipality area; (iv) total crop production in 1,000 tonnes; and (v) log of municipality cattle herd.
Table B in the online Appendix presents the results. We find no significant impacts on population trends (column 1), and a positive effect on municipal GDP per capita associated with the 2004 policy turning point (column 2). These results are qualitatively important since they suggest that there has not been any important trade-off between recent conservation policies and local development in the Brazilian Amazon. We further examine this view by focusing on the agricultural sector in the remaining columns. In column 3 we find a negative relationship between relative sowed area and the 2004 policy turning point. The policy change is associated with a decline in the ratio of sowed to municipal area of 2.1 percentage points. Yet, column 4 suggests there is no significant correlation between the 2004 policy turning point and municipality crop production, although the point estimate is also negative. The 2008 policy turning point appears to have had no significant impact on the crop farming sector. For cattle ranching, the 2008 turning point is associated with an increase in the size of municipal cattle herd, but the effect is small considering sample averages. Overall, these results support the view that the deforestation slowdown in the Amazon has occurred in tandem with no major downturns in the agricultural sector.
8. Caveats and robustness checks
The empirical strategy behind model (4) relies on two important identification cornerstones. First, that our strategy adequately controls for direct price effects and municipality-specific time trends. Thus far, our analysis has been based on the assumption that farmers take spot prices before the sowing period to choose the season's farmland size and the associated extent of forest clearings. However, whether this timing adequately represents farmers' real behavior in the Amazon region is still subject to further empirical investigation. In section D.1 of the online Appendix, we present placebo tests that help ensure that we are indeed capturing the relevant relationship between price variations and deforestation.
Secondly, that we adequately capture the cross-sectional variation in land constraints at the municipality level. Although not directly observed, the tightness of land constraints was proxied in our analysis by the ratio between the land area that is not legally available to farmers for production and total municipal area. However, detailed information on landholding sizes is available only from 2006 Brazilian Agricultural Census data, which were collected after the 2004 policy turning point had occurred. Although this proxy depends on the municipality land endowment, a relatively fixed or slow-moving municipality feature, it is not totally free from endogenous variation due to policy effects. We address this potential source of concern by using the alternative proxies for the tightness of municipal land constraints suggested by our conceptual framework. As shown in section D.2 of the online Appendix, these robustness checks provide qualitatively similar results in comparison to our main proxy variable.
9. Final comments
Overall, our results show that: (i) deforestation is indeed responsive to agricultural output prices; (ii) changes to conservation policies implemented beginning in 2004 and 2008 significantly contributed to the curbing of deforestation, even after controlling for a variety of price effects; and (iii) counterfactual simulations suggest that the policies beginning in 2004 and 2008 avoided substantial Amazon deforestation from 2005 through 2009.


