


Residential proximity to environmental toxic chemicals may be associated with adverse health effects.Reference Brender, Maantay and Chakraborty 1 Natural disasters, including storms, floods, and earthquakes, are known to exacerbate risks of hazardous environmental exposures and adverse health consequences.Reference Wisner and Adams 2 – Reference Ratnapradipa, Conder, Ruffing and White 5 Lead has long been a high priority for public health interventions because of its known severe human toxicity, especially for children. 6
After a tornado caused severe damage in a former lead mining community, practicing pediatricians and public health officials began surveillance for suspected toxic exposure of children resulting from dispersal of underground lead by disruption of trees and building foundations (R.K.K. written communication). 7 – 11 The possibility that lead exposure from an environmental source complicated a recent natural disaster raised questions regarding the extent of health risks at former lead-related industrial sites elsewhere. The present study was performed to determine the proportion of previously identified lead industrial sites in populated urban locationsReference Young 12 – Reference Young and Eisler 14 that are at high risk for dispersal by natural disasters.
Methods
Locations of former lead-related industrial sites were identified that coincide with high population-dense urban areas and with high-risk locations for natural disasters, including tornados, floods, hurricanes, and earthquakes. Natural disasters occurring at these sites were regarded as likely to disperse environmental toxic chemicals and increase the potential for human exposure.
Lead Smelting Plants
Sites of secondary lead smelting plants (historically involved in recovery of lead from scrap) at 623 locations in the United States had been previously identified from industrial directories.Reference Eckel, Rabinowitz and Foster 12 Exact addresses for 232 of these sites were determined from local historical records,Reference Young 13 , Reference Young and Eisler 14 and this published data set was used as a convenience sample for the present study. A geographic information system (ArcGIS, ESRI) was used as a reference for street addresses. For addresses that were not recognized, recent street maps were consulted, and adjacent recognizable addresses were used to approximate the location. One site was excluded because its location overlapped with another site, leaving 231 for analysis. Although most of these former industrial sites are no longer in operation, soil at many of the sites has been confirmed to contain unremediated toxic levels of lead.Reference Eckel, Rabinowitz and Foster 12 – Reference Young and Eisler 14
Urban Locations
Lead smelting plants were included for further analysis as potential sources of human exposure if they were located less than 1 mile from concentrated populations. These included urbanized areas (census blocks with >1000 people/sq mile) or urban clusters (census blocks with >500 people/sq mile adjacent to urbanized areas). 15 Locations of urban areas were visualized on a geographic information system (ArcGIS, ESRI) and compared with locations of former lead smelting plants.
Natural Disasters
Areas at high risk for flooding were categorized on the basis of historical records as having a 1% annual probability of flooding, with areas classified as either within or outside of the 100-year flood zone. 16 – 18 Historical hurricane records for coastal counties were used to determine hurricane risk areas in 6 categories, expressed as the total number of hurricanes involving the county in historical records through 2010. 19 Partial records of the paths of actual hurricane strikes were also obtained. 20
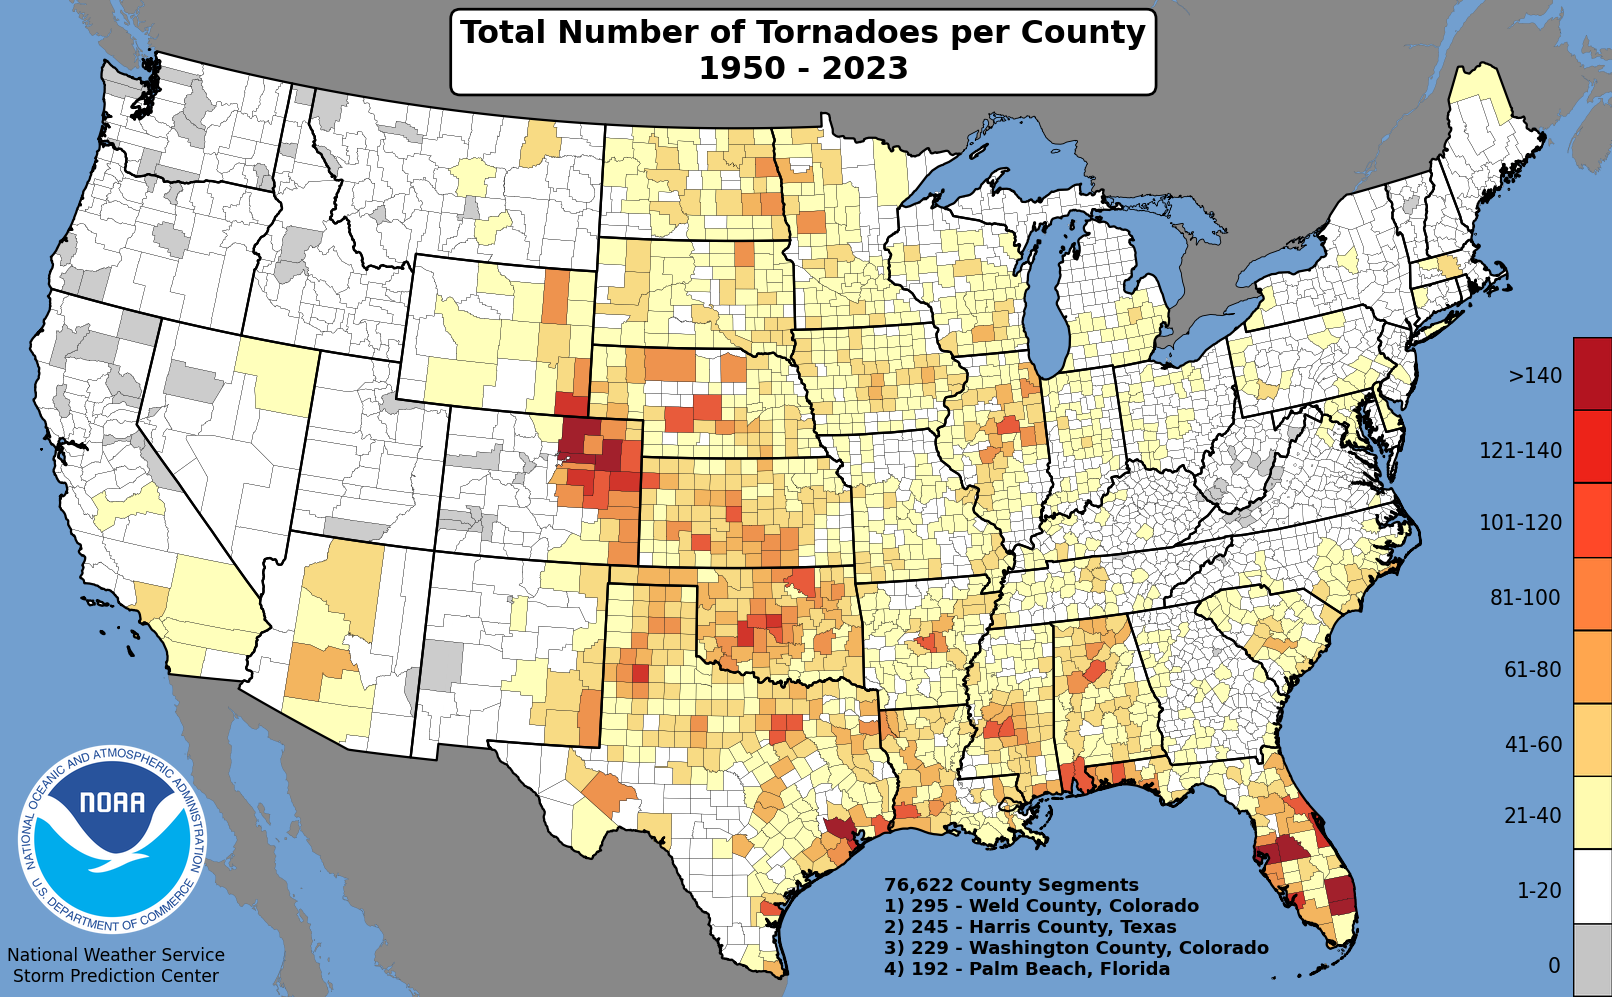
Tornado-risk area by county was expressed as the total number of tornado events per county between 1952 and 2010 in 8 categories. 21 Partial historical records of the paths of actual tornado strikes were also obtained. 22 For earthquakes, seismic hazards in 17 risk categories were expressed as peak ground acceleration as percent of gravity, with probabilities exceeding 2% in 50 years.Reference Petersen, Frankel and Harmsen 23
Disaster Risk for Each Smelting Site
For each type of natural disaster, maps of smelting plant sites in urban locations were overlapped with disaster risk categories. Relative risk categories were considered low for the lowest risk half of categories and high for the highest risk half of categories. This study of publicly available data with no identifiable subjects or interventions was considered exempt from review by the institutional review board for the protection of human subjects at State University of New York Upstate Medical University.
Results
Urban Locations
Among 231 lead smelting sites across the United States, 229 were located within or immediately adjacent to urban concentrations of population. The Table details the number of urban smelting sites according to their risk category for each type of natural disaster. Among the 229 smelting sites in urban locations, 39 (17%) coincided with 100-year flood hazard areas. These sites were located near coastal regions, lakes, or streams.
Table No. of Smelting Sites in Risk Categories for Each Type of Disaster

As an example, Figure 1 shows geographical detail for areas at high risk for flooding in the New York City Metropolitan area. Figure 2 shows national locations of former smelting sites at high risk for flooding. Although the geographic detail cannot be seen on a national map, locations with sites at high risk are indicated. Two smelting sites were located in coastal areas at high risk for frequent hurricane activity (Figure 3). Three smelting sites were located within a region at high risk for tornados (Figure 4). Earthquake risk was noted for 29 smelting sites (13%) in areas most vulnerable to damage along the West Coast (Figure 5).

Figure 1 Former Lead-Smelting Sites at Risk for Flooding Inside (Triangles) and Outside (Circles) the New York Metropolitan Region Flood Zone (Shading).

Figure 2 Former Lead Smelting Sites at High (Triangles) and Low (circles) Risk for Flooding Nationally. Overlapping location markers indicate multiple sites within the same city.

Figure 3 Former Lead Smelting Sites at High (Triangles) and Low (Circles) Risk for Hurricane Exposure. Hurricane high-risk areas are shaded. Overlapping location markers indicate multiple sites within the same city.

Figure 4 Former Lead Smelting Sites at High (Triangles) and Low (Circles) Risk for Tornado Exposure. Tornado high-risk areas are shaded. Overlapping location markers indicate multiple sites within the same city.

Figure 5 Former Lead Smelting Sites at High (Triangles) and Low (Circles) Risk for Earthquakes. Earthquake high-risk areas are shaded. Overlapping location markers indicate multiple sites within the same city.
Disaster Risk for Each Smelting Site
Of the total sample of 229 sites, 66 urban smelting sites (29%) were in areas at relatively high risk for natural disasters. Five sites were located in relatively high risk areas for 2 types of disasters, while 1 site was in the high-risk category for 3 types of disasters. States with urban sites at relatively high risk for natural disaster (number of sites) included California (15); Pennsylvania (14); New York (7); Missouri (6); Illinois (5); New Jersey (4); Kentucky (3); Florida, Oregon, and Ohio (2 each); and Indiana, Massachusetts, Rhode Island, Texas, Utah, and Washington (1 each).
Historical records showed that 10 smelting sites were in locations actually affected by natural disasters. One site was directly in the path of a tornado in Atlanta, Georgia, in March 2008. 24 In St Louis, Missouri, and East Saint Louis, Illinois, 4 sites were in the paths of tornadoes in 1896, 1927, 1959, and 2007. 25 , 26 During the Ohio River flood in March 1997, two sites in Louisville, Kentucky, and 2 sites in Cincinnati, Ohio, were directly affected. 27 , Reference Scott Jackson and Vivian 28 Hurricane Agnes in 1972 caused widespread flooding in Pennsylvania, including 1 site in Harrisburg. 29 , Reference Lyudmilov 30 Incomplete information is available on the extent of damages due to natural disasters, and additional sites may have been involved.
Discussion
Our approach to identifying risks may inform regional disaster preparedness hazard analysesReference Gamboa-Maldonado, Marshak, Sinclair, Montgomery and Dyjack 31 and provide an additional incentive for cleanup priorities for sites contaminated by lead or other toxic chemicals whose implications for human health are less well understood. 32 Knowledge of point source locations of concentrated toxic chemicals may guide post-disaster public health surveillance, potentially improving timeliness of interventions when warranted.Reference Wisner and Adams 2 – Reference Ratnapradipa, Conder, Ruffing and White 5
Natural disasters have the potential to exacerbate latent environmental hazards. Disruption of foundations under buildings may bring buried toxic material to the surface, and disruption of soil may uncover buried toxic deposits, even in areas that had toxic material covered in previous mitigation programs. In addition, wind or flooding may disperse exposed toxic material to downstream locations. As a result, human health effects of environmental hazards after disasters are difficult to predict. For example, soil lead actually declined in samples from 29 of 46 census tracts after hurricanes Katrina and Rita in New Orleans, with accompanying declines in blood lead levels in children.Reference Zahran, Mielke, Gonzales, Powell and Weiler 33 The fortunate decline in local lead exposures after hurricanes Katrina and Rita was attributed to flooding that deposited uncontaminated sediment and buried previous contamination. However, such favorable random effects cannot be depended on in future disasters. Facing uncertainty and lacking professional or public health guidance, a concerned neighborhood group in New York initiated its own environmental testing for toxic chemicals after Hurricane Sandy in 2012.Reference Barry, Searcey and Carreyrou 34
Limitations
The classification method used to identify high-risk areas was, we believe, an unbiased approach. It was designed for the present study to provide a single description of locations with historical levels of risk. The classification discriminated the top versus the lowest half of risk categories applied across various types of natural disasters, where each type of disaster has distinct measures of frequency and severity. Limitations of our data included the nonrepresentative convenience sample of smelting plants, the arbitrary criteria for the high-risk category of disaster locations, and the low frequency of high consequence events in the historical record common to all data on natural disasters.
Finally, it is important to note that former lead smelting plants at high risk for natural disaster are a convenience sample representing only a single toxic material. Other types of latent environmental hazards may have entirely different geographical distributions. To conduct a hazard analysis in a specific community, local evidence regarding risk of specific natural disasters, at a threshold set by local decision makers, must be matched with known locations of specific latent environmental hazards. To identify potential sources of contamination after an actual disaster, involved and damaged areas must be matched with known locations of specific latent environmental hazards.
Conclusions
The findings of our study serve to remind clinicians, clinical researchers, and public health officials that forgotten environmental hazards may remain hazardous in any community. Clinicians and public health officials are increasingly asked by the public for guidance in managing disaster-related environmental hazards.Reference Barry, Searcey and Carreyrou 34 Uncertainty about risks in disasters heightens disruptive public anxiety that increases difficulties in community responses and recovery.Reference Meredith, Eisenman and Tanielian 35 We believe that it is our professional and public responsibility to seek a better understanding of the risks of latent environmental hazards in disasters.
Acknowledgments
Myrna H. Hall, PhD, and Liyang Shao, provided invaluable advice and assistance with the geographical analysis.


