


Introduction
The Amundsen Sea sector is currently the dominant contributor to ice mass loss from the Antarctic ice sheet. Glaciers draining this sector have thinned and retreated dramatically in recent decades (e.g. Rignot et al. Reference Rignot, Mouginot, Morlighem, Seroussi and Scheuchl2014), probably in response to increased delivery of warm Circumpolar Deep Water that is melting ice shelves from beneath (Thoma et al. Reference Thoma, Jenkins, Holland and Jacobs2008, Jacobs et al. Reference Jacobs, Jenkins, Giulivi and Dutrieux2011). This has resulted in a negative mass balance for this sector of the ice sheet. Our understanding of how the ice sheet will respond to future environmental change is dependent upon reliable model predictions, which require knowledge of current ice mass loss.
An ice sheet shrinks when the loss of ice from flow across the grounding line is greater than the amount of surface accumulation through snowfall. Such mass change is associated with change in sea level because water is lost to the surrounding ocean through outward transport across the grounding line. In the Amundsen Sea Embayment (ASE; Fig. 1), ice discharge from the Pine Island and Thwaites glaciers has been increasing in recent years, and model predictions suggest that this rate of mass loss will increase in the coming decades (Joughin et al. Reference Joughin, Smith and Medley2014, Ritz et al. Reference Ritz, Edwards, Durand, Payne, Peyaud and Hindmarsh2015, DeConto & Pollard Reference DeConto and Pollard2016). However, a scarcity of records of snow accumulation in the region is limiting the reliability of predictions of future mass loss, and hence projections of sea level change (Medley et al. Reference Medley, Joughin, Smith, Das, Steig, Conway, Goginen, Lewis, Criscitiello, McConnell, van den Broeke, Lenaerts, Bromwich, Nicolas and Leuschen2014), because the surface mass balance of the ice sheet cannot be reliably determined while uncertainty surrounding the magnitude of surface accumulation remains high. Here in situ measurements of accumulation rate are reported for six sites across the ASE during 2016.
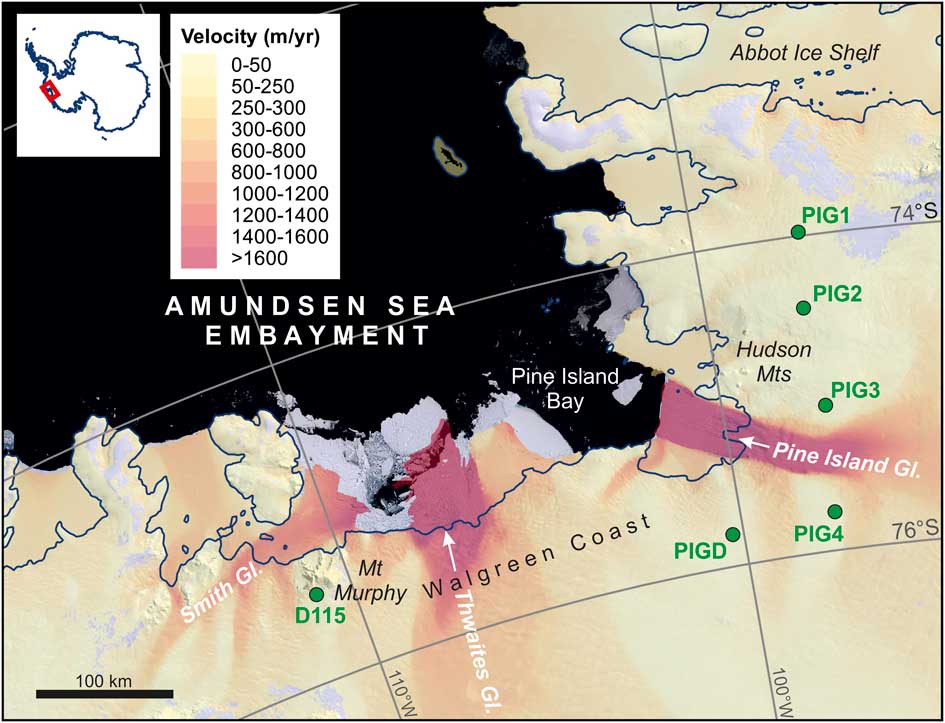
Fig. 1 Map of Amundsen Sea Embayment showing the locations of our field sites (green). Coloured background is ice velocity (Rignot et al. Reference Rignot, Mouginot and Scheuchl2011a, Reference Rignot, Mouginot and Scheuchl2011b), which highlights the major ice streams in the region and overlies imagery from the Landsat Image Mosaic of Antarctica. The dark blue line is the 2011 grounding line (Rignot et al. Reference Rignot, Mouginot and Scheuchl2011c).
Accumulation rates in the Amundsen Sea region
Despite the importance of quantifying ice volume change in the ASE for predicting future sea level change, there are few published in situ measurements of accumulation in the Pine Island–Thwaites glacier catchment. Dedicated drilling campaigns, such as the International Trans-Antarctic Scientific Expedition (ITASE), have increased our understanding of snow accumulation and climate variability over much of West Antarctica (Kaspari et al. Reference Kaspari, Mayewski, Dixon, Spikes, Sneed, Handley and Hamilton2004), while a series of ice cores drilled along the Ellsworth Land coast have captured variability in snow accumulation at the outer edges of the Pine Island Glacier catchment over the past 300 years (Thomas et al. Reference Thomas, Hosking, Tuckwell, Warren and Ludlow2015). However, to date, only three records of intermediate depth, drilled during December 2010–January 2011 (Medley et al. Reference Medley, Joughin, Smith, Das, Steig, Conway, Goginen, Lewis, Criscitiello, McConnell, van den Broeke, Lenaerts, Bromwich, Nicolas and Leuschen2014), are available from within the Pine Island–Thwaites catchment.
Ice core records, in conjunction with airborne radar, have been used to confirm that both the re-analysis data (Thomas & Bracegirdle Reference Thomas and Bracegirdle2015) and the Regional Atmospheric Climate Model (RACMO; Medley et al. Reference Medley, Joughin, Smith, Das, Steig, Conway, Goginen, Lewis, Criscitiello, McConnell, van den Broeke, Lenaerts, Bromwich, Nicolas and Leuschen2014, Lenaerts et al. Reference Lenaerts, Ligtenberg, Medley, van de Berg, Konrad, Nicolas, van Wessem, Trusel, Mulvaney, Tuckwell, Hogg and Thomas2017, Thomas et al. Reference Thomas, van Wessem, Roberts, Isaksson, Schlosser, Fudge, Vallelonga, Medley, Lenaerts, Bertler, van den Broeke, Dixon, Frezzotti, Stenni, Curran and Ekaykin2017) across West Antarctica are reliably capturing the spatiotemporal variability in snow accumulation. For the Pine Island–Thwaites catchment there is no significant trend in either measured or modelled snow accumulation between 1985 and 2009 (Medley et al. Reference Medley, Joughin, Smith, Das, Steig, Conway, Goginen, Lewis, Criscitiello, McConnell, van den Broeke, Lenaerts, Bromwich, Nicolas and Leuschen2014). This is consistent with observations from WAIS Divide (Banta et al. Reference Banta, McConnell, Frey, Bales and Taylor2008) and the central West Antarctic basin (Wang et al. Reference Wang, Thomas, Hou, Huai, Wu, Sun, Qi, Ding and Zhang2017), but contrasts with both the significant increases in snow accumulation observed on the Ellsworth Land coast (Thomas et al. Reference Thomas, Hosking, Tuckwell, Warren and Ludlow2015, Reference Thomas, van Wessem, Roberts, Isaksson, Schlosser, Fudge, Vallelonga, Medley, Lenaerts, Bertler, van den Broeke, Dixon, Frezzotti, Stenni, Curran and Ekaykin2017) and the opposing significant decreases in snow accumulation observed in western West Antarctica (Burgener et al. Reference Burgener, Rupper, Koenig, Forster, Christensen, Williams, Koutnik, Miège, Steig, Tingey, Keeler and Riley2013, Wang et al. Reference Wang, Thomas, Hou, Huai, Wu, Sun, Qi, Ding and Zhang2017) for the same period.
The temporal variability in accumulation within the Thwaites–Pine Island catchment is significant at annual scale (Medley et al. Reference Medley, Joughin, Das, Steig, Conway, Gogineni, Criscitiello, McConnell, Smith, van den Broeke, Lenaerts, Bromwich and Nicolas2013, fig. 3) and the spatial variability, as estimated by RACMO, is large (Lenaerts et al. Reference Lenaerts, Ligtenberg, Medley, van de Berg, Konrad, Nicolas, van Wessem, Trusel, Mulvaney, Tuckwell, Hogg and Thomas2017). Average snow accumulation at the outer edges of the catchment ranges from 200–300 mm water equivalent per year (w.e. yr-1), while values in excess of 1000 mm w.e. yr-1 are expected at the coast (Medley et al. Reference Medley, Joughin, Smith, Das, Steig, Conway, Goginen, Lewis, Criscitiello, McConnell, van den Broeke, Lenaerts, Bromwich, Nicolas and Leuschen2014). However, to date, all the in situ snow accumulation records used to evaluate these climate models have been drilled at elevations >1200 m above sea level (a.s.l.). A suite of in situ observations of snow accumulation from low elevation sites (i.e.<1200 m a.s.l.) on Pine Island Glacier and its tributaries was published recently (Morris et al. Reference Morris, Mulvaney, Arthern, Davies, Gurney, Lambert, De Rydt, Smith, Tuckwell and Winstrup2017); however, to our knowledge, none have been obtained from further afield including the areas to the north of Pine Island Glacier (Eights Coast) and west of 100.77° longitude along the Walgreen Coast, which includes Thwaites Glacier (Fig. 1). With increasing scientific interest in the region, particularly at sites near the grounding line, it is imperative that the annual snow accumulation at low elevations across the whole Pine Island–Thwaites glacier catchment is verified.
Methods
Six sites across the ASE (Fig. 1) were visited on two occasions, the first in January 2016 and the second in December 2016. The purpose of these visits was to service seismic stations of the UKANET seismic network near Pine Island Glacier (sites prefixed by ‘PIG’; Fig. 1), and to locate and raise equipment depoted in January 2016 at Mount Murphy (site D115; Fig. 1). All the UKANET sites are located within the catchment of Pine Island Glacier, whereas D115 is located on the western margin of the Thwaites–Haynes glacier catchment.
The seismic stations are powered by solar energy during the summer. At installation, the heights of the solar panels above the snow surface were recorded using a tape measure. At all sites, flags marking the station locations were visible above the ice sheet surface, although sometimes only just (Fig. 2a). Servicing entailed raising the seismometer back towards the surface via vertical shafts dug with shovels (Fig. 2b). By repeating the measurement of the solar panel height above (or below, following complete burial) the snow surface, the total depth of snow that had fallen during the period of c. 11 months between initial deployment and servicing could be determined.
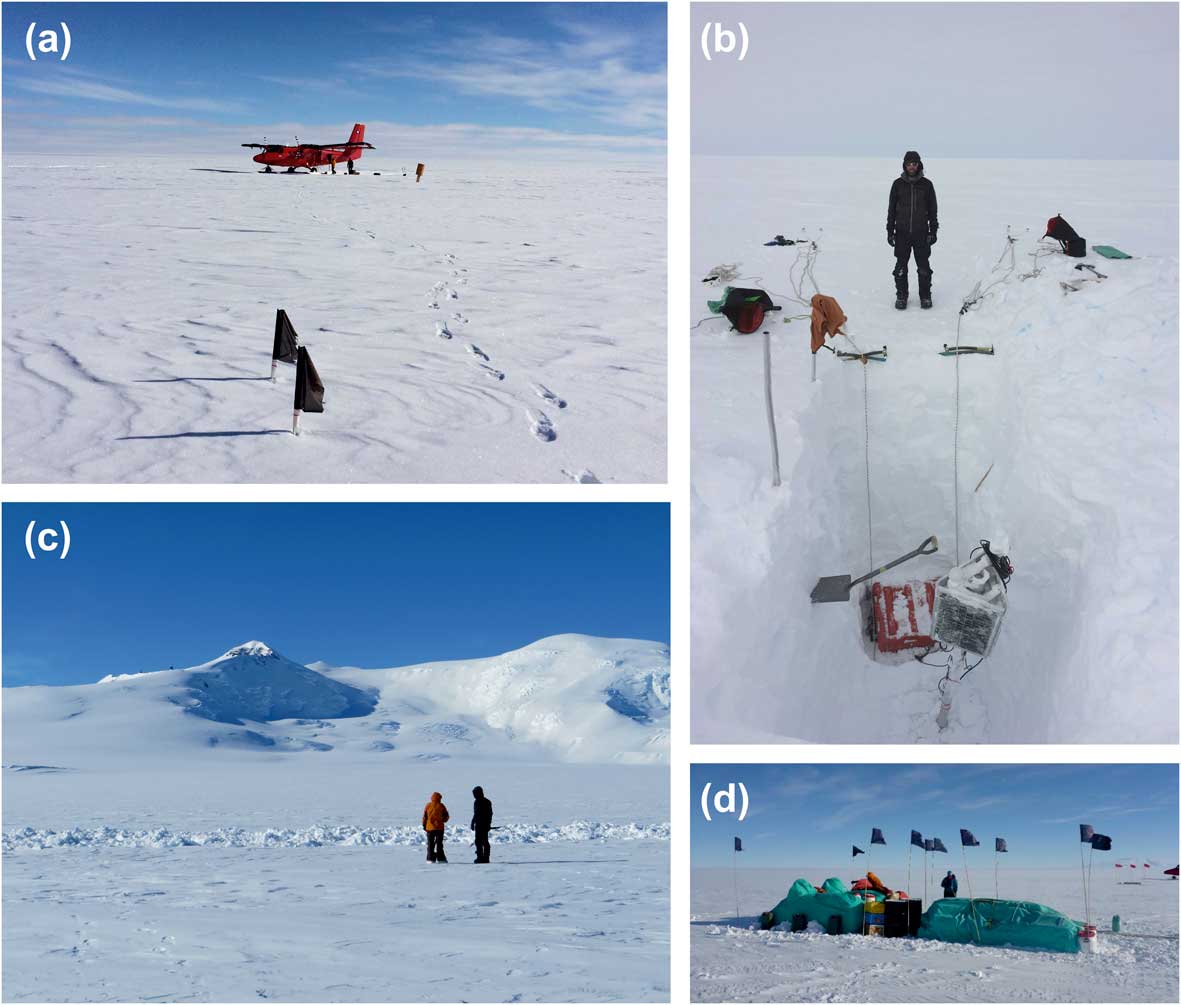
Fig. 2 Photographs of field sites. a. Seismic station (marked by flags) and fuel depot (marked by fuel drum near the aircraft) at PIGD, as viewed on arrival at the site. The flags mark the top of 4 m high poles, which are only just visible above the snow surface. b. The seismic station and solar panel at site PIG4, buried by 2.1 m of snow. c. Location of completely buried equipment and fuel depot at D115 (with Mount Murphy in the background). The roughness of the snow surface in the foreground is the result of extensive digging in an attempt to locate the buried depot. d. The D115 equipment depot on the surface in January 2016 prior to burial. Black flags mark the top of 3 m high bamboo canes.
The equipment depoted at D115 in early 2016 was marked by ten 3 m high bamboo canes topped by black cloth flags. Here the canes and flags became completely buried by snow (Fig. 2c) during the subsequent 11 months, and were relocated using ground-penetrating radar and a metal detector. The green tarpaulin covering the depot (Fig. 2d) was eventually reached by digging a vertical shaft through which the snow depth to the base of the depot was measured. Details of each site, with measurements of snow depth, are shown in Table I. The measurement uncertainty is no more than 10 cm. The time period over which the measurements were collected is short, thus uncertainties related to internal ice deformation, glacier flow and drift are likely to be minimal. There was no evidence for significant drift at any of the sites (no undulations in topography above the D115 depot or build-up of snow around flags/solar panels marking the UKANET sites). Furthermore, D115 had moved downstream by 45 m over the 11-month period, which is not far enough to have any significant effect on snow depth measurements.
Table I Locations of sites and details of snow depth measurements.

a Assuming snow bulk density based on average of six neutron probe density profiles from Pine Island Glacier (grey squares in Fig. 3; see text).
b Based on standard deviation from six neutron probe density profiles from Pine Island Glacier (grey squares in Fig. 3; see text), and also accounts for the uncertainty of up to 10 cm in the depth measurements.
In order to calculate snow accumulation (i.e. the net result of precipitation, sublimation, wind erosion and melt) as metres of water equivalent per year at each site for comparison with other records, e.g. those from airborne radar and ice cores (Table I), the density of the snow must be known. However, as a consequence of the opportunistic nature of our measurements, it was not possible to measure snow density at our sites. Snow density increases with depth and therefore an average density profile has been used here, based on a compilation of six low elevation sites on Pine Island Glacier that are situated near our sites (iSTAR sites 15–19 and 22; Morris et al. Reference Morris, Mulvaney, Arthern, Davies, Gurney, Lambert, De Rydt, Smith, Tuckwell and Winstrup2017) (grey squares in Fig. 3). The average density for the top metre, based on this compilation, is 419 kg m-3, which is very close to a value of 420 kg m-3 used in an earlier study to calculate mean accumulation rate across the wider Pine Island–Thwaites glacier catchment from airborne radar (Medley et al. Reference Medley, Joughin, Smith, Das, Steig, Conway, Goginen, Lewis, Criscitiello, McConnell, van den Broeke, Lenaerts, Bromwich, Nicolas and Leuschen2014).

Fig. 3 Map showing comparison between accumulation rate at our sites (black circles) and average accumulation rates in the Pine Island–Thwaites glacier catchments from 1985–2009 (Medley et al. Reference Medley, Joughin, Smith, Das, Steig, Conway, Goginen, Lewis, Criscitiello, McConnell, van den Broeke, Lenaerts, Bromwich, Nicolas and Leuschen2014). The location of three firn cores, with associated average accumulation rates from 1985–2009 (Medley et al. Reference Medley, Joughin, Smith, Das, Steig, Conway, Goginen, Lewis, Criscitiello, McConnell, van den Broeke, Lenaerts, Bromwich, Nicolas and Leuschen2014), are shown as red stars. Also shown are the locations of the ITASE firn/ice cores (Kaspari et al. Reference Kaspari, Mayewski, Dixon, Spikes, Sneed, Handley and Hamilton2004) and neutron probe density profiles from the iSTAR traverse (Morris et al. Reference Morris, Mulvaney, Arthern, Davies, Gurney, Lambert, De Rydt, Smith, Tuckwell and Winstrup2017). The grey square symbols represent the six iSTAR sites whose average density was used in the present study to calculate accumulation rates (see text). Glacier catchments from the Antarctic Digital Database (www.add.antarctic.ac.uk) are outlined in white.
Results
Accumulation rates at our six sites are in the range 0.10±0.01 to 1.26±0.22 m w.e. yr-1 (Table I and Fig. 3). These rates equate to snow depths of 0.25–3.8 m over a period of c. 330 days, including the winter. The highest accumulation rates were recorded at sites D115 and PIGD, which lie within 30 and 50 km of the modern grounding line, respectively, both along the Walgreen Coast (Fig. 1). D115 is located 14 km to the south of Mount Murphy, a prominent mountain, which rises nearly 2000 m above the site (Fig. 2c) and which is therefore likely to cause particularly high snowfall there. Significantly lower accumulation rates were recorded at sites in the eastern Pine Island Glacier catchment (sites PIG1, PIG2 and PIG3) compared with the west. This is probably due to their location within a precipitation shadow of mountains along the Eights Coast (Fig. 3) and, for PIG3, wind-scouring as a result of its low elevation and location on the glacier margin. No correlations were found between accumulation rate and altitude. This is probably because the differing effects of orography and aspect at each site make the accumulation gradient more complex. A detailed assessment of the terrain geometry at each site would be needed to evaluate these effects.
Discussion
Comparison of our results with accumulation rate ranges for the Pine Island–Thwaites sector (Medley et al. Reference Medley, Joughin, Smith, Das, Steig, Conway, Goginen, Lewis, Criscitiello, McConnell, van den Broeke, Lenaerts, Bromwich, Nicolas and Leuschen2014) shows that accumulation rates in 2016 from five of the six sites lie within the average ranges for the period 1985–2009 (0.18–1.37 mw.e.yr-1 for the Pine Island Glacier catchment and 0.21–0.84 m w.e. yr-1 for the Thwaites Glacier catchment). Rates exceeding 1 m w.e. yr-1 (similar to that recorded at D115 in 2016: 1.26±0.22 m w.e. yr-1) were observed by Medley et al. (Reference Medley, Joughin, Smith, Das, Steig, Conway, Goginen, Lewis, Criscitiello, McConnell, van den Broeke, Lenaerts, Bromwich, Nicolas and Leuschen2014) along the coast near Pine Island Glacier. Mean annual accumulation rates calculated for sites on Pine Island Glacier and its tributaries range from 0.23–0.80 m w.e. yr-1 (Morris et al. Reference Morris, Mulvaney, Arthern, Davies, Gurney, Lambert, De Rydt, Smith, Tuckwell and Winstrup2017). Accumulation rates in 2016 from four of our five sites on Pine Island Glacier (i.e. excluding D115, which is situated more than 280 km west of Pine Island Glacier) lie within this range. iSTAR site 22 is located at PIGD (Fig. 3); Morris et al. (Reference Morris, Mulvaney, Arthern, Davies, Gurney, Lambert, De Rydt, Smith, Tuckwell and Winstrup2017) reported an accumulation rate of 0.78 m w.e. yr-1 for that site, which is identical within error to our value of 0.80±0.13 m w.e. yr-1.
Figure 3 shows our data in comparison with accumulation rates determined by Medley et al. (Reference Medley, Joughin, Smith, Das, Steig, Conway, Goginen, Lewis, Criscitiello, McConnell, van den Broeke, Lenaerts, Bromwich, Nicolas and Leuschen2014). Only three of our sites (PIG3, PIG4 and PIGD) directly overlap with their grid, although the others are located only 10–35 km away. The accumulation rate calculated for PIGD (0.80±0.13 m w.e. yr-1) concurs with that determined by Medley et al. (Reference Medley, Joughin, Smith, Das, Steig, Conway, Goginen, Lewis, Criscitiello, McConnell, van den Broeke, Lenaerts, Bromwich, Nicolas and Leuschen2014). For PIG3 and PIG4, our measurements suggest accumulation rates that differ by up to 0.2 m w.e. yr-1 (lower for PIG3 and higher for PIG4; Fig. 3). However, the resolution of Medley’s grid is 25 km; as PIG3 and PIG4 are located only 15 and 11 km, respectively, from areas with accumulation rates that match those measured, it can be concluded that our data are in good agreement with those derived from the airborne radar and ice core glacio-chemical analysis. Although D115 has a higher accumulation rate than any observed for the Thwaites Glacier catchment, none of the accumulation rates calculated from snowpit measurements at our sites are exceptional for this region. This is illustrated by a comparison with precipitation–evaporation (P–E) from ERA-interim re-analysis (Dee et al. Reference Dee, Uppala, Simmons, Berrisford, Poli, Kobayashi, Andrae, Balmaseda, Balsamo, Bauer, Bechtold, Beljaars, van de Berg, Bidlot, Bormann, Delsol, Dragani, Fuentes, Geer, Haimberger, Healy, Hersbach, Holm, Isaksen, Kallberg, Kohler, Matricardi, McNally, Monge-Sanz, Morcrette, Park, Peubey, de Rosnay, Tavolato, Thepaut and Vitart2011), the average of which suggests that 2016 had the fifth highest annual precipitation in this region since 1979 (Fig. 4). Therefore, our results for snow accumulation should be considered to be representative of P–E in an above average, but not anomalously high, year. The average snow accumulation determined from all snowpit sites in this study (0.63 m w.e.) is in agreement with the average P–E from ERA-interim (0.66 mw.e.) for the same sites over the same time period (i.e. not a complete year). This suggests that the ERA-interim re-analysis is capturing precipitation variability in the region as observed previously for higher elevation sites (Thomas & Bracegirdle Reference Thomas and Bracegirdle2015). Furthermore, the 2016 data suggest that there has not been any significant change in accumulation rates in the region since early 2011 when the firn cores DIV2010, PIG2010 and THW2010 (Fig. 3) were collected (Medley et al. Reference Medley, Joughin, Smith, Das, Steig, Conway, Goginen, Lewis, Criscitiello, McConnell, van den Broeke, Lenaerts, Bromwich, Nicolas and Leuschen2014).

Fig. 4 Annual average precipitation–evaporation (P–E) from ERA-interim re-analysis (1979–2016; black line). The average snow accumulation determined from measurements of all snowpits in this study is represented by the red circle, and is in agreement with the average P–E from ERA-interim for the same sites (blue triangle) over the same 11 month period.
During the 11 month period over the winter of 2016, our sites experienced 2–4 m of snowfall. Large amounts of snowfall such as this have severe implications for logistics, especially when equipment and fuel are to be stored at a site for periods of several months or years. The results of this study suggest that depots on snow or ice in the Pine Island–Thwaites glacier catchment would be best located on as flat an area as possible, and on berms of at least 4 m height for large amounts of equipment/fuel. Marking smaller caches with flagpoles of at least 6 m length and raising depots of any size annually would mitigate against loss by complete burial. These suggestions are especially important for work in the vicinity of the grounding line, where the accumulation rate is currently particularly high. Even though the Medley et al. (Reference Medley, Joughin, Smith, Das, Steig, Conway, Goginen, Lewis, Criscitiello, McConnell, van den Broeke, Lenaerts, Bromwich, Nicolas and Leuschen2014) data only describe the period up to 2009, the consistency with our 2016 data suggests that their accumulation rate grid (their fig. 7b) can be used as a reliable guide for assessing suitability of work sites in the ASE region.
Conclusions
In situ measurements of accumulation rates across the ASE in 2016 are within average ranges derived from airborne radar data for the period 1985–2009 by Medley et al. (Reference Medley, Joughin, Smith, Das, Steig, Conway, Goginen, Lewis, Criscitiello, McConnell, van den Broeke, Lenaerts, Bromwich, Nicolas and Leuschen2014) and neutron probe measurements made on Pine Island Glacier in 2014 by Morris et al. (Reference Morris, Mulvaney, Arthern, Davies, Gurney, Lambert, De Rydt, Smith, Tuckwell and Winstrup2017), with the exception of a site near Mount Murphy where accumulation rate exceeded 1 mw.e.yr-1. When compared with existing published data for the earlier time period and the average P–E predicted for 2016 by ERA-interim re-analysis, this value is high but within the expected range of variability. Results from our study imply that the highest accumulation rates in the ASE occur near the grounding line of the Walgreen Coast on the western side of Pine Island Glacier; in 2016, rates in this region corresponded with up to 4 m of snowfall within an 11 month period. Although based on data from 1985–2009, the accumulation map (Medley et al. Reference Medley, Joughin, Smith, Das, Steig, Conway, Goginen, Lewis, Criscitiello, McConnell, van den Broeke, Lenaerts, Bromwich, Nicolas and Leuschen2014, fig. 7b) can be used as a guide for choosing suitable locations for equipment and fuel depots. Our results suggest that 4 m high berms or 6 m high marker poles, as well as annual raises, should be routinely considered for depots to be left over winter in the Pine Island–Thwaites region, especially near the grounding line.
Acknowledgements
We are grateful to all in British Antarctic Survey (BAS) Operations and at Rothera Research Station for their field support, especially James Wake, Mike Dinn and the BAS Air Unit. Field assistants Iain Rudkin, Alistair Rose, Alistair Docherty and Steve Windross, and boating officer Zac Priestly assisted with depoting the equipment at D115 and measuring snow depth. We thank Liz Morris and Andy Smith for providing density profiles from the iSTAR sites. Peter Neff and an anonymous reviewer provided thorough reviews that significantly improved the manuscript. JSJ acknowledges the support of NERC grant K012088/1.
Author contributions
JSJ conceived the study. JSJ and JPO’D undertook the fieldwork. All authors contributed to writing the manuscript.
Details of data deposit
The data in Table I are freely available (doi: 10.5285/3fe799e0-97ec-4b01-b6df-325b8b31baac) within the Discovery Metadata System of the UK Polar Data Centre, found at https://data.bas.ac.uk.


