


To effectively characterize youth development, it is essential to integrate biological and environmental constructs. Accordingly, research on Gene × Environment (G × E) interactions has proliferated. However, G × E research has largely focused on genetic risk, adverse environmental contexts, and maladaptive functioning (Pluess & Belsky, Reference Pluess and Belsky2012). Some suggest that this bias toward pathology may be due in part to an implicit assumption that positive contexts likely benefit most individuals similarly (Pluess & Belsky, Reference Pluess and Belsky2012). Diathesis–stress models traditionally used to conceptualize G × E interactions posit that there should be no differences between vulnerable and resilient individuals in the absence of adversity (Zuckerman, Reference Zuckerman1999). This study extends G × E research beyond risk, and assesses genetic variants as potential susceptibility factors to adaptive social contexts as predictors of both maladaptive and adaptive outcomes.
From an evolutionary perspective, it is unclear why certain endogenous factors would solely increase sensitivity to maladaptive environments, consistent with diathesis–stress models. That is, it is expected that endogenous factors associated with increased sensitivity to negative contexts and deleterious outcomes in turn would slowly disappear from the human population to the extent that they limit reproductive fitness (Conley, Rauscher, & Siegal, Reference Conley, Rauscher and Siegal2013). This has led some researchers to believe that these endogenous factors are likely to reflect increased sensitivity to all environmental contexts, not just increased vulnerability (Belsky & Pluess, Reference Belsky and Pluess2009). More specifically, the differential susceptibility hypothesis posits that certain genetic polymorphisms represent sensitivity to both positive and negative influences rather than pure vulnerability (Belsky & Pluess, Reference Belsky and Pluess2009). In the context of adversity, these individuals have worse outcomes compared to those without the genetic variant. However, in the context of adaptive environments, these same individuals have better outcomes. The ability to reap the most benefit from adaptive environments that comes with increased sensitivity may confer selective advantages (Conley et al., Reference Conley, Rauscher and Siegal2013). There has been burgeoning support for the differential susceptibility hypothesis (e.g., Bakermans-Kranenburg, van IJzendoorn, Pijlman, Mesman, & Juffer, Reference Bakermans-Kranenburg, van IJzendoorn, Pijlman, Mesman and Juffer2008; Kochanska, Kim, Barry, & Philibert, Reference Kochanska, Kim, Barry and Philibert2011). A more recent proposal, vantage sensitivity, posits that some genetic variants may reflect increased sensitivity to supportive conditions in particular (Pluess & Belsky, Reference Pluess and Belsky2012). Although there is preliminary work supporting this proposition (Nederhof, Belsky, Ormel, & Oldehinkel, Reference Nederhof, Belsky, Ormel and Oldehinkel2012), empirical models systematically testing G × E interactions in the context of positive environmental exposures on adaptive as well as maladaptive outcomes warrant further investigation. To our knowledge, this is the first study to test whether specific genetic variants impact the susceptibility of positive peer involvement on maladaptive as well as adaptive adolescent functioning.
Diathesis–stress, differential susceptibility, and vantage sensitivity are not separate conceptually; rather, they represent different forms of potential G × E interactions. Typically, ordinal interactions that do not crossover tend to support either diathesis–stress or vantage sensitivity. Diathesis–stress represents what some have termed the “dark side” of G × E interactions (Pluess, Reference Pluess2015), whereby individuals with a specific genetic variant are negatively affected by a maladaptive environment, while those without this variant are unaffected. Vantage sensitivity represents what some have called the “bright side” of G × E interactions (Bakermans-Kranenburg & van IJzendoorn, Reference Bakermans-Kranenburg and van IJzendoorn2011), whereby individuals with a specific genetic variant are positively affected by adaptive environments while those without this variant are unaffected. Interactions that crossover, or disordinal interactions, reflect differential susceptibility, whereby individuals with a specific genetic variant are at increased susceptibility to social contexts on both the dark side and the bright side of the continuum while those without this variant are unaffected.
Formal statistical approaches are available to determine whether the form of G × E interactions conforms to diathesis–stress, differential susceptibility, or vantage sensitivity. One approach involves the calculation of regions of significance (Roisman et al., Reference Roisman, Newman, Fraley, Haltigan, Groh and Haydon2012). This approach requires graphing the environmental context of interest at 2 SD below the mean and 2 SD above the mean, and identifying within this range specific values of the environmental context below which and above which the regression lines for two groups (e.g., different genotypes) differ significantly on a specific outcome. These values reflect the regions of significance and are often depicted as shaded regions. If the region of significance is two tailed (i.e., significant differences at both low and high levels of the environmental exposure; see Figure 1b), this supports a disordinal interaction consistent with differential susceptibility. If the region of significance is not two tailed, this supports an ordinal interaction consistent with either diathesis–stress (Figure 1a) or vantage sensitivity (Figure 1c), depending on the nature of the environmental exposure (Roisman et al., Reference Roisman, Newman, Fraley, Haltigan, Groh and Haydon2012).

Figure 1. (Color online) Forms of Gene × Environment interactions. (a) Prototypical ordinal diathesis–stress interaction pattern, (b) prototypical disordinal differential sensitivity pattern, and (c) prototypical ordinal vantage sensitivity pattern. Shaded regions represent regions of significance.
There are several genetic factors that likely represent endogenous susceptibility factors. Polymorphisms in the GABA receptor (Brody, Chen, & Beach, Reference Brody, Chen and Beach2013), serotonin transporter (Taylor et al., Reference Taylor, Way, Welch, Hilmert, Lehman and Eisenberger2006), and dopamine receptor D4 (DRD4; Bakermans-Kranenburg et al., Reference Bakermans-Kranenburg, van IJzendoorn, Pijlman, Mesman and Juffer2008) genes are all potential candidates. This study represents an effort to test susceptibility to positive peer involvement in one of these systems. The GABA receptor subunit alpha-2 gene (GABRA2), located on chromosome 4, codes for GABRA2 and is mainly expressed in brain reward circuitry including the amygdala, the ventral tegmental area, and the nucleus accumbens (NAcc; Enoch et al., Reference Enoch, Hodgkinson, Yuan, Albaugh, Virkkunen and Goldman2009). Most common single nucleotide polymorphisms (SNPs) in the GABRA2 gene are in linkage disequilibrium. That is, there is a nonrandom association across these SNPs, and they are strongly correlated. Moreover, these associated SNPs form two larger clusters, or haplotypes (i.e., a set of polymorphisms that tend to be inherited together), the major (~50.4%) and the minor (~44.0%) haplotype in White adolescents (see Enoch, Reference Enoch2008). Although findings are mixed, the less common G allele across GABRA2 SNPs, including rs279858, rs279826, and rs279827, as well as 3-SNP haplotypes examined in the 3′ region of GABRA2, are overrepresented among adults meeting criteria for alcohol (e.g., Covault, Gelernter, Hesselbrock, Nellissery, & Kranzler, Reference Covault, Gelernter, Hesselbrock, Nellissery and Kranzler2004; Edenberg et al., Reference Edenberg, Dick, Xuei, Tian, Almasy and Bauer2004) and drug dependence (e.g., Agrawal et al., Reference Agrawal, Edenberg, Foroud, Bierut, Dunne and Hinrichs2006), and adolescents high in rule-breaking behavior (Trucco, Villafuerte, Heitzeg, Burmeister, & Zucker, Reference Trucco, Villafuerte, Heitzeg, Burmeister and Zucker2014).
There is also evidence for indirect GABRA2 effects. For example, one study examined 10 GABRA2 SNPs (including rs279858, rs279826, and rs279827) within the larger haplotype block that extends from intron 3, and found that adolescents with risk conferring GABRA2 variants were more likely to demonstrate high-risk externalizing behavior in the context of low parental monitoring (Dick et al., Reference Dick, Latendresse, Lansford, Budde, Goate and Dodge2009) compared to those without the risk variant. Similarly, another study demonstrated that adolescents with the GG genotype on SNP rs279826 were more susceptible to high deviant peer exposure resulting in higher rates of externalizing behavior compared to A-carriers (Villafuerte et al., 2014), but no different at low deviant peer exposure. Both studies support ordinal interactions consistent with a diathesis–stress framework.
Despite an increasing number of studies examining GABRA2 associations, the function of GABRA2 variants are still not well understood. Given replicated associations with alcohol dependence, drug dependence, and conduct disorder, some posit that the common underlying pathway that characterizes those carrying the G allele is behavioral disinhibition (Perry et al., Reference Perry, Pescosolido, Bucholz, Edenberg, Kramer and Kuperman2013). For example, one study demonstrated that the G allele and corresponding haplotype for SNPs rs279858 and rs279826 is likely associated with increased alcohol disorder symptomatology given higher rates of impulsivity (Villafuerte et al., Reference Villafuerte, Heitzeg, Foley, Wendy Yau, Majczenko and Zubieta2012). Nevertheless, a predisposition to behavioral disinhibition alone cannot explain why individuals with these same genetic risk variants also reap the most benefit from adaptive contexts. For example, when systematically testing differential susceptibility, adolescents with the GG genotype of GABRA2 across SNPs rs279858, rs279826, and rs279827 were more likely to belong to a high-risk externalizing trajectory class in the context of low parental monitoring, but less likely to belong to a high-risk externalizing class in the context of high parental monitoring compared to A-carriers (Trucco, Villafuerte, Heitzeg, Burmeister, & Zucker, Reference Trucco, Villafuerte, Heitzeg, Burmeister and Zucker2016). Accordingly, conceptualizing GABRA2 variants beyond a risk framework necessitates further exploration.
A seminal article on the social neuroscience of adolescent risk taking indicates that it is important to compare the relative development of socioemotional systems to cognitive control centers to understand increased rates of problem behaviors and susceptibility to peers that characterizes this developmental period (Steinberg, Reference Steinberg2008). The maturational gap between the faster developing reward-seeking centers compared to the more slowly maturing cognitive control center contributes to adolescents’ increased susceptibility to social reward. Compared to adults and children, adolescents tend to spend more time with peers, they report interactions with peers to be highly rewarding, and they tend to use peer norms to guide behaviors (Guyer, McClure-Tone, Shiffrin, Pine, & Nelson, Reference Guyer, McClure-Tone, Shiffrin, Pine and Nelson2009). That is, the desire for peer affiliation and acceptance strongly motivates adolescents to engage in behaviors that are valued among peers. Imaging studies indicate important developmental differences in neural responses to social rewards, especially in regions involved in social–affective processing including the NAcc and insula (Guyer et al., Reference Guyer, McClure-Tone, Shiffrin, Pine and Nelson2009). For example, one study demonstrated increased insula and NAcc activation among female adolescents compared to younger females during appraisal of social evaluation by high- versus low-interest peers (Guyer et al., Reference Guyer, McClure-Tone, Shiffrin, Pine and Nelson2009). Another study found greater insula activation among adolescents during a condition where they were socially excluded from peers, compared to a peer inclusion condition (Masten et al., Reference Masten, Eisenberger, Borofsky, Pfeifer, McNealy and Mazziotta2009).
It is important to note, however, that although these findings demonstrate that adolescence represents a period of heightened activation to social rewards, individual differences are likely. For example, brain imaging findings indicate that GABRA2 G allele carriers (SNPs rs279858, rs279826, and haplotype) have heightened sensitivity to reward manipulations, demonstrating greater insula activation during anticipation of monetary reward and loss (Villafuerte et al., Reference Villafuerte, Heitzeg, Foley, Wendy Yau, Majczenko and Zubieta2012), and heightened NAcc activation to incentive stimuli (SNP rs279858), especially during adolescence (Heitzeg et al., Reference Heitzeg, Villafuerte, Weiland, Enoch, Burmeister and Zubieta2014). Although prior work has not examined differences across GABRA2 genotypes using a social reward manipulation, research indicates that the brain regions relevant to monetary and social reward sensitivity are largely similar (Sprekelmeyer et al., Reference Spreckelmeyer, Krach, Kohls, Rademacher, Irmak and Konrad2009). Taken together, these findings support adolescent hypersensitivity to social rewards, and that those with the minor allele of GABRA2 may be particularly susceptible to peer influence given its association with reward sensitivity and insula and NAcc activation.
Although it is assumed that peers have both positive and negative influences, research has increasingly focused on negative influences as they relate to problem behavior (Steinberg & Monahan, Reference Steinberg and Monahan2007). Similarly, G × E research has largely focused on identifying genetic variants that increase vulnerability to negative peer contexts (e.g., Kretschmer, Vitaro, & Barker, Reference Kretschmer, Vitaro and Barker2014). Yet, adolescent peer groups vary in their norms and values, and some adolescents may feel pressured to engage in prosocial behaviors (e.g., do well in school or avoid drugs; Steinberg & Monahan, Reference Steinberg and Monahan2007). Studies examining positive peer influence demonstrate a negative association with maladaptive behavior and a positive association with prosocial development in youth. For example, indirect positive peer association (friends who value studying, religious activities, and school organizations) was negatively related to aggression, delinquency, and depression, as well as positively related to social initiative, self-esteem, and empathy (Padilla-Walker & Bean, Reference Padilla-Walker and Bean2009). Accordingly, adolescents who affiliate with prosocial peers may feel rewarded for engaging in adaptive behavior, especially among those carrying genetic variants associated with sensitivity to reward. However, few studies examine G × E effects on both adaptive as well as problematic adolescent behavior. It is important to note that adolescents who lack positive peer associations not only are less likely to experience emotional well-being and positive beliefs about the self but they are also at increased risk of exhibiting poor social functioning and weak school connectedness. For example, adolescents who drop out of school are more likely to have peers who do not regard school as important or useful (Hymel, Comfort, Schonert-Reichl, & McDougall, Reference Hymel, Comfort, Schonert-Reichl, McDougall, Wentzel and Juvonen1996). As such, although high positive peer involvement is adaptive, low positive peer involvement is not neutral; rather, it can contribute to maladaptive functioning in youth.
During adolescence, developmental tasks involve internalization of rules and values, academic performance, as well as social competence with peers (Kochanska et al., Reference Kochanska, Kim, Barry and Philibert2011). Thus, each of these domains was assessed in the current study. Consistent with previous research, it was hypothesized that positive peer involvement would negatively predict teacher-reported externalizing behavior, but positively predict adaptive outcomes (academic, behavioral, and social competence). Moreover, those carrying the GABRA2 GG genotype were hypothesized as being especially susceptible to peer effects given prior work indicating increased sensitivity of these adolescents to social contexts (Trucco et al., Reference Trucco, Villafuerte, Heitzeg, Burmeister and Zucker2016; Villafuerte et al., Reference Trucco, Villafuerte, Heitzeg, Burmeister and Zucker2014). Specific hypotheses regarding the form of the interaction (differential susceptibility vs. vantage sensitivity) were not made.
Method
Sample
This community sample of 300 adolescents was part of a larger multiwave family study, the Michigan Longitudinal Study (MLS), investigating the onset of substance use disorder (SUD). The MLS follows families from three different SUD risk categories: (a) families with fathers convicted of drunk driving meeting criteria for an alcohol use disorder (AUD; high risk), (b) a control sample of families where neither parent had a history of SUD recruited out of the same neighborhoods where the category (a) families lived (low risk), and (c) community-identified men with an AUD diagnosis and their families (moderate risk) who were identified during the community canvass procedure used to acquire the control families. For the current study, 107 (35.7%) adolescents came from high-risk families, 78 (26.0%) came from moderate-risk families, and 115 (38.3%) came from low-risk families. The biological mother's AUD status could vary in the high- and moderate-risk families. Siblings were also included after initial recruitment if they were within 8 years of the male target child. For this study, adolescents came from 205 different families; 124 (41.3%) did not have any other siblings in the study, 134 (44.7%) had one, and 42 (14.0%) had two siblings in the study. Participants were primarily White (279, 93.0%) and male (209, 69.7%) given the original recruitment strategy (see Zucker, Ellis, Fitzgerald, Bingham, & Sanford, Reference Zucker, Ellis, Fitzgerald, Bingham and Sanford1996, for a detailed description of the MLS sample).
Procedure
Families completed assessments following initial recruitment (Wave 1, ages 3–5) with subsequent assessments occurring every 3 years (e.g., Wave 2, ages 6–8), and biological material for genotyping was provided. Data for the present study focus on adolescence because this developmental period is characterized by increased time spent with peers as well as increased sensitivity to peer influence (Steinberg & Monahan, Reference Steinberg and Monahan2007). Namely, adolescent report of perceived peers’ behavior was assessed at Wave 4 (ages 12–14). In addition, teachers nominated by study participants (usually homeroom, English, social studies, math, or science teachers) were asked to rate adolescent behaviors at Wave 5 (ages 15–17). Teacher report reflects behavior in a setting where peer interactions occur (Achenbach, Dumenci, & Rescorla, Reference Achenbach, Dumenci and Rescorla2002) and limits bias due to shared method variance. This study was approved by the institutional review board and complied with the American Psychological Association's ethical standards.
Adolescents included in the analyses did not differ from those without genetic data or teacher-report data on biological sex, family AUD risk status, or positive peer involvement. Non-White participants did have significantly more missing data compared to White participants, F (1) = 8.30, p < .01. This is attributable to the design of the study, where non-White families were added in later waves. Originally, the recruitment protocol for the MLS specified that families be of non-Hispanic Caucasian heritage given the low rate of families of other ethnic and racial background in the four-county area where participants were recruited. The minority exclusion criteria was removed to meet new NIH requirements in the last quarter of participant recruitment. Given this lag, using identical protocol recruitment criteria (starting with 3- to 5-year-olds), minority participants would always lag in comparable age data availability. In order to better integrate the minority with the nonminority data, the design decision was made to start recruiting minority participants at ages 6 to 8. Hence, Wave 1 data for these participants is missing by design. Despite this accommodation, available data for these participants still lags. Demographic variables were dichotomized for analyses: sex (0 = boys, 1 = girls), race (0 = White, 1 = non-White), and family AUD risk (0 = control, 1 = at risk [moderate or high risk]).
Measures
Positive peer involvement
Positive peer involvement at Wave 4 (ages 12–14) was measured as part of the Peer Behavior Profile (Bingham, Fitzgerald, & Zucker, Reference Bingham, Fitzgerald and Zucker1995). This is a 34-item measure adapted from Social Control Theory (Hirschi, Reference Hirschi1969) and Problem Behavior Theory (Jessor, Costa, Jessor, & Donovan, Reference Jessor, Costa, Jessor and Donovan1983). Adolescents were asked to consider “the friends you hang around with most of the time” and their degree of involvement in various activities and behaviors. Nine items were used to assess peer involvement in extracurricular activities (e.g., “participate in school plays”), scholastic competence (e.g., “are excellent students”), and religious involvement (e.g., “in social group sponsored by church”), using a 5-point Likert scale (1 = almost none, to 5 = almost all) consistent with previous work (Padilla-Walker & Bean, Reference Padilla-Walker and Bean2009). The internal consistency was adequate (Cronbach α = 0.78).
Problem behavior
Problem behavior at Wave 5 (ages 15–17) was assessed using the Teacher Report Form (Achenbach, Reference Achenbach1991) broadband externalizing scale using items from the aggression (e.g., “gets in many fights”) and rule breaking/delinquency (e.g., “destroys property belonging to others”) subscales. Items are rated on a 3-point scale (0 = not true to 2 = very true or often true). The internal consistency was good (Cronbach α = 0.93).
Academic and behavioral competence
The Teacher Report Form was also used to assess academic and behavioral competence at Wave 5 (ages 15–17) following recommended procedures (Achenbach et al., Reference Achenbach, Dumenci and Rescorla2002). Teachers were asked to rate adolescents’ performance in each subject on a 5-point scale (1 = far below grade to 5 = far above grade). Academic competence represents average ratings across all academic subjects. The internal consistency of academic competence was good (Cronbach α = 0.87). Teachers also rated adolescents’ behavior in school (“How appropriately is he or she behaving?”) using a 7-point scale (1 = much less to 7 = much more).
Social competence
Social competence was assessed at Wave 5 (ages 15–17) using items adapted from the Revised Class Play (Masten, Morison, & Pellegrini, Reference Masten, Morison and Pellegrini1985). Teachers were asked to think about the probability that the adolescent would be assigned to 50 different social roles using a 5-point scale (1 = least likely to be selected to 5 = most likely to be selected). Of interest for this study was the sociability–leadership subscale, reflecting 7 prosocial roles (e.g., good leader, everyone listens to). This internal consistency was good (Cronbach α = 0.86).
Genotyping
DNA was genotyped using the Illumina Addiction biology SNP array (Hodgkinson et al., Reference Hodgkinson, Yuan, Xu, Shen, Heinz and Lobos2008) a panel genotyped in the MLS sample using the Illumina GoldenGate platform (Ilumina Inc., San Diego, CA). Three SNPs were examined in this study (rs279858, rs279826, and rs279827) because they represent a haplotype block associated with alcohol dependence (Edenberg et al., Reference Edenberg, Dick, Xuei, Tian, Almasy and Bauer2004; Villafuerte et al., Reference Villafuerte, Heitzeg, Foley, Wendy Yau, Majczenko and Zubieta2012), they represent potential functional SNPs (exonic and splice), and they correspond with previous work on G × E interactions (e.g., Dick et al., Reference Dick, Latendresse, Lansford, Budde, Goate and Dodge2009; Heitzeg et al., Reference Heitzeg, Villafuerte, Weiland, Enoch, Burmeister and Zubieta2014). SNPs rs279858 and rs279826 are in strong linkage disequilibrium (r 2 > .77) with rs279827. Duplicates were included, and no discrepancies were observed. All SNPs were in Hardy–Weinberg equilibrium. Findings focus on SNP rs279858 (exon 5, K132K; AA 31.0%, n = 93; AG 51.0%, n = 153; and GG 18.0%, n = 54) for simplicity and clarity, although findings were consistent across SNPs and the haplotype block.
Analysis plan
Random coefficients hierarchical linear models accounting for family clustering were estimated with biological sex, race, and family AUD risk status as covariates using the mixed procedure in SAS version 9.3 (SAS Institute Inc., 2011). Given a largely White sample, analyses were also conducted on White participants only. Findings were comparable, and frequency genotypes did not differ by race, χ2 (2) = 0.59, p = .74. The analyses accordingly utilize the full sample. All study outcomes were normally distributed.
Given our hypothesis that those carrying the GG genotype would be most susceptible to peer influence, GABRA2 was dummy coded so that the GG genotype was the reference group in two comparisons (i.e., GG vs. AA; GG vs. AG). Similarly, two interaction terms (GG vs. AA × Positive Peer Involvement; GG vs. AG × Positive Peer Involvement) were used to test whether the effect of positive peer involvement differed by genotype.Footnote 1 Covariates and positive peer involvement were standardized around the sample grand mean prior to forming the interaction term. Three-way interactions were also tested to explore potential biological sex and family AUD risk differences. An online tool was used to probe interactions, as well as to calculate the regions of significance (Preacher, Curran, & Bauer, Reference Preacher, Curran and Bauer2006) to determine whether interactions conformed to the differential susceptibility or vantage sensitivity model. High and very high positive peer involvement were represented by scores 1 and 2 SD above the mean. Similarly, 1 and 2 SD below the mean represented low and very low positive peer involvement following previous work (Roisman et al., Reference Roisman, Newman, Fraley, Haltigan, Groh and Haydon2012). Regions of significance at both high and low values of positive peer involvement would support differential susceptibility, whereas regions of significance at only high levels of positive peer involvement would support vantage sensitivity. To correct for multiple testing, a Bonferroni correction was implemented on the basis of the number of SNPs analyzed. The critical p value was set at .0167 (0.05/3 SNPs).
Results
Means and correlations for study variables are presented in Table 1. Race was associated with family AUD status, externalizing behavior, and academic and behavioral competence. More specifically, non-White adolescents were more likely to come from a moderate- or high-risk AUD family, they were rated as having higher rates of externalizing behavior, and they were rated as having lower rates of academic and behavioral competence compared to White participants in our sample. Family AUD risk status was associated with GABRA2, positive peer involvement, externalizing behavior, and competence. More specifically, adolescents from a moderate- or high-risk AUD family were more likely to have the rs279858 minor allele, they reported having less positive peer involvement, they were rated as having higher rates of externalizing behavior, and they were rated as having lower rates of academic, behavioral, and social competence compared to low-risk AUD families. As expected, positive peer involvement was associated with lower rates of externalizing behavior, and higher rates of academic, behavioral, and social competence. GABRA2 was not associated with any of the outcome variables or positive peer involvement. This is important for understanding our results as gene–environment correlation represents a nonrandom distribution of environments across genotypes, and may confound G × E effects (Belsky & Beaver, Reference Belsky and Beaver2011). An absence of gene–environment correlation effects indicates that G × E interactions do not simply reflect an evocative effect of GABRA2. The results for multilevel models are presented in Table 2. Each model will be discussed in turn.
Table 1. Means, standard deviations, and correlations for study variables
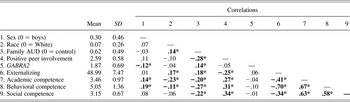
Note: AUD, Alcohol use disorder.
*p < .05.
Table 2. Multilevel linear regression model for teacher-reported outcomes

Note: AUD, Alcohol use disorder.
†p < .05. *p < .0167 with Bonferroni correction. **p < .001.
Externalizing behavior
Race was associated with externalizing behavior; teachers rated non-White adolescents as having higher rates of externalizing behavior compared to White adolescents. As expected, positive peer involvement predicted lower rates of externalizing behavior. There was no evidence for a main effect of GABRA2. The two-way interaction contrasting the GG genotype versus the AA genotype was significant (f 2 = 0.04). Probing the interaction demonstrated that the simple slope of positive peer involvement on externalizing behavior was significant for those with the GG genotype (t = –3.64, p < .001), but was not significant for those with the AA genotype (t = 0.21, ns). As depicted in Figure 2, the lower and upper bounds of regions of significance (shaded region) were –0.49 and 1.31. This indicates that regression lines are significantly different for all points when positive peer involvement was lower than –0.49 or higher than 1.31 SD. That is, those with the GG genotype had higher externalizing behavior relative to individuals with the AA genotype when their positive peer involvement was low (i.e., ~0.5 SD below the mean or lower). However, they had significantly lower externalizing behavior relative to individuals with the AA genotype when their positive peer involvement was high (i.e., ~1 SD above the mean or higher).

Figure 2. Positive peer involvement predicting externalizing behavior by GABRA2 (GG vs. AA genotype). **p < .001. Shaded region represents region of significance (outside –0.49 and 1.31).
Academic and behavioral competence
Race was associated with academic competence; teachers rated White adolescents as performing better academically compared to non-White adolescents. As expected, positive peer involvement predicted higher rates of academic competence. There was no evidence of a main effect of GABRA2. Neither two-way interaction was statistically significant.
Biological sex and family AUD risk predicted behavioral competence; teachers rated girls and adolescents from families without AUD risk as having greater behavioral competence compared to boys and those with family AUD risk, respectively. As expected, positive peer involvement predicted higher rates of behavioral competence. The two-way interaction contrasting the GG genotype versus the AA genotype was statistically significant (f 2 = 0.01). Probing the interaction demonstrated that the simple slope of positive peer involvement on behavioral competence was significant for those with the GG genotype (t = 4.27, p < .001), but was not significant for those with the AA genotype (t = 0.77, ns). As depicted in Figure 3, the lower and upper bounds of regions of significance were –0.59 and 1.24 SD. That is, individuals with the GG genotype had significantly lower behavioral competence relative to individuals with the AA genotype when their positive peer involvement was low (i.e., ~0.5 SD below the mean or lower). However, they had significantly higher behavioral competence relative to individuals with the AA genotype when their positive peer involvement was high (i.e., ~1.5 SD above the mean or higher). The two-way interaction contrasting the GG genotype versus the AG genotype was also statistically significant (f 2 = 0.04). Probing the interaction demonstrated that the simple slope of positive peer involvement on behavioral competence was significant for those with the GG genotype (t = 4.27, p < .001), but did not reach the critical p value cutoff for those with the AG genotype (t = 2.40, p = .02). As depicted in Figure 4, the lower and upper regions of significance were –1.99 and 0.90 SD. That is, those with the GG genotype had significantly lower behavioral competence relative to individuals with the AG genotype when their positive peer involvement was very low (i.e., ~2 SD below the mean or lower). However, they had significantly higher behavioral competence relative to individuals with the AG genotype when their positive peer involvement was high (i.e., ~1 SD above the mean or higher).

Figure 3. Positive peer involvement predicting behavioral competence by GABRA2 (GG vs. AA genotype). **p < .001. Shaded region represents region of significance (outside –0.60 and 1.24).

Figure 4. Positive peer involvement predicting behavioral competence by GABRA2 (GG vs. AG genotype). **p < .001. Shaded region represents region of significance (outside –1.99 and 0.90).
Social competence
Family AUD risk predicted social competence. Namely, teachers rated adolescents from families without AUD risk as having greater social competence. As expected, positive peer involvement predicted higher rates of social competence. The two-way interaction contrasting the GG genotype versus the AA genotype did not reach the critical p value (p < .05); however, the effect size was comparable to statistically significant moderational effects found in other models (f 2 = 0.03). The two-way interaction contrasting the GG genotype versus the AG genotype was statistically significant (f 2 = 0.03). Probing the interaction demonstrated that the simple slope of positive peer involvement on social competence was significant for those with the GG genotype (t = 4.21, p < .001), but did not reach the critical p value cutoff for those with the AG genotype (t = 2.20, p = .03). As depicted in Figure 5, the lower and upper regions of significance were –0.86 and 1.97 SD. That is, individuals with the GG genotype had significantly lower social competence relative to individuals with the AG genotype when their positive peer involvement was low (i.e., ~1 SD below the mean or lower). However, they had significantly higher social competence relative to individuals with the AG genotype when their positive peer involvement was very high (i.e., ~2 SD above the mean or higher). Three-way interactions of interest were not significant.

Figure 5. Positive peer involvement predicting social competence by GABRA2 (GG vs. AG genotype). **p < .001. Shaded region represents region of significance (outside –0.86 and 1.97).
Discussion
This study focuses on positive environmental exposures and functioning in G × E research. Counter to diathesis–stress models, differential susceptibility and vantage sensitivity models incorporate adaptive contexts. Vantage sensitivity models in particular have largely gone untested (Pluess & Belsky, Reference Pluess and Belsky2012). The current study extends G × E research by demonstrating how genetic variants impact the degree of susceptibility to positive peer involvement on both adaptive and problematic behavior. Hypotheses were largely supported, and findings are consistent with the differential susceptibility hypothesis.
Across models, there was evidence for a main effect of positive peer involvement, but not a significant main effect of GABRA2. It is important to note that although previous research has demonstrated a main effect of GABRA2 on problem behavior (Dick et al., Reference Dick, Bierut, Hinrichs, Fox, Bucholz and Kramer2006; Trucco et al., Reference Trucco, Villafuerte, Heitzeg, Burmeister and Zucker2014), these studies did not include a measure of peer influence. Research indicates that the role of the environment, especially peers, tends to have a stronger impact on complex behavior during adolescence compared to genetic influences (Rose, Dick, Viken, Pulkkinen, & Kaprio, Reference Rose, Dick, Viken, Pulkkinen and Kaprio2001). Nevertheless, a lack of direct effects does not preclude the role of genes as a potential moderator. When adding the interaction term, there was evidence for a significant moderated effect when predicting externalizing behavior. This indicates that the effect of positive peer involvement on problem behavior significantly varies between those with the AA versus the GG genotype. This finding parallels work demonstrating that social well-being predicts a reduction in delinquency in adolescents, but only for those carrying a certain DRD4 variant (Kretschmer, Dijkstra, Ormel, Verhurlst, & Veenstra, Reference Kretschmer, Dijkstra, Ormel, Verhurlst and Veenstra2013). By testing regions of significance, we extend these findings. Namely, those with the GG genotype not only demonstrate higher rates of externalizing behavior at low levels of positive peer affiliation but also demonstrate lower rates of externalizing behavior at high levels of positive peer affiliation compared to those with the AA genotype. This is consistent with differential susceptibility.
The current study also extends prior research by examining adaptive outcomes. Positive peer involvement predicted elevations in behavioral and social competence, especially among those with the GG genotype. Those with the GG genotype not only demonstrate low rates of behavioral and social competence at low levels of positive peer affiliation but also are likely to demonstrate higher rates of behavioral and social competence at high levels of positive peer affiliation compared to A-carriers. This is also consistent with differential susceptibility. Although the interaction predicting academic competence was not statistically significant, findings show that those with the GG genotype have greater susceptibility to positive social contexts across a range of teacher-rated behaviors relevant to adaptive functioning.
Reward sensitivity is proposed as a potential mechanism underlying differential susceptibility (Belsky & Pluess, Reference Belsky and Pluess2009). This may be particularly relevant for GABRA2 variants, because receptors are primarily expressed in brain reward circuitry (Enoch et al., Reference Enoch, Hodgkinson, Yuan, Albaugh, Virkkunen and Goldman2009). There is also preliminary evidence that those with the GABRA2 minor allele in SNP rs279858 have increased activation in brain regions that have been associated with increased activation during social reward paradigms including the NAcc and the insula (Guyer et al., Reference Guyer, McClure-Tone, Shiffrin, Pine and Nelson2009; Heitzeg et al., Reference Heitzeg, Villafuerte, Weiland, Enoch, Burmeister and Zubieta2014). The desire for peer affiliation characterizing adolescence may act as a strong motivator to engage in behaviors that are likely to be rewarded by the peer group. In the context of delinquent peers, adolescents may be rewarded for acting out. While in the context of prosocial peers, they may be rewarded for doing well in school and behaving. Accordingly, adolescents sensitive to rewards may be more likely to change their behavior to fit their peer group. Although these individual differences may confer greater vulnerability for unhealthy incentives that appear impulsive (e.g., theft or substance use), this may also reflect greater flexibility in shifting goal priorities that facilitate social and emotional learning necessary for the development of adult social and behavioral competence.
Limitations and future directions
An important limitation is that these genetic associations were not replicated using another sample. Given the importance of replicating genetic effects, considerable caution is warranted when drawing inferences. Although our effect sizes were similar to prior work (e.g., Kochanska et al., Reference Kochanska, Kim, Barry and Philibert2011; Kretschmer et al., Reference Kretschmer, Vitaro and Barker2014), effect sizes were small across models. However, these models included multiple informants and prospective effects across a 3-year span. Although this provides a more rigorous methodological approach, it likely contributes to the lower effect sizes. Another limitation is that we did not control for prior rates of adolescent outcomes across models. This limits our ability to make strong inferences that positive peer affiliation caused an increase in adolescent functioning across a 3-year span. Future work should examine potential bidirectional effects between positive peer affiliation and adolescent adaptive and maladaptive functioning. Findings cannot be generalized to samples with different demographic characteristics. This study examined effects in adolescence, a period characterized by strong susceptibility to peer influence (Guyer et al., Reference Guyer, McClure-Tone, Shiffrin, Pine and Nelson2009). Findings may not generalize to childhood or adulthood. Moreover, peer influence is likely to vary across racial/ethnic groups (Siddiqui, Mott, Andersen, & Flay, Reference Siddiqui, Mott, Andersen and Flay1999). Given the primarily White sample, group sizes were not large enough to test racial differences. Our sample was also enriched for individuals with substance-abusing parents, limiting generalizability to nonproblem samples. Experimental manipulations are also likely to provide a more stringent test of differential susceptibility, which offers a powerful alternative to the current study design (see Special Section of Development and Psychopathology, February 2015). Finally, although our sample size was comparable to other studies examining similar genetic associations in youth (e.g., Kochanska et al., Reference Kochanska, Kim, Barry and Philibert2011; Kretschmer et al., Reference Kretschmer, Vitaro and Barker2014), it still remains a limitation that would benefit from replication with a larger and more diverse sample. Until findings are replicated with a larger and more diverse sample, caution is warranted when drawing inferences.
Despite these limitations, this study offers preliminary prospective evidence supporting the role of GABRA2 variants as markers for greater susceptibility to positive peer influence across adaptive and maladaptive outcomes, consistent with differential susceptibility. Although this study focuses on one gene, it offers support for continued work across other genetic variants, including those in the dopaminergic and serotonergic system. Future work using aggregate genetic profile scores derived from larger samples is likely to address small effect sizes of G × E interactions. In addition, future work exploring the mechanisms through which genetic variants impact susceptibility is important. Though explicit efforts have not been taken to test these mechanisms, prior work suggests that genetic variants may impact reward sensitivity, enhanced attention to emotional stimuli, and sensitivity to social experiences (Pluess & Belsky, Reference Pluess and Belsky2012).
Given that peers can have both positive and negative influences on adolescent behavior, it will also be important to use methodologies that can capture the inherent complexity of social contexts. It may be useful to integrate multiple aspects of the peer context such as delinquency and substance use as well as academic achievement and religiosity using one latent variable. This would allow for a more rigorous test in understanding the form of G × E interactions to determine whether genetic variants increase susceptibility to risk and/or adaptive social contexts within the same model. Moreover, we examined adolescent perceptions of peer prosocial behavior. This has the potential of overestimating the influence of peers (Prinstein & Wang, Reference Prinstein and Wang2005). Although research suggests that the mere perception of peers’ attitudes and behaviors may be especially influential during this developmental period (Steinberg & Monahan, Reference Steinberg and Monahan2007), it will be important that future work include peer reports of their behavior and attitudes.
Another extension of these findings is to examine whether GABRA2 variants increase receptivity to other positive contexts, including clinical interventions. Preliminary work supports genetic moderation of substance use prevention programs as well as parenting interventions for youth with behavioral problems (Bakermans-Kranenburg et al., Reference Bakermans-Kranenburg, van IJzendoorn, Pijlman, Mesman and Juffer2008; Brody et al., Reference Brody, Chen and Beach2013). For example, one study demonstrated that youth carrying specific dopaminergic and GABAergic “risk” variants (including GABRA2 SNP rs279858) who were assigned to a control condition reported more alcohol use compared to those assigned to a preventive intervention and those youth assigned to either condition who did not carry these variants. However, those carrying these same genetic variants reported less alcohol use following the preventive intervention compared to similar youth in the control condition (Brody et al., Reference Brody, Chen and Beach2013), consistent with differential susceptibility.
Moreover, it is likely that specific intervention strategies based on theories of social influence may be particularly beneficial for youth with the GABRA2 minor allele. For example, the use of peer and parent injunctive norms (approval of a particular behavior or attitude) often used to minimize risk-taking behaviors (e.g., Elek, Miller-Day, & Hecht, Reference Elek, Miller-Day and Hecht2006) may be particularly motivating for these youth. Injunctive norms may increase their engagement in normative behaviors given their expectation for social rewards, but decrease their engagement in deviant behaviors because this may pose a risk for social rejection. Similarly, intervention strategies that incorporate mentoring, such as Big Brothers/Big Sisters of America and the Buddy System mentoring program (see Tolan et al., Reference Tolan, Henry, Schoeny, Bass, Lovegrove and Nichols2013), are likely to foster healthy development and increase diversion from risk-elevating behaviors for adolescents with the GG genotype. However, significantly more work in this area is needed with larger and more diverse samples prior to informing specific strategies and stratification of interventions by genotype. These findings support the need for continued research examining the role of specific genetic variants as potential susceptibility factors beyond risk frameworks.


