Introduction
The Ceratitis FAR complex (Barr & McPheron, Reference Barr and McPheron2006) is a group of economically important and morphologically similar African fruit flies (Diptera, Tephritidae) originally including three species: Ceratitis anonae Graham, Ceratitis fasciventris (Bezzi) and Ceratitis rosa Karsch. A fourth species, Ceratitis quilicii De Meyer, Mwatawala & Virgilio, was recently described (De Meyer et al., Reference De Meyer, Mwatawala, Copeland and Virgilio2016). The Ceratitis FAR complex belongs to the subgenus Pterandrus (De Meyer & Freidberg, Reference De Meyer and Freidberg2006) and in particular to the Pterandrus section A as defined by Barr & Wiegmann (Reference Barr and Wiegmann2009). These species have partially overlapping distributions with C. anonae (http://projects.bebif.be/fruitfly/taxoninfo.html?id=56) and C. fasciventris (http://projects.bebif.be/fruitfly/taxoninfo.html?id=63) having a predominantly East – West African distribution and C. rosa (http://projects.bebif.be/fruitfly/taxoninfo.html?id=62) and the newly described C. quilicii having an East – South African distribution (the latter with confirmed records from Botswana, Kenya, La Réunion, Malawi, Mauritius, Mozambique, South Africa, Swaziland, Tanzania and Zimbabwe).
Adult males of the four species can be morphologically resolved on the basis of their leg ornamentations (De Meyer & Freidberg, Reference De Meyer and Freidberg2006; De Meyer et al., Reference De Meyer, Delatte, Ekesi, Jordaens, Kalinova, Manrakhan, Mwatawala, Steck, Van Cann, Vancikova, Brizova and Virgilio2015b). Ceratitis anonae males have the mid leg with a row of long dark, flattened setae ventrally along the entire length of the femur (Figs. 106–109 in De Meyer & Freidberg Reference De Meyer and Freidberg2006). The mid tibia is broadened with feathering dorsally along distal 0.9 and ventrally along the distal 0.8. The mid-leg is largely brownish to brownish-black in color. In C. rosa males (Figs. 198–201 in De Meyer & Freidberg Reference De Meyer and Freidberg2006), the ventral feathering on mid femur is absent (at most there are a few thin and dispersed setulae ventrally). The mid tibia is moderately broadened, anteriorly black with a conspicuous silvery reflection seen when kept under a certain angle and black feathering dorsally along distal 0.75 and ventrally along distal 0.66–0.75. Ceratitis fasciventris males (Figs. 134–137 in De Meyer & Freidberg Reference De Meyer and Freidberg2006) have the mid-leg shaped similarly to C. rosa, except that the mid-tibia is not distinctly broadened and the black feathering is restricted to the distal 0.5 at most. The leg is colored uniformly yellow, except in some specimens where the anterior part is partially brownish in the distal 0.3. The males of C. quilicii can be morphologically distinguished from C. rosa by minor differences of the mid-tibia, with the latter having a broader mid-tibia with black coloration reaching the ventral and dorsal margins of the tibia throughout, while C. quilicii has a more slender tibia, gradually tapering towards the base, and with the black coloration not reaching the ventral and dorsal margins throughout the full length (Fig. 1 in De Meyer et al., Reference De Meyer, Mwatawala, Copeland and Virgilio2016). Adult females of these four species are very difficult to differentiate based on morphological characters. Ceratitis anonae females differ from C. rosa/C. quilicii/C. fasciventris in the pilosity of the anepisternum and fore femur. In C. anonae the anepisternum has some few dark setulae medioventrally, and the fore femur has dispersed short dark setulae between the ventral setae and a posterior row of setae. In C. rosa/C. quilicii/C. fasciventris, the anepisternal pilosity is completely pale and the fore femur usually only has pale setulae present between the ventral setae and a posterior row of setae. Females of C. rosa, C. quilicii and C. fasciventris cannot be reliably differentiated on either morphological (De Meyer & Freidberg, Reference De Meyer and Freidberg2006; De Meyer et al., Reference De Meyer, Mwatawala, Copeland and Virgilio2016) or morphometric bases (Van Cann et al., Reference Van Cann, Virgilio, Jordaens and De Meyer2015). Immature stages of species within the FAR complex cannot be reliably resolved, with the possible exception of C. fasciventris larvae that can generally be separated from C. rosa/C. quilicii and C. anonae by the smaller dimensions of the cephalopharyngeal skeleton and anterior spiracle apical width, and lower counts of spiracular processes and narrowness of their bases (Steck & Ekesi, Reference Steck and Ekesi2015).
Correctly identifying species within the FAR complex is of particular importance with respect to the early detection and monitoring of these pests (Geurts et al., Reference Geurts, Mwatawala and De Meyer2012; De Villiers et al., Reference De Villiers, Manrakhan, Addison and Hattingh2013; Manrakhan et al., Reference Manrakhan, Daneel, Virgilio and De Meyer2017). This particularly applies to C. quilicii and C. rosa, with the latter listed as an A1 quarantine pest species by the European Union, recommended for regulation as a quarantine pest by most regional plant protection organizations. Until recently C. quilicii and C. rosa, have been considered as a single species (also referred to as C. rosa s.l.) so that the currently known ecology and distribution of C. rosa s.s. (e.g. Mwatawala et al., Reference Mwatawala, Virgilio, Joseph and de Meyer2015; Tanga et al., Reference Tanga, Manrakhan, Daneel, Mohamed, Fathiya and Ekesi2015) might not be accurate.
Excluding morphological identification, the available tools for species identification of the FAR complex are rather limited. Standard Sanger sequencing of nuclear and mitochondrial gene fragments (Virgilio et al., Reference Virgilio, Backeljau, Barr and De Meyer2008), including DNA barcoding (Barr et al., Reference Barr, Islam, De Meyer and McPheron2012; Virgilio et al., Reference Virgilio, Jordaens, Breman, Backeljau and De Meyer2012), could not resolve taxa within the FAR complex. Additionally a number of morphological, molecular and biochemical tools (including morphometrics, genomics and the analysis of cuticular hydrocarbons) would be difficult to implement in an applied context and are still not yet fully developed as proper diagnostic tools (Vaníčková et al., Reference Vaníčková, Virgilio, Tomčala, Břízová, Ekesi, Hoskovec, Kalinová, Do Nascimento and De Meyer2014; Van Cann et al., Reference Van Cann, Virgilio, Jordaens and De Meyer2015; Drosopoulou et al., Reference Drosopoulou, Pantelidou, Gariou-Papalexiou, Augustinos, Chartomatsidou, Kyritsis, Bourtzis, Mavragani-Tsipidou and Zacharopoulou2017). Possibly, the only molecular diagnosis allowing a relatively rapid identification of the FAR taxa is represented by a panel of 16 microsatellite markers (Delatte et al., Reference Delatte, Virgilio, Simiand, Quilici and Meyer2013; Virgilio et al., Reference Virgilio, Delatte, Quilici, Backeljau and De Meyer2013) that were previously developed for the species delimitation of taxa within the complex. In this work we propose a simplified, microsatellite diagnosis for the identification of C. rosa and C. quilicii and, after evaluating advantages and shortcomings of the available ID methods, we suggest a decision map integrating morphological and molecular tools for the identification of species within the FAR complex.
Methods
In order to select the most informative microsatellite markers to resolve C. rosa from C. quilicii, we performed a preliminary in silico test on a subset of 312 male specimens of these two species that were previously morphologically identified and then genotyped at 16 polymorphic microsatellite (Virgilio et al., Reference Virgilio, Delatte, Quilici, Backeljau and De Meyer2013). A centered, not scaled principal component analysis (PCA) based on Euclidean distances among multilocus genotypes was implemented through the R-package adegenet 1.3–4 (Jombart, Reference Jombart2008). The squared allele loadings, i.e. the contribution of alleles to each principal component (PC), were used to identify a subset of putatively most informative microsatellite markers. The performance of six of these loci to resolve the target species was first evaluated in silico via STRUCTURE runs (Pritchard et al., Reference Pritchard, Stephens and Donnelly2000, see below for methodological details) and then used for the actual genotyping of 557 trapped females of C. rosa/C. quilicii (primer sequences and laboratory protocols as in Delatte et al., Reference Delatte, Virgilio, Simiand, Quilici and Meyer2013). As female C. rosa and C. quilicii cannot be morphologically resolved (De Meyer et al., Reference De Meyer, Mwatawala, Copeland and Virgilio2016), we re-genotyped 57 of the morphologically identified males of C. rosa (n = 28) and C. quilicii (n = 29) from Virgilio et al. (Reference Virgilio, Delatte, Quilici, Backeljau and De Meyer2013) (supplementary material, SM1). These vouchers were used on one hand as reference genotypes for C. rosa/C. quilicii and on the other to re-calibrate in silico the rest of genotypes of C. rosa and C. quilicii considered in Virgilio et al. (Reference Virgilio, Delatte, Quilici, Backeljau and De Meyer2013). Re-calibration (i.e. standardization of allele calls across different experiments) allowed adding a total of 366 reference male genotypes of C. rosa and C. quilicii from six African countries (Kenya, Malawi, Mozambique, La Réunion, South Africa, Tanzania) (SM1).
Microsatellite chromatograms were scored with Geneious 10.2 (Kearse et al., Reference Kearse, Moir, Wilson, Stones-Havas, Cheung, Sturrock, Buxton, Cooper, Markowitz, Duran, Thierer, Ashton, Meintjes and Drummond2012). STRUCTURE 2.2 (Pritchard et al., Reference Pritchard, Stephens and Donnelly2000) was used to assign individuals to different clusters corresponding to putative morphospecies. The optimal number of STRUCTURE clusters (K) was inferred according to Evanno et al. (Reference Evanno, Regnaut and Goudet2005) and analyses were based on the admixture model (i.e. individuals were allowed to have mixed ancestries from different clusters) with 1.5 × 10⁶ iterations (burn-in = 0.5 × 10⁶). The molecular identification of female queries as either C. rosa or C. quilicii was based on their highest STRUCTURE admixture coefficient (Q) as obtained with K = 2 (see below). In order to reduce possible biases due to false positive identifications, we also introduced a number of arbitrary identification thresholds for the Q values, (no threshold, Q > 0.7, Q > 0.9, Q > 0.95, Q > 0.99). All molecular identifications with Q values below the threshold were discarded as ‘ambiguous’. Possible biases due to the in silico recalibration of part of the reference genotypes were verified by repeating the analyses on two different datasets (SM1): the first, dataset A, including only individuals that were actually genotyped during this study (614 specimens, including reference males and query females), the second, dataset B, including these genotypes plus all the in silico recalibrated male genotypes of C. rosa and C. quilicii (923 specimens, in total). As the above-described diagnostic setup was specifically developed to resolve C. rosa from C. quilicii, we also verified possible biases due to the inclusion of species different from the target taxa. For this purpose, a number of additional specimens of C. anonae (n = 3) and C. fasciventris (n = 8) were also re-genotyped and added to dataset B. STRUCTURE analyses were then repeated on this ‘contaminated’ dataset. In all STRUCTURE analyses performed in this study, ΔK (Evanno et al., Reference Evanno, Regnaut and Goudet2005) peaked at K = 2 suggesting that the highest hierarchical level of population structuring included two main genotype groups.
Results
The PCA based on 312 adult males of C. rosa and C. quilicii genotyped at 16 microsatellite markers (Virgilio et al., Reference Virgilio, Delatte, Quilici, Backeljau and De Meyer2013) produced two distinct groups corresponding to specimens from the two species (fig. 1). The projected inertia (%) of the first two PC axes was 15.3 and 4.7%, respectively. The analysis of the squared allele loadings considering the 5% of alleles with the highest contribution to PCs, indicated a subset of six potentially most informative loci (fig. 1). One of them (FAR 5) was discarded due to its poor amplification performance and replaced with FAR 6 (according to the analysis of 10% of alleles with the highest contribution to PCs). This resulted in a final selection of six microsatellite markers (FAR4, FAR6, FAR7, FAR9, FAR11, FAR16) whose performances with respect to the resolution of C. rosa from C. quilicii were tested in silico (SM2). These results suggested that a reduced subset of six out of the 16 microsatellite markers originally considered in Virgilio et al. (Reference Virgilio, Delatte, Quilici, Backeljau and De Meyer2013) could still efficiently resolve C. rosa from C. quilicii. Conversely, further reducing the number of markers from six to three (two random subsets tested) produced less defined STRUCTURE assignment patterns (SM2).

Fig. 1. PCA and squared allele loadings of 312 specimens of C. rosa (red) and C. quilicii (blue), previously genotyped at 16 microsatellite markers (Virgilio et al., Reference Virgilio, Delatte, Quilici, Backeljau and De Meyer2013). Genotypes assigned to different genotypic clusters (K = 2) are labeled inside their 95% inertia ellipses and connected to the corresponding group centroids. Bottom left: loading plot of 5% of the alleles with the highest contribution to PCs.
The analysis of the six selected microsatellite loci across dataset B (923 multilocus genotype including 557 trapped females of C. rosa/C. quilicii and re-genotyped and re-calibrated reference males) yielded numbers of alleles ranging from 11 (FAR9, FAR7) to 20 (FAR 11) with average observed heterozygosity values ranging from 0.16 (SD = 0.05, locus FAR9) to 0.65 (SD = 0.14, locus FAR4). The proportion of successfully amplified genotypes ranged from 81.2% (FAR9) to 99.7% (FAR11). Details about allele frequencies and observed and expected heterozygosities are provided in SM3.
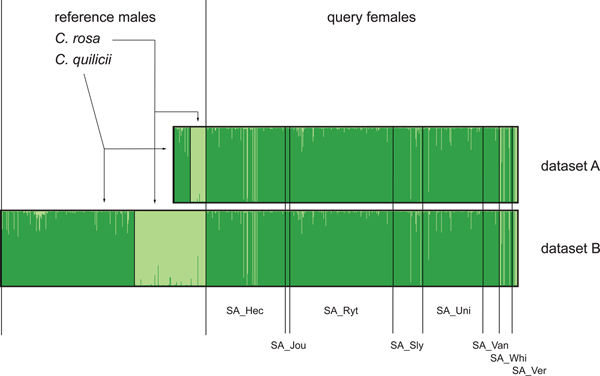
In the bar plots resulting from the STRUCTURE analysis of both dataset A and B (fig. 2, SM4), reference males were assigned to two separate clusters, corresponding to different species, with average admixture coefficients (as calculated from dataset B) of Q = 0.98 (SD = 0.05) for C. rosa and of Q = 0.97 (SD = 0.06) for C. quilicii. When considering dataset A (614 specimens), all reference males were correctly assigned either to C. rosa (n = 28) or C. quilicii (n = 29). Similarly, all reference males of dataset B (923 specimens) were correctly identified as either C. rosa (n = 128) or C. quilicii (n = 238). Out of the 557 trapped females, 20 were identified as C. rosa and 537 as C. quilicii. The percentage of identifications discarded as ambiguous increased with more restrictive thresholds (Q > 0.70, Q > 0.90, Q > 0.95, Q > 0.99) and ranged from 2.9% (Q > 0.70) to 24.9% (Q > 0.99) for C. rosa and from 0.8 to 25.8% for C. quilicii (fig. 3, SM4).

Fig.2. STRUCTURE molecular diagnosis of 557 trapped females of C. rosa and C. quilicii. Analyses were repeated by considering 57 re-genotyped reference males of C. rosa and C. quilicii (dataset A) and 366 cross-calibrated reference male genotypes of C. rosa and C. quilicii from Virgilio et al. (Reference Virgilio, Delatte, Quilici, Backeljau and De Meyer2013) (dataset B). Codes of eight South African trapping site are represented on the x-axis (see SM 1).

Fig. 3. Percentage of molecular IDs discarded as ‘ambiguous’ when considering arbitrary Q identification thresholds ranging from ‘no threshold’ to Q > 0.99.
Including species different from the target species did not seem to bias the identification of the trapped C. rosa and C. quilicii females (that were consistently assigned to these two species). As expected, with K = 2 specimens of C. anonae and C. fasciventris were erroneously identified as C. rosa or C. quilicii. Yet, for K values higher than two, STRUCTURE could not resolve C. anonae, C. fasciventris, C. rosa and C. quilicii while, the molecular diagnosis could at most separate C. rosa from the other three species (SM 5).
Discussion
We previously showed how a set of 16 microsatellite markers (Delatte et al., Reference Delatte, Virgilio, Simiand, Quilici and Meyer2013; Virgilio et al., Reference Virgilio, Delatte, Quilici, Backeljau and De Meyer2013) could profitably delimit species within the Ceratitis FAR complex by resolving five main groups corresponding to C. anonae, C. rosa (initially referred to as C. rosa R1), C. quilicii (initially referred to as C. rosa R2) and C. fasciventris groups F1 and F2 (Virgilio et al., Reference Virgilio, Delatte, Quilici, Backeljau and De Meyer2013). This set of 16 microsatellite markers represents a valuable tool for the identification of all species within the complex independently from sex, life stage and morphological integrity of vouchers (De Meyer et al., Reference De Meyer, Delatte, Ekesi, Jordaens, Kalinova, Manrakhan, Mwatawala, Steck, Van Cann, Vancikova, Brizova and Virgilio2015b). However, for routine analyses, the use of the complete panel of microsatellite markers would be rather expensive and time-consuming as, amongst all, it relies on two multiplex polymerase chain reactions (PCR) (Delatte et al., Reference Delatte, Virgilio, Simiand, Quilici and Meyer2013). Conversely, the reduced panel of six microsatellite markers developed for C. rosa and C. quilicii relies on a single multiplex PCR and on the scoring and analysis of a lower number of microsatellite loci. This simplified molecular diagnosis would allow a more rapid molecular identification of these two species and, in this study, all reference genotypes of C. rosa and C. quilicii were correctly identified as true positives. However, being a tool specifically developed for these two species, it will produce false positive identifications whenever queries not belonging to the target species are erroneously included in the analyses. For this reason, we propose to use the reduced panel of six microsatellite markers in the framework of a decision map integrating morphological and molecular identification tools. This approach takes into account the advantages and shortcomings of the different ID tools currently available for the identification of all life stages and sexes of the four species of the FAR complex (fig. 4). It is well known that DNA barcoding has rather limited capabilities of resolving taxa within tephritid species complexes, including the Ceratitis FAR complex (De Meyer et al., Reference De Meyer, Clarke, Vera and Hendrichs2015a). However, DNA barcoding identification can be profitably used to resolve the FAR complex (as a whole) from its close relatives of the Ceratitis subgenus Pterandrus (Barr et al., Reference Barr, Islam, De Meyer and McPheron2012; Virgilio et al., Reference Virgilio, Jordaens, Breman, Backeljau and De Meyer2012). Therefore, and particularly for samples of problematic morphological ID such as immature stages or damaged vouchers, DNA barcoding could be used as a tool to preliminarily identify the query so to exclude all queries not belonging to the FAR complex. On adult male and females, this preliminary screening might also be implemented via morphological ID, even if this would require more specialized taxonomical expertise (see below).

Fig. 4. Decision map for the morphological and molecular identification of the FAR complex.
Once the list of candidate species is restricted to the four taxa belonging to the FAR complex, the choice of the ID tools should largely depend on life stage and sex of the voucher to be identified. When possible, morphological identification should be preferred as it represents a rapid and effective approach that could be used in the ID of the relatively limited amount of queries. This particularly applies to the relatively straightforward identification of adult males, which in the FAR complex can be separated on the basis of their distinct leg ornamentation patterns and for which dichotomical (De Meyer, Reference De Meyer1996; De Meyer, Reference De Meyer1998, Reference De Meyer2000; De Meyer & Freidberg, Reference De Meyer and Freidberg2006) and/or multi-entry ID keys (https://fruitflykeys.africamuseum.be/, Virgilio et al., Reference Virgilio, White and De Meyer2014) are available. However, the morphological identification of females still remains problematic. In fact, only female C. anonae can be resolved via morphological characters while females from the other three species are almost (C. fasciventris vs. C. rosa/C. quilicii) or completely (C. rosa vs. C. quilicii) indistinguishable (De Meyer et al., Reference De Meyer, Delatte, Ekesi, Jordaens, Kalinova, Manrakhan, Mwatawala, Steck, Van Cann, Vancikova, Brizova and Virgilio2015b, Reference De Meyer, Mwatawala, Copeland and Virgilio2016). In this case, morphological ID could be attempted for C. anonae, while for females of the other three species, the use of the complete set of 16 microsatellite markers of Delatte et al. (Reference Delatte, Virgilio, Simiand, Quilici and Meyer2013) seems to be the only suitable tool to unambiguously identify queries, as the use of the reduced panel of six microsatellite markers will necessarily result in false positive identification of C. anonae and C. fasciventris. Alternatively, ‘forcing’ STRUCTURE to consider more than two clusters only allows resolving the most diverging species of the FAR complex, C. rosa, with the other three species remaining largely unresolved. The risk of accidental inclusion of misidentified specimens not belonging to the FAR complex is higher when considering immature stages. For this reason, the microsatellite ID of larvae of the FAR complex should only be attempted after preliminary barcoding (so to exclude possible non-FAR queries) followed by molecular ID via the extended set of 16 microsatellite markers. Regardless of these limits, the reduced set of microsatellite makers can be profitably used in all those cases where the samples to be identified only include C. rosa and C. quilicii. This was the case of the sampling campaign recently performed in South Africa, where the simplified molecular diagnosis could be used as C. fasciventris does not occur in the trapping area (see the distribution map of this species at http://projects.bebif.be/fruitfly/taxoninfo.html?id=63).
The use of ID thresholds for the Q values does not seem to affect much the performance of identification via the simplified molecular diagnosis as 100% of reference vouchers were correctly identified even when not considering any threshold (0% discarded). For this reason, the user should weigh the costs of discarding the molecular identifications not reaching the threshold (in this study roughly 10% of specimens had to be discarded with a threshold of Q > 0.95) and the benefits of adopting more rigorous standards for identification, according to the same rationale adopted for Best Close Match identification in DNA barcoding (Meier et al., Reference Meier, Shiyang, Vaidya and Ng2006; Virgilio et al., Reference Virgilio, Backeljau, Nevado and De Meyer2010).
The decision map we propose in this work could be beneficial in an applied context, where time and costs represent important constraints. Yet, genomic tools are currently providing unprecedented resolution of tephritid species complexes (Drosopoulou et al., Reference Drosopoulou, Pantelidou, Gariou-Papalexiou, Augustinos, Chartomatsidou, Kyritsis, Bourtzis, Mavragani-Tsipidou and Zacharopoulou2017; Dupuis et al., Reference Dupuis, Bremer, Kauwe, Jose, Leblanc, Rubinoff and Geib2017) and will soon allow developing novel, and possibly rapid and economically affordable, diagnostic tools for the correct identification of pests.
Supplementary material
The supplementary material for this article can be found at https://doi.org/10.1017/S0007485318000615.
Acknowledgements
This study was promoted by ERAfrica, a consortium supported by the European Commission within the framework of ERANET (FP7). The Belgian Science Policy (BELSPO), Belgium, and the Department of Science and Technology (DST), South Africa, are consortium partners providing funding for this study under the ERAfrica Fruit Fly project. The authors would like to thank the two anonymous reviewers for their feedback and comments.