Introduction
It has been well established that peripheral insulin-resistance (IR) is common in adults in late-life, and its relationship to several physiologic actions in the central nervous system (CNS) have been widely reported (Craft, Reference Craft2005). Insulin is produced by pancreatic beta cells and readily crosses the blood–brain barrier into the CNS via insulin-sensitive glucose transporters (Banks, Owen, & Erickson, Reference Banks, Owen and Erickson2012). Insulin receptors have been demonstrated throughout the brain, and they are abundantly expressed in neurons in the cerebral cortex, hippocampus, amgydala, septum, and olfactory bulb (Cholerton, Baker, & Craft, 2013). These receptors are also present in homeostatic and reward pathway brain regions including the hypothalamus, ventral tegmental area, and substantia nigra (Jastreboff et al., 2013). In addition to regulating metabolic processes, and appetitive motivation, CNS insulin plays a critical role in regulating norepinephrine, a neurotransmitter implicated in spatial working memory (Cholerton, Baker, & Craft, 2013) and learning and memory (Spielman & Klegeris, 2014). CNS insulin is also implicated in other cognitive processes, such as executive function (Benedict et al., Reference Benedict, Brooks, Kullberg, Burgos, Kempton, Nordenskjöld and Schiöth2012; Schuur et al., Reference Schuur, Henneman, van Swieten, Zillikens, de Koning, Janssens and van Duijn2010).
IR is a process in which the physiological actions of insulin on peripheral tissues diminish, sometimes as the result of overeating, weight-gain, and reduced physical activity (Ryan, Sheu, Verstynen, Onyewuenyi, & Gianaros, Reference Ryan, Sheu, Verstynen, Onyewuenyi and Gianaros2013). The ability for insulin to cross the blood–brain barrier and affect the CNS also becomes less efficient (Ryan et al., Reference Ryan, Sheu, Verstynen, Onyewuenyi and Gianaros2013), and recent studies have supported the deleterious effects of IR on cognitive function.
IR can also be associated with alterations in brain structure and physiology. Decreased glucose metabolism activity in frontal, parietotemporal, and subcortical regions have been noted on fludeoxyglucose F 18-positron emission tomography (FDG-PET), with corresponding differences observed on an episodic memory task in individuals with increased peripheral IR profiles, particularly on encoding and delayed recall testing (Baker et al., 2011). Structural changes in the presence of elevated IR indices have been observed on brain magnetic resonance (MR) (Willette et al., Reference Willette, Xu, Johnson, Birdsill, Jonaitis, Sager and Bendlin2013). Differences in microstructural white matter have also been recently documented in cognitively healthy adults with greater IR levels, including decreased axial diffusivity in the corpus callosum, frontal, parietal, and temporal lobe fiber tracts (Ryu, Coutu, Rosas, & Salat, Reference Ryu, Coutu, Rosas and Salat2014).
Increasing attention has been given to the role of IR and age related cognitive change. Previous studies have found evidence of global cognitive (Geroldi et al., Reference Geroldi, Frisoni, Paolisso, Bandinelli, Lamponi, Abbatecola and Ferrucci2005) and executive function impairment (Abbatecola et al., Reference Abbatecola, Paolisso, Lamponi, Bandinelli, Lauretani, Launer and Ferrucci2004; van den Berg et al., Reference van den Berg, Dekker, Nijpels, Kessels, Kappelle, de Haan and Biessels2008) in late-life adults with greater levels of peripheral IR. Much less empirical knowledge exists regarding the relationship between IR and latent factors of executive function, however. Moreover, the mechanisms underlying the IR-executive function relationship have yet to be established. Studies have proposed central adiposity as a possible mediator for the relationship (Bove et al., Reference Bove, Brick, Healy, Mancuso, Gerweck, Bredella and Miller2013; Schuur et al., Reference Schuur, Henneman, van Swieten, Zillikens, de Koning, Janssens and van Duijn2010), given its association with IR.
Body mass index (BMI), one measure of adiposity, has been shown to have several negative effects on cognition, particularly on executive function (Boeka & Lokken, Reference Boeka and Lokken2008; Gunstad, Paul, Cohen, Tate, & Gordon, Reference Gunstad, Paul, Cohen, Tate and Gordon2006; Gunstad et al., Reference Gunstad, Paul, Cohen, Tate, Spitznagel and Gordon2007). Increased adiposity activates the release of free fatty acids thereby upregulating proinflammatory cytokines, such as tumor necrosis factor-alpha (TNF-α) (Kern, Ranganathan, Li, Wood, & Ranganathan, Reference Kern, Ranganathan, Li, Wood and Ranganathan2001), resulting in cognitive impairment (Jiang et al., Reference Jiang, Hampel, Prvulovic, Wallin, Blennow, Li and Shen2011). Indeed, it is reasonable to hypothesize the effects of BMI may modify the association between IR and executive function.
The current study focuses on examining the association between IR, indexed by the homeostasis model assessment (HOMA-IR), and specific profiles of executive function. Based on the metabolic and microstructural changes in frontal, parietal, and subcortical regions reported in previous studies, we chose to assess latent factors of working memory and cognitive control to independently examine the relationship between HOMA-IR and separable, but related components of executive function. The associations found between IR and white matter tissue integrity, also led us to examine the relationship between HOMA-IR and processing speed. We further chose to investigate the role of arterial pressure and central adiposity as possible mediators of the IR and executive function relationship.
Methods
Participants
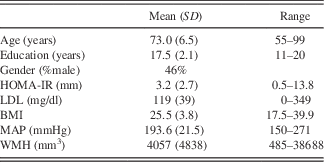
A total of 119 neurologically intact, community dwelling older adult participants (ages: 60–95 years) were recruited from the University of California, San Francisco Memory and Aging Center. Initial screening included an informant interview, a neurological examination, and a cognitive screen. Inclusion criteria included a Mini-Mental State Exam score ≥26, Clinical Dementia Rating score of 0, and no subject or informant report of cognitive decline during the previous year. Exclusion criteria included a major psychiatric diagnosis, a neurological condition that impaired cognition, dementia, mild cognitive impairment, substance abuse, systemic medical illnesses, or current depression (Geriatric Depression Scale ≥15 of 30). Demographic variables are reported in Table 1. Cognitive assessment, blood samples and MRI brain imaging were collected within a 60-day period. The UCSF human subjects committee approved the study. Written informed consent was obtained from all participants following Institutional Review Board approval.
Table 1 Participants (n=119)

HOMA-IR=homeostatic model of insulin resistance; LDL=low density lipoprotein; BMI=body mass index; MAP=mean arterial pressure; WMH=white matter hypointensity; SD=standard deviation.
Cognitive Assessment
Cognitive tasks are listed below and separated into respective cognitive domains for further detail. Tasks included measures of working memory, cognitive control, and processing speed. The testing formats included both computerized and paper-pencil. Computer-based tasks were programmed on a PC using Eprime software (Psychology Software Tools, Inc., Sharpsburg, PA; http://www.pstnet.com/eprime.cfm) and administered on Dell laptop computers with 15” screens.
Working Memory
The working memory factor score derived from a digit span backward task, and several computerized measures designed to assess a participant’s ability to update information rather than manipulate information in short-term memory, including the n-back (1-back, 2-back), Dot Counting and Running-Letter Memory tasks.
Digit span backward
The digit span backward task is a widely used measure of mental manipulation. It contains multiple strings of numbers (2–8) within six trials. Each trial increases by an increment of one digit. Subjects were verbally presented a string of numbers and instructed to repeat the digits in reverse order until the subject failed on two consecutive two trials of the same digit span length.
N-back (1-back, 2-back)
The spatial n-back task is a working memory measure that requires flexible updating abilities. The 1-back requires maintenance and updating of one location at a time, whereas the more challenging 2-back requires maintenance and updating of two locations. A series of squares that appear in 15 different locations on a black computer screen is presented to subjects.
During the 1-back, the subject was instructed to press the left arrow key whenever the square is presented in the same location as the previous one and the right arrow key whenever the square is presented in a different location. Subjects were encouraged to respond as quickly as possible while keeping accuracy. Subsequent squares appeared on the screen after each response is given.
To prevent gaze fixation on the target location, a number (randomly varying from 1–9) appeared in the center of the screen 500 ms after each response. The subject then said this number out loud immediately when it appeared on the screen before responding to the next square. The 1-back consists of one block of 30 trials, 10 of which match the location of the previous square, and 20 that are in a different location.
During the 2-back, the subject is required to press the left arrow key whenever the square is presented in the same location as the square two squares before and the right arrow key if the square is presented in a different location. The 2-back consists of one block of 90 trials, 30 of which match the location of the square two before, and 60 that are in different locations. The dependent variables for the 1-back and 2-back tasks are a d-prime measure that includes both correct hits and correct rejections.
Dot counting
On this task, subjects were required to look at a computer screen with an assorted array of green circles, blue circles and blue squares. They were then asked to count each of the blue circles one at a time and remember the final total. After the subject completed the counting of each blue circle, the examiner switches the display to present a different mixed array of green circles, blue circles and blue squares. The subject was then instructed to count the blue circles in the new display. After all of the blue circles within each trial were counted, the subject recalled the total number of blue circles in each of the different displays in the same order in which they were presented. The number of different displays presented to the subject in each trial increased from two to seven over six trials.
Running-letter memory
Subjects were presented letters in black font against a gray background in the center of the screen. The letters were shown sequentially over six trials at variable rate. Subjects were instructed to report the last four letters in each letter string and then reproduce them in the correct sequence using the mouse. Two practice trials were completed before the outset of the experimental trial. One point was given for each item correctly selected in the correct serial order, respective to the set of the last targets.
Cognitive Control
The cognitive control score derived from Stroop and Design Fluency measures, along with computer-based tasks designed to measure attention and response inhibition, including; Number-Letter and Enclosed Flanker and were used to assess a participant’s ability to monitor conflicting stimuli and responses between competing processes.
Stroop
The Stroop task contains two conditions: Color Naming and Interference. In the first condition, Color Naming, subjects were presented a stimulus with strings of “X”s printed in red, green or blue ink and asked to name the ink color of each string of “X”s. In the second condition, Interference, subjects were presented a stimulus with color words (red, green, and blue) written in incongruent colors and asked to name the ink color in which the words are written. For each condition, subjects were told to work as quickly as possible without skipping any or making mistakes.
Two scores were recorded for each task: the number of correct responses completed in 1 min, and the number of errors made by the subject. The dependent variable was the number of correct responses on the Interference condition after controlling statistically for the number of correct responses made on the Color Naming condition.
Design fluency switching
Subjects were administered the Design Fluency Test Conditions 2 and 3 of the Delis-Kaplan Executive Function System (D-KEFS). Subjects were presented with rows of squares containing an array of dots and instructed to generate novel designs using only four straight lines. Subjects were given 60 s to perform the task. A practice trial, which required the subject to generate three designs, was completed for each condition, before the experimental trials.
Number-letter
For this computer-based task, subjects alternated between classifying numbers and classifying letters, according to a cue presented at the beginning of each trial. One of two cues (number or letter) was presented, followed by a stimulus that entailed a digit-letter pair. Subjects classified the stimuli to indicate number or letter using left or right buttons. Before experimental sessions, practice sessions were completed by each subject, which consisted of four blocks. Each block consisted of 80 trials, yielding 40% switching trials and 60% non-switching trials.
Enclosed flanker
On this computer-based task, the subject was instructed to focus on a small cross in the center of the screen. After a variable duration, a row of five arrows is presented in the center of the screen either above or below the fixation point. Subjects were to determine whether the center arrow was pointing either to the left or right by pressing the left or right arrow key. There are two different conditions during the task: (congruent or incongruent). In the congruent condition, the non-target arrows point in the same direction as the target arrow and in the incongruent trials they point in the opposite direction. Accuracy and median reaction time for total correct congruent and incongruent trials were tabulated. Scores range from 0–10.
Processing Speed Factor Score
The processing speed factor score was derived from several computerized tasks designed to measure reaction time to visual stimuli. Seven visuospatial measures were administered and included 1–4 conditions for a total of 14 task conditions. All tasks used a binary decision—yes/no or left/right. Each task began with 5–10 practice trials. Subjects were required to perform at 70% accuracy before proceeding to the experimental trials. Tasks consisted of Abstract Matching, Distance Judgment, Length Judgment, Mental Rotation, Visual Search, Shape Judgment, Abstract Matching 2.
Abstract matching 1
Three arrays of shapes: two choice arrays—a match and a foil—positioned below a third, sample array were presented to subjects. They were instructed to select one of the two choice arrays most similar to the sample array then press the corresponding button (left or right). The arrays varied by dimension: (shape, number, and color). The match always had one more dimension in common with the sample array compared to the foil.
Distance judgment
Subjects were presented a white circle located in the center of the display screen, and two additional circles (blue and red) located on the left and right hand-sides of the screen, at least one inch away from the center point of a vertical line that intersects the white center dot. The participant had to judge which of the two additional circles was closest to the white central circle, and press the corresponding key (left or right). The distances of the further to the closer dot ranged from 4:1 (easy) to 6:5 (difficult).
Length judgment
Two vertical parallel lines of different lengths were presented to subjects. Subjects were then asked to determine which line was longer and press the corresponding button (left or right). Two conditions were presented and differed by line length (20% or 10%).
Mental rotation
Subjects were shown a letter from the Georgian Cyrillic alphabet. The letter appeared twice on the screen, on the left in its canonical position and on the right in a rotated position. In 50% of the administered trials, the right, rotated letter was a mirror-image of the letter on the left. Subjects were to make judgments as to whether the two letters were identical or mirror-images, after rotation, and then press the corresponding key (yes or no). Two conditions were presented and differed by degrees of rotation of each letter (60° or 120°).
Visual search
Subjects were presented with an assortment of blue circles and green squares. They were then instructed to indicate whether a target (green circle) appeared on the screen and then press the corresponding button (yes or no). Four conditions were presented and differed by number of objects (16 or 24) and presence of the target (with the target or without the target).
Shape judgment
A single shape and two additional shapes below were shown to subjects. They were then told to judge which of the two lower shapes (left or right) was most similar to the shape on top and then press the corresponding button (left or right). Shapes were presented in a different color, but color was not relevant to the choice.
Abstract matching 2
This task was similar to Abstract Matching 1, except that an additional dimension was added (orientation). Three conditions were presented (match and sample equivalent on three dimensions, match and sample equivalent on two dimensions, and match and sample equivalent on only one dimension).
Confirmatory Factor Analysis (CFA)
A three-factor model of executive function was initially proposed and based on Miyake’s independent components of working memory (updating), set-shifting, and inhibition (Miyake et al., Reference Miyake, Friedman, Emerson, Witzki, Howerter and Wager2000). Multiple measures of each cognitive domain were included. Statistical model fit for CFA was determined using standard indices including; (1) χ2 test for non-significance (p>.05), indicating the data are not significantly different from estimates associated with the model; (2) the Comparative Fit Index (CFI), which fit is evaluated by a value of ≥0.95 as good and ≥0.90 as adequate; (3) the Root Mean Square Error of Approximation (RMSEA), which fit is determined by a value of ≤0.05 as good and ≤0.08 as adequate; and (4) the standardized root mean square residual, in which a value of ≤0.08 is considered a good fit.
A secondary factor of processing speed was constrained to be uncorrelated with latent executive function factors. Results showed a relatively good model fit for a three-factor model. The inhibition and shifting factors were not highly distinguishable, however, so these factors were combined. We subsequently tested a two-factor model of executive function consisting of working memory and cognitive control, and this two-factor model provided the best fit for the data based on chi-square and fit indices. These analyses were performed using Mplus 6 (Muthén and Muthén, Reference Muthén and Muthén2010).
Laboratory Measures
Plasma and serum separator tubes were used to collect blood specimens. Tubes were left to clot at room temperature for 30–60 min and placed into EDTA plasma tubes. The blood was then centrifuged at 2500 rpm at room temperature for 15 min. Plasma and serum were stored at −80°C until samples were analyzed.
Low-density lipoprotein (LDL) and fasting glucose and insulin samples were assessed in the University of California Davis Medical Center Clinical Laboratory. After fasting glucose and insulin samples were collected, the HOMA-IR ratio was computed as {[fasting insulin (µU/mL) × fasting glucose (mg/dL)]/405}.
Mean Arterial Pressure
Mean arterial pressure (MAP), the average arterial pressure per cardiac cycle was used to directly target blood pressure, and allow for suitable assessment of organ perfusion. Systolic and diastolic blood pressure were collected, and MAP was then computed using the following formula; MAP=[(2× diastolic)+systolic]/3.
Body Mass Index
Body mass index (BMI) was calculated using the following formula: [weight (kg)/height (m)2], and subsequently analyzed as a continuous variable.
MRI Acquisition and Processing
Magnetic resonance imaging (MRI) scans were obtained on a 3.0 Tesla Siemens (Siemens, Iselin, NJ) TIM Trio scanner equipped with a 12-channel head coil located at the UCSF Neuroscience Imaging Center. Whole brain images were acquired using volumetric magnetization prepared rapid gradient-echo sequence (MPRAGE; repetition time/echo time/inversion time=2300/2.98/900 ms, α=9°).
MRI measures of white matter hypointensity
Quantitative measures of white matter hypointensities (WMH) were derived using FreeSurfer (v5.1) segmentation of T2-fluid attenuated inversion recovery (FLAIR) images. Reconstructed cortical surface models for each participant were manually inspected to ensure segmentation accuracy. After initial FreeSurfer segmentation, scans with estimation errors were edited and re-run through the segmentation program. Final quality check for image artifact and processing errors was performed before the study.
Statistical Analysis
The relationships between HOMA-IR, latent factor scores, demographic variables, vascular risk factors, and WMH were initially measured using Pearson correlations. First, HOMA-IR and latent factor score for processing speed was calculated; we then performed correlations for working memory and cognitive control factor scores. Separate Pearson correlations were then performed to assess the relationship between HOMA-IR and our covariates; demographic variables (age, education, and gender), vascular risk factors (MAP and LDL), adiposity (BMI), and WMH. These analyses were performed to reduce the likelihood of entering highly correlated variables into our regression models.
Linear regression models
We used regression modeling to test assess models of prediction for our latent factor scores, using HOMA-IR as our predictor of interest. The first model included HOMA-IR with our working memory factor score, along with our covariates. Our second model was performed with our cognitive control factor score and covariates. All analyses were performed using Statistical Package for the Social Sciences (SPSS® V.20, IBM, Chicago, IL).
Results
Sample Characteristics
Our sample (n=119) included 46% male subjects with a mean age of 73 (SD=6.5; range: 55.1–99.6) years, and a mean education of 17.5 (SD=2.1; range: 11–20) years (Table 1). The mean HOMA-IR ratio was 3.2 (SD=2.7; range: 0.5–13.8).
Pearson Correlations
Working memory and cognitive control (r’s=.17 and .18, respectively), but not processing speed (r=.02) had some relationship with HOMA-IR and were subsequently used as outcome measures in regression models. HOMA-IR was modeled as our predictor of interest, with demographic variables (age, education and gender), vascular risk factors (MAP and LDL), adiposity (BMI), and cerebrovascular white injury (WMH) included as covariates.
HOMA-IR and Latent Factor Scores
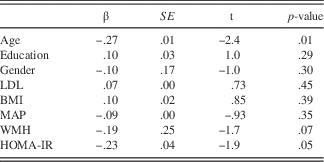
The results of the regression models predicting working memory and cognitive control are summarized in (Tables 2 and 3. After controlling for demographic variables, vascular risk factors, BMI and WMH, a strong trend emerged with HOMA-IR independently predicting working memory (t=−1.9; p=.05). In the model predicting cognitive control, HOMA-IR and WMH both emerged as significant predictors.
Table 2 HOMA-IR and working memory, controlling for multiple confounders

HOMA-IR=homeostatic model assessment of insulin resistance; LDL= low density lipoprotein; BMI=body mass index; MAP=mean arterial pressure; WMH=white matter hypointensity; β=beta; SE=standard error.
Table 3 HOMA-IR and cognitive control, controlling for multiple confounders

HOMA-IR=homeostatic model assessment of insulin resistance; LDL= low density lipoprotein; BMI=body mass index; MAP=mean arterial pressure; WMH=white matter hypointensity; β=beta; SE=standard error.
Discussion
Our major finding was that in functional and neurologically intact normal elderly, HOMA-IR, a marker of insulin resistance, was inversely associated with working memory and cognitive control, but not processing speed. These relationships were evident even after controlling for other vascular risk factors and white matter hypointensities.
These results provide further evidence of the role of IR and executive function in late-life adulthood. Furthermore, the findings suggest increased IR in otherwise neurologically healthy adults may have a differential impact on cognition.
The mechanisms by which IR affects cognition are still unclear. While some studies have suggested a cerebrovascular pathway (Abbatecola et al., Reference Abbatecola, Paolisso, Lamponi, Bandinelli, Lauretani, Launer and Ferrucci2004; Geroldi et al., Reference Geroldi, Frisoni, Paolisso, Bandinelli, Lamponi, Abbatecola and Ferrucci2005), other studies have suggested adiposity as a possible mediator (Bove et al., Reference Bove, Brick, Healy, Mancuso, Gerweck, Bredella and Miller2013; Schuur et al., Reference Schuur, Henneman, van Swieten, Zillikens, de Koning, Janssens and van Duijn2010); however, we found that our markers of vascular risk and white matter injury did not explain the relationship between IR and executive function. Perhaps our study may have benefited from the use of a more sensitive neuroimaging marker, such as diffusion tensor imaging (DTI). As previously mentioned, recent studies have found inverse associations between white matter microstructure and IR using DTI techniques (Ryu et al., Reference Ryu, Coutu, Rosas and Salat2014). Using these methods in our study would have been helpful in capturing subtle changes in cerebral white matter.
It has been proposed that systemic inflammation may be one possible mechanism that impacts cognition in late-life, particularly in older adults with metabolic syndrome (Dik et al., Reference Dik, Jonker, Comijs, Deeg, Kok, Yaffe and Penninx2007). Inflammation has been shown to be associated with white matter changes (Bettcher et al., Reference Bettcher, Watson, Walsh, Lobach, Neuhaus, Miller and Kramer2014) and IR (Shoelson, Lee, and Goldfine, Reference Shoelson, Lee and Goldfine2006). Furthermore, while adiposity is a well-established correlate of inflammation, we did not directly assess proinflammatory factors in our regression models. As such, an alternative mechanism for the IR-executive function relationship could be atherosclerosis, as a result of endothelial dysfunction. Atherosclerosis may cause changes in the microcirculation of arterial branches that irrigate the cerebrovasculature, disrupting the function of normal cognition.
Several limitations of the study warrant discussion. First, all subjects were relatively in good physical condition. This may have contributed to the very low variability in our MRI markers of white matter hypointensity and weakened the chances of detecting differences in our sample. The study may have also benefitted from a more direct measure of central adiposity, such as a waist-to-hip ratio. This may have increased precision in our variable and strengthened the support for our findings.
The cross-sectional design is also a limitation, and precludes ascertainment of causality. Subsequent investigations should focus on a longitudinal design. Also, HOMA-IR is only an estimate of CNS IR based on peripheral markers. While this measurement has been commonly used throughout research to approximate IR, it lacks the accuracy provided by the euglycemic clamp protocol, which directly measures both insulin sensitivity and glucose metabolic efficiency (Tam et al., Reference Tam, Xie, Johnson, Cefalu, Redman and Ravussin2012). Despite these limitations, the study supports the relationship between IR and executive function and extend beyond the current knowledge base linking IR and executive function. Accordingly, controlling IR levels in otherwise neurologically healthy older adults may have substantial benefits for cognitive function. Furthermore, clinical studies focused on halting the progression of cognitive decline may attempt to regulate IR levels in older adults, including those free of neurological disease.
Acknowledgments
This work was supported by National Institutes of Health, Bethesda, MD (AG032289-05). The authors have no financial or any other personal conflicts with this study. Edgar Busovaca helped with imaging processing.