


Hospital surge capacity has been recognized as a fundamental component of emergency preparedness despite a lack of uniform agreement on the definition or metrics of assessment. 1 - Reference Watson, Rudge and Coker 3 Some interpretations limit the scope of hospital surge capacity to include care for an influx of patients using only currently available resources (eg, staffed beds) with no reduction in standards of care. Others have expanded this concept to include alternate or dormant resources, unstaffed beds, and repurposed space that can be rapidly activated in the event of a disaster.Reference Watson, Rudge and Coker 3 , Reference Hick, Barbera and Kelen 4 Consensus from the Society of Academic Emergency Medicine Science of Surge conference adopted the expansive interpretation defining surge capacity as the “maximum potential delivery of required resources either through augmentation or modification of resource management and allocation.”Reference Kelen and McCarthy 2 This interpretation has been further supported by the American College of Emergency Physicians (2012) to emphasize surge capacity as a “measurable representation of ability to manage a sudden influx of patients.” 5 Irrespective of resource flexibility or measurement methods, surge capacity in general must be considered at different levels of the health care system—whether an individual hospital unit, hospital service, care level (eg, intensive care unit), hospital system, provider network, or region.Reference Ferlie and Shortell 6 , Reference Reid, Compton and Grossman 7
Understanding and measuring hospital surge capacity is critical as health care capacity becomes increasingly strained, especially in areas experiencing large population growth (ie, urbanization) or relative isolation (eg, rural settings). A 2008 study demonstrated that a large percentage of the US population on the East and West Coasts resides in counties that do not meet the 500 staffed beds per million disaster-planning benchmark established by the federal Health Resources and Services Administration.Reference DeLia and Wood 8 Furthermore, the absolute number of staffed beds in these counties was decreasing while the number of staffed beds in counties above the benchmark was increasing. Thus, in many jurisdictions within the United States, hospital capacity may not be sufficient to accommodate a large influx of patients.
Emergency planners must know the relative impact of implementing various strategies to generate surge capacity in the event of a disaster. Strategies with potential for relatively rapid activation include deploying unstaffed and unlicensed beds, canceling elective admissions, and expediting discharge (ie, reverse triage).Reference Hick, Barbera and Kelen 4 , 5 , Reference Kelen, Kraus and McCarthy 9 , Reference Einav, Hick and Hanfling 10 Responses to hospital disaster drills and actual multiple-casualty events have shown that bed expansion strategies and patient flow interventions are successful in creating surge capacity well beyond what is available during normal operational conditions.Reference Scarfone, Coffin and Fieldston 11 - Reference Biancolini, Del Bosco and Jorge 18 There are, however, limits to generalizing since different hospitals treat diverse populations, have differing capacities per care level (eg, intensive care) and services (eg, trauma), have different admission and discharge patterns, and function under differing operating conditions (ie, occupancy levels).
To support the proactive estimation of hospital surge capacity before the occurrence of multiple-casualty events, an interactive web-based simulation tool called Surge (http://www.pacerapps.org) was developed by the National Center for the Study of Preparedness and Catastrophic Event Response (PACER). The tool estimates inpatient surge capacity given implementation of various response strategies, independently or in combination. The tool can be scaled from an individual hospital unit to an entire hospital.
METHODS
Hospital Surge Tool Overview
The publicly accessible Surge tool first prompts end users to register for a free account. The user can create one or more profiles for the hospital or other unit they wish to assess. This planning level can be defined as an entire hospital, hospital service (eg, pediatrics, general surgery), intensive care unit (ICU), or inpatient floor unit. The hospital and service levels include both ICU and inpatient floor beds. This design accommodates multiple emergency planner perspectives based on their oversight responsibilities (eg, hospital-wide emergency managers versus hospital-unit leaders versus leaders of an entire medical/surgical service). The application treats floor beds as any bed that is not used for intensive care. It is recognized that in many facilities, certain beds are highly specialized. In the event of a major influx of patients, total potential capacity, however distributed, is the main metric of consequence. If some inpatient beds (eg, psychiatry) are not considered realistic to care for disaster patients, they can be excluded from the user input. In essence, the program is sufficiently robust to allow self-definition, which is useful because different hospitals have distinct characteristics that may not be shared by others. Hereafter, the most comprehensive hospital-level planning scenario will be described.
Operational Inputs
Inputs for user-defined hospitals characterize space and patient flow as described in Table 1. Screenshots of these input sections as they appear in the Surge application are available in Supplemental Figure 1 (Space) and Supplemental Figure 2 (Patient Flow) in the online data supplement.
Table 1 Surge Application Operational InputsFootnote a

a Abbreviations: ED, emergency department; ICU, intensive care unit; LOS, length of stay.
b Service and unit planning levels only.
Space inputs describe the hospital at the specific point in time the emergency response plan is activated. Space during normal operations is the sum of staffed-occupied and staffed-unoccupied beds. These numbers are provided for both ICU and inpatient floor beds separately. For bed expansion strategies, optional data can be input for available unstaffed beds, unlicensed beds, and convertible space.
The Patient Flow input section requests the user to enter the average number of weekday admissions and their average corresponding hospital length of stay (LOS) by admission source. The relevant admission sources change in the application corresponding to the planning level selected. For example, at the hospital planning level, the “internal transfer” admission source is omitted, but this source is present at the service or unit level within a hospital. For hospital and service planning levels, the user is prompted to estimate ICU LOS as a subcomponent of total hospital LOS.
Fixed assumptions based on previously published evidence and recommendations were used in the Surge tool to adjust patient flow inputs reflecting hospital operations for disaster response. For example, the number of routine hospital admissions from the emergency department (ED) has been estimated to decrease by 25% during disaster scenarios.Reference Kelen, McCarthy and Kraus 16 , Reference Schull, Stukel and Vermeulen 19 Elective admissions (same-day surgical and medical) are computed only for weekdays (assumed none occurring on weekends).Reference Ryan, Levit and Davis 20 , Reference Mohammed, Sidhu and Rudge 21 We also assumed that 12% of all standard ED and elective admissions are directed to the ICU according to the results of large-scale studies of ICU utilization and stakeholder feedback.Reference Niska, Bhuiya and Xu 22 , Reference Seymour, Iwashyna and Ehlenbach 23 In addition, to guide reasonable resource and staffing constraints, any increase in the number of beds available (ie, adding unlicensed beds or convertible space) is limited to 20% of total staffed hospital beds.Reference Hick, Hanfling and Burstein 24 , Reference Hick, Einav and Hanfling 25 These fixed assumptions of disaster and hospital dynamics are defined within the Surge application internal code and applied to the end-user-defined admission and LOS inputs. This design was adopted to facilitate ease of use and instill evidence behind parameters commonly unknown to users.
To account for the timing of disaster response, inputs for day of week and time of day are required. Day of week is used to appropriately invoke weekday versus weekend operational assumptions. Time of day enables simulation assumptions about the proportion of admissions that have occurred at the time point of response. These assumptions were developed from administrative data and through discussions and the experience of disaster experts on the author team. For a complete matrix of admission proportions for day 1 of the simulation by time of day and admission source, see Table 1 in the online data supplement.
Disaster Response Strategy Inputs
The user can input the disaster response strategies they wish to activate to determine the effects on hospital surge capacity. The available bed expansion and patient flow strategies are described in Table 2. Bed expansion is considered incremental and additive; for example, expanded capacity to open unlicensed beds includes the sum of the following inputs: staffed, unstaffed, and unlicensed beds. It is assumed that a hospital would logically apply lower risk, less disruptive bed expansion strategies (opening licensed, unstaffed beds) before initiating higher risk ones (opening unlicensed beds), and the algorithm sums this in a stepwise fashion.
Table 2 Surge Application Disaster Capacity Generating Response Inputs

Patient flow strategies consist of reverse triage and elective admission cancellations. Reverse triage is a process of expediting safe discharge of current patients to accommodate anticipated surge in casualties during a disaster.Reference Kelen, Kraus and McCarthy 9 , Reference Kelen, McCarthy and Kraus 16 , Reference Kelen, Sauer and Clattenburg 26 Studies have estimated that during day 1 of disaster response, 20% of ICU patients may be moved to a non-ICU setting,Reference Hick, Chipman and Loppnow 14 , Reference Davis, Poste and Hicks 27 and between 33% and 48% of adult floor patients may be discharged depending on hospital size.Reference Kelen, McCarthy and Kraus 16 Hospitals may also opt to increase their surge capacity by prohibiting inflow of standard (nondisaster) patients, especially through electively scheduled admission sources (Table 2). Users may select the types of admissions to cancel and set the number of future days (from 1 to 7) to maintain this policy.
See Supplemental Figure 3 in the online data supplement for a screenshot of the disaster response section as it appears in the Surge application.
Simulation Algorithm
The inputs for space, patient flow, timing, and disaster response strategies parameterize a Monte Carlo simulation algorithm that estimates surge capacity for the user-defined hospital, service, or unit over a 7-day window. The algorithm depicted in Figure 1 simulates flow of current patients and new standard admissions (ie, non-disaster-related). The hospital surge algorithm initializes with current patients and estimates standard admissions by source daily over the simulation time period. Current patients are input directly by the user (Staffed Beds Occupied; Table 1 and Supplemental Figure 1). The number of new standard admissions each day is estimated for each admission source (Table 1 and Supplemental Figure 2) by sampling from a Poisson distribution with the user-input mean λ.Reference McCarthy, Zeger and Ding 28 Patients’ LOS are estimated from a log-normal distribution with a user-input mean exp(μ + σ 2 /2) and fixed shape σ = 0.5 common to approximating hospital LOS distributions.Reference Marazzi, Paccaud and Ruffieux 29 For current patients, mean LOS is split in half to account for time in the hospital prior to the start of the disaster response (Figure 1). Current patients and standard admissions that occupy ICU beds have an additional ICU subcomponent of total hospital LOS that the user was prompted to enter. After their ICU stay is complete, patients are stepped down to a floor bed for the remaining total hospital LOS.
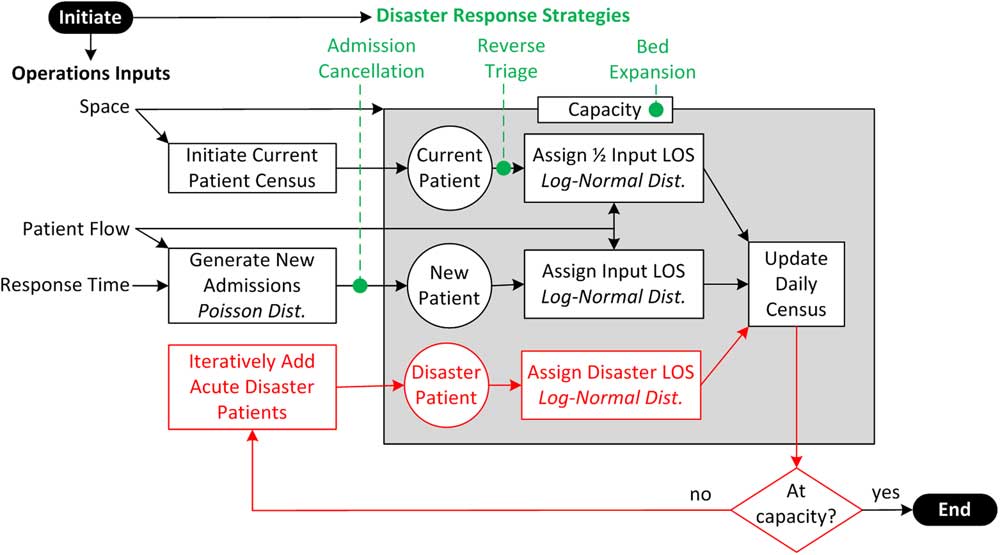
Figure 1 Surge Simulation Algorithm.
Disaster patients are incrementally added on day 1, as may occur in an acute multiple-casualty event (Figure 1; bottom left).Reference Gutierrez de Ceballos, Turegano Fuentes and Perez Diaz 12 , Reference Aylwin, Konig and Brennan 17 , Reference Stratton and Tyler 30 - Reference Karp, Sebbag and Peiser 33 Of these patients, 23% are assigned at random for immediate ICU care; this proportion was derived from several large-scale disaster-related hospital utilization studies.Reference Gutierrez de Ceballos, Turegano Fuentes and Perez Diaz 12 , Reference Biancolini, Del Bosco and Jorge 18 , Reference Kirschenbaum, Keene and O’Neill 32 - Reference Golan, Golan and Alder 35 Disaster victims requiring intensive care are assigned a total hospital stay from a log-normal distribution with a mean of 10 days, and an ICU subcomponent with a mean of 4 days, based on a study of disaster victims in the Israel Trauma Registry.Reference Kluger, Peleg and Daniel-Aharonson 36 Floor disaster patients are assigned a LOS from a log-normal distribution with a mean of 5 days according to findings from disaster studies and national statistics for floor LOS in injury patients.Reference Biancolini, Del Bosco and Jorge 18 , Reference Kluger, Peleg and Daniel-Aharonson 36 , 37 The simulation model runs iteratively, continuing to add disaster patients until it cannot place a new ICU admission or new floor admission due to full capacity at any time during the 7-day window. Once the simulation terminates, the total number of disaster patients that can be accommodated by admission (surge capacity) is reported. The number of admissions, discharges, and midnight census (current patients + new standard admissions + disaster patients - discharges) is computed on each day and displayed in the web-based application. Each of the hospital surge capacity response strategies (Table 2) alter the physical capacity (ie, bed expansion), LOS (ie, reverse triage), or admissions (ie, cancellations) as depicted in Figure 1.
Response Strategy Simulated Experiments
To generalize application of response strategies for different hospital settings, 3 representative hospital profiles were created. The first profile was based on real bed and patient flow data from the authors’ large (1012-bed) urban hospital. The 2 other profiles characterized a midsize (400-bed) community and a small (150-bed) rural hospital using average bed and patient flow data collected from the National Center for Health Statistics and other large-scale hospital utilization studies. 37 - Reference Morganti, Bauhoff and Blanchard 42 Detailed profiles for each of these hospitals may be seen in Table 3.
Table 3 Hospital Profiles (Standard Admissions)Footnote a

a Abbreviations: ED, emergency department; ICU, intensive care unit; LOS, length of stay.
b LOS applied to floor admissions only.
Systematic experiments for individual disaster response strategies (eg, univariate analysis) and combinations of strategies were performed for these hospitals to compute the effects on the primary outcome of surge capacity. This form of sensitivity analysis was conducted by using 1000 simulation runs per experiment, reporting average and standard deviation to minimize the effects of stochastic variance. The experiments were consistently initiated at the same date and time (Tuesday, predawn) for fair comparisons. Bed expansion strategies were applied for 5 simulated days and admission cancellation strategies were deployed for 2 simulated days for consistency.
Software Infrastructure
The Monte Carlo simulation algorithm (Figure 1) was developed in Matlab (Mathworks) and compiled to a dynamic link library to communicate within the middleware structure (C# and Entity Framework) of the application. The middleware functionally links the applications’ web interface (HTML, Javascript, ASP.NET, Google Combo Chart), database (MS SQL), and surge algorithm (Matlab). All hospital profiles were saved and stored in a database on a secure server, available to users at any future time by logging in.
User Community Engagement
In the beta phase of application development, the technology was presented at the First Responder Technology Demonstration as part of the Department of Homeland Security Science and Technology’s Innovation Showcase. End users were given a demonstration of the application, were provided a hands-on tutorial, and then ran simulations for themselves. Additionally, they were given the opportunity to provide feedback, suggest refinements, and make additional requests of developers, to be implemented where feasible.
RESULTS
Hospital Surge Application Output
The primary output was measurable hospital surge capacity, defined as the maximum number of disaster patients that can be admitted to the hospital in an acute mass casualty event. Results from the web interface for a 400-bed midsize community hospital (Table 3) are displayed in Figure 2. Selected disaster responses included (1) opening unlicensed beds for 5 days, (2) implementing reverse triage for the ICU, and (3) canceling elective medical and surgical admissions for 2 days. This resulted in the capacity for 110 disaster surge patients (Figure 2). The patient census from day 1 to day 7 is charted, and the census measure is stratified by disaster (top bar) versus standard patients (bottom bar). Annotations are placed on the census plot for days when floor capacity (“F”), ICU capacity (“I”), or all capacity (“A”) is reached. In this example, the “Expanded Capacity” (solid line) is above “Standard Capacity” (dotted line) for the 5 days of bed expansion. ICU capacity (“I”) was the limiter despite the availability of floor beds. Users can investigate this by filtering the display for ICU beds using the “Treatment Area Filter,” which demonstrates the ICU at capacity during day 1 of the response (Supplemental Figure 4 in the online data supplement). Users have further options to toggle to “Admissions Detail” for stratified admission counts (Supplemental Figure 5 in the online data supplement) and print the graph and admissions report. Users can explore many different responses within the application to understand their effects before a disaster event.
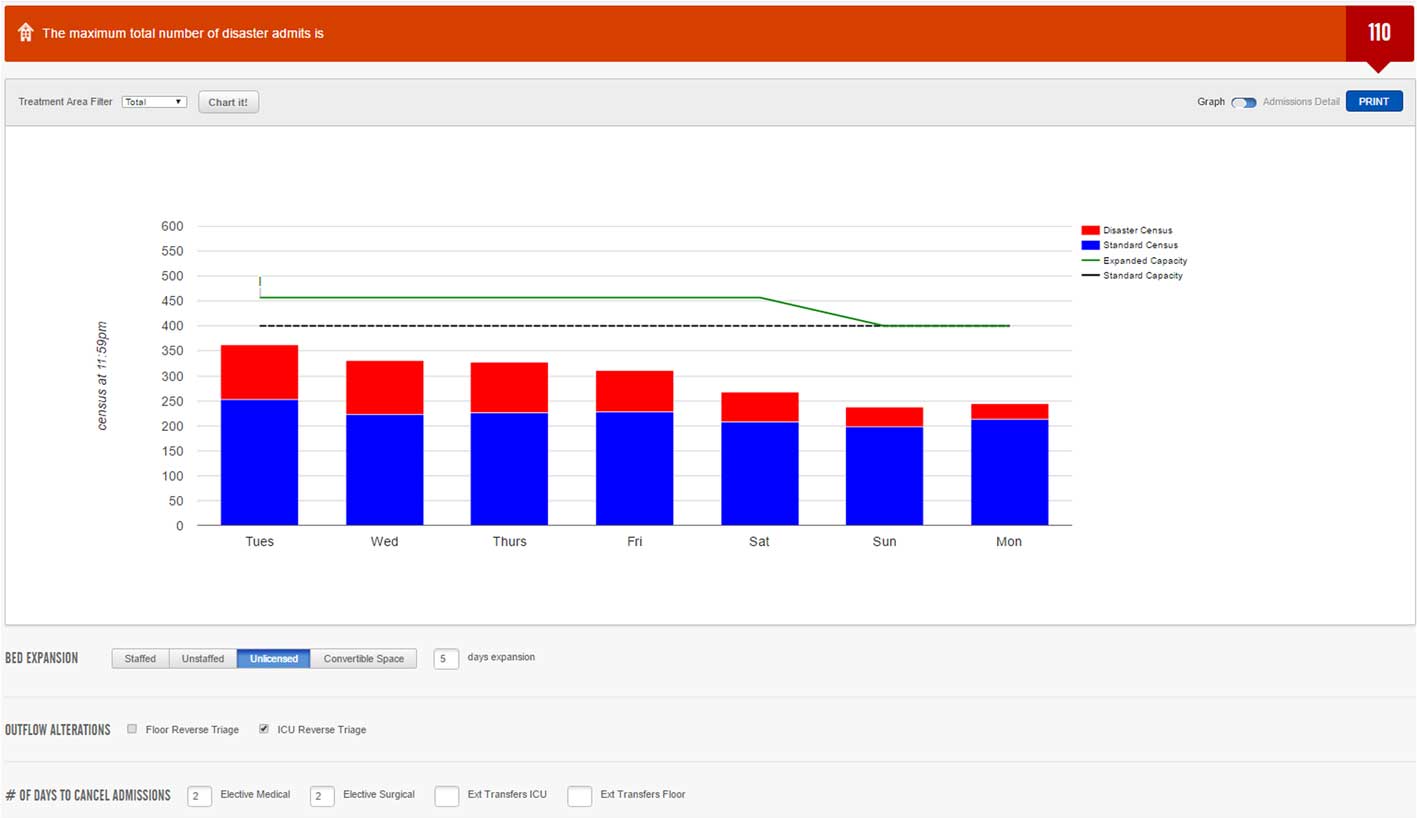
Figure 2 Surge Application Output for (1) Opening Unlicensed Beds for 5 Days, (2) Implementing Intensive Care Unit Reverse Triage, and (3) Canceling Elective Medical and Surgical Admissions for 2 Days.
Hospital Surge Capacity Response Strategy Simulation Experiments
The results of simulation experiments evaluating baseline, admission cancellation (Figure 3), and reverse triage (Figure 4) strategies for the 3 representative hospitals are reported. The dots on the graphs represent the mean of 1000 simulations, with the bars above and below each dot representing the standard deviation.

Figure 3 Simulation Experiment Results for Cancellation Strategies Relative to Bed Expansion.

Figure 4 Simulation Experiment Results for Reverse Triage Strategies and All Strategies Relative to Bed Expansion.
Without expanding physical capacity (ie, staffed beds only) or applying patient flow strategies, surge capacity was estimated between 7% and 22% of staffed beds across hospitals. Each 5% increase in surge capacity implies 51, 20, and 8 beds for the large urban, midsize community, and small rural hospital, respectively. Hospital surge capacity has the potential to increase to nearly 40% of staffed beds when treatment space is expanded and aggressive patient flow response strategies such as canceling electives (Figure 3) and reverse triage (Figure 4) are executed. These results demonstrate relative gains in surge capacity (mean and standard deviation) from baseline given a specific bed expansion plan.
Results for admission cancellation strategies (Figure 3) demonstrate that at baseline, smaller hospitals have a relatively larger proportion of bed capacity due to lower average operating occupancy. Smaller hospitals naturally operate with increased relative variance in census (ie, occupancy) levels. This translated to an increased relative variance (ie, standard deviation bars) in surge capacity compared to larger hospitals. Gains in surge capacity from canceling all elective admissions were 7% to 10% in the large hospital simulation, but were more modest to negligible in the midsize and small hospital.
Figure 4 displays the results of implementing reverse triage strategies. Exclusively performing reverse triage on the floor rarely demonstrated increases in surge capacity from baseline at small and medium-sized hospitals, because the ICU is the limiting resource. At large hospitals, floor reverse triage does provide increased capacity if conducted in tandem with ICU reverse triage. Combined (ie, floor and ICU) reverse triage is most impactful for large hospitals. A similar pattern is exhibited for the effects of implementing all cancellation and reverse triage strategies in combination (Figure 4; triangle). For the most aggressive patient flow strategies, relative maximum gains in surge capacity are most pronounced (increase of between 14.1% and 16.6%) for the large urban hospital, followed by the midsize community hospital (6.9% to 7.6%) and small rural hospital (4.9% to 6%).
DISCUSSION
Surge is a free publicly available tool (http://www.pacerapps.org) developed by PACER to support proactive estimation of hospital surge capacity. Surge enables users to define their hospital, unit, or service and test how implementation of common response strategies may affect surge capacity. The tool was developed to promote ease of use by limiting the detailed data required for input while capturing the important aspects of hospital capacity and patient flow unique to each hospital. Evidence from acute disaster patient utilization and observed response strategies was evaluated and integrated as assumptions into the Surge algorithm.Reference Gutierrez de Ceballos, Turegano Fuentes and Perez Diaz 12 , Reference Hick, Chipman and Loppnow 14 , Reference Kelen, McCarthy and Kraus 16 , Reference Biancolini, Del Bosco and Jorge 18 , Reference Schull, Stukel and Vermeulen 19 , Reference Niska, Bhuiya and Xu 22 , Reference Seymour, Iwashyna and Ehlenbach 23 , Reference Davis, Poste and Hicks 27 , Reference Kirschenbaum, Keene and O’Neill 32 - Reference Kluger, Peleg and Daniel-Aharonson 36 Although these assumptions may vary by mass casualty event, they provide a point of reference and were fixed to allow for exploration of response strategies in a tractable manner.
The objective of conducting systematic experiments using Surge was to illuminate general concepts about surge capacity for diverse but representative US hospitals. The large hospital simulation had lower baseline capacity than the small or medium-sized hospitals, and the capabilities of patient flow response strategies to create flexible gains in surge capacity were more substantial in larger hospitals, especially when these strategies were used in combination. Elective surgery cancellation was the single most effective individual strategy to maximize surge capacity in simulations for the large hospital. This is intuitive because elective admissions make up a higher proportion of patients in large hospitals;Reference Hall and Owings 43 , Reference Gadzinski, Dimick and Ye 44 hence, canceling them creates a greater effect. For small and medium-sized hospitals, ICU reverse triage was the single most impactful patient flow strategy. Smaller hospitals, on average, maintain a lower relative proportion of ICU beds, making reverse ICU triage effective.Reference Halpern, Pastores and Thaler 45 The overall range of surge capacity among all simulations was between 5% and 40% of staffed beds, which is similar to previous projections by emergency planners (10% to 30%).Reference Hick, Hanfling and Burstein 24 , Reference Hick, Einav and Hanfling 25 , Reference Bogucki 46
The Surge tool is novel in its ability for users to rapidly define their own hospitals and interactively support decision-making about institution-specific response strategies. It is helpful to place Surge in the context of previously developed disaster simulations that fit within a broader context of health care operational simulation modeling.Reference Reid, Compton and Grossman 7 , Reference Hamrock, Paige and Parks 47 A related macro-level simulation of pediatric ICUs in New York City found that intensive care capacity might not be adequate in the event of a large-scale disaster.Reference Kanter and Moran 48 Another simulation model was developed to evaluate the effects of an earthquake on casualty volume and hospital access (ie, patient waiting).Reference Yi, George and Paul 49 Also, a combination of simulation and statistical process control methods was used to derive surge capacity metrics in the ED based on simple patient volume and length-of-stay measures.Reference Franc, Ingrassia and Verde 50
Two publicly available simulation tools have been designed to project health care demand resulting from mass casualty events or disease epidemics. The Centers for Disease Control and Prevention (CDC) developed FluSurgeReference Zhang, Meltzer and Wortley 51 to estimate daily demand (ie, number patients and resource use) from a flu epidemic. FluSurge is available as a downloadable Excel (Microsoft Corp) spreadsheet online at the CDC (http://www.cdc.gov/flu/pandemic-resources/tools/flusurge.htm). The Emergency Mass Casualty Assessment and Planning Scenarios (EMCAPS) tool developed by members of our PACER team estimates victims and resource needs arising from biological, chemical, radiological, or explosive attacks.Reference Scheulen, Thanner and Hsu 52 EMCAPS users can specify characteristics of these Department of Homeland Security scenarios to explore the magnitude and severity of casualties. EMCAPS is available online (http://www.pacerapps.org) as part of the same application suite as Surge. An important distinction for these previously developed tools (FluSurge and EMCAPS) is that they produce estimates of demand for health care. Our Surge tool assesses the supply side by estimating health care capacity. Surge complements these tools by determining how much of the estimated demand could exceed baseline capacity and simulating response strategies if necessary.
In addition, a software tool (Hospital Surge Evaluation Tool) was recently developed by RAND Health under a contract with the US Department of Health and Human Services to support live surge capacity drills and tabletop exercises. 53 While this tool can be useful for in-depth study and discussion of surge dynamics at a specific hospital, its time horizon only extends to the first few hours after a disaster, and the drills and exercises require large time and resource commitment. In contrast, the Surge application can be populated with hospital data and executed in a few minutes, the input parameters can be flexibly altered, and the simulations can be repeated quickly. Just as the Surge tool complements disaster demand forecasting tools, its ease of use and longer time horizon may make it a suitable prelude or coda to RAND Health’s drills.
In its current form, the Surge tool does not specifically simulate hospital staffing or supply inventory, although it could be programmed to do so in a future version. It is acknowledged that such resources are necessary for true surge capacity to be attainable even if space is available. One of the strategies embedded in the tool is “reverse triage,” which conserves available resources (space, supplies, staff) and has been shown as potentially effective in both adults and pediatric patients.Reference Kelen, McCarthy and Kraus 16 , Reference Kelen, Troncoso and Trebach 54 Accurately simulating the availability of these staff and supply resources is beyond the immediate scope of this application, but it is advisable for emergency planners to supplement use of this tool with their own specific planning strategies for critical staff and supply resources. Methods of expanding staff capacity include cross-training staff ahead of the disaster, just-in-time training for nonspecialized staff, and augmenting hospital staff with staff from other institutions.Reference Posner, Admi and Menashe 55 - Reference Hick, DeVries and Fink-Kocken 58 Some strategies for managing limited resources include stockpiling ahead of time, conserving usage, substituting functionally equivalent devices, reusing supplies that are cleaned and sterilized, and reallocating or triaging scarce supply use.Reference Hick, Hanfling and Cantrill 56 , Reference Hick, DeVries and Fink-Kocken 58 To guide resource prioritization, a recent expert consensus panel identified 23 discrete staff and supply resources that are critical to maintain normal standards of care across 4 potential disaster scenarios.Reference Bayram, Sauer and Catlett 59 When selecting unstaffed or unlicensed bed expansion in the Surge application, it may be necessary to plan for above-normal patient/staff ratios and adapt supply use to ensure the additional space can be filled while maintaining sufficient standards of care. If selecting convertible space bed expansion, it may also be necessary to consider use of staff outside of specialty areas and to use resource triage for supplies.Reference Hick, Barbera and Kelen 4 , Reference Hick, DeVries and Fink-Kocken 58
The current version of Surge only supports a single, acute multiple-casualty event (eg, explosion, earthquake). Although the current version can be adapted to longitudinal or prolonged surge stress, future versions planned will include protracted events, such as a disease epidemic, and the ability to factor staff and supply resources. The authors have sought feedback from the user community at public conferences and forums and plan to continue soliciting suggestions for future enhancements.
Limitations
There are several limitations of the Surge tool. First, there was a recognized trade-off between usability and flexibility. To ensure ease of use, fixed assumptions were implemented in the algorithm to limit data entry to routinely available operational measures. While users can customize inputs to specific units or hospitals, other components such as specific bed types beyond basic ICU or floor, varying levels of staffing, and resource utilization cannot be modeled. Response strategy dynamics (eg, reverse triage) have been fixed in the simulation because they may be difficult for users to accurately project.
Reverse triage assumptions were based on studies that either combined adult and pediatric populations or were restricted to adult patients. Research on pediatric reverse triage is in its nascent stage, but preliminary results suggest that the magnitude of feasible pediatric reverse triage may be lower than for adults.Reference Kelen, Sauer and Clattenburg 26 Hence, we suggest avoiding simulations of reverse triage in the Surge application for hospitals or units that are mostly composed of pediatric patients.
It remains important to consider the Surge application as only one tool among many in the planning of emergency response. Additional planning methods should be used to ensure necessary staff and supply levels can support the space estimated by the application. Special considerations, such as infection isolation rooms or burn services, are not yet modeled and should also be additionally considered. The algorithm terminates when ICU capacity is exceeded and does not attempt to place patients requiring ICU care in substandard floor beds. Finally, the model does not account for funds required to appropriately resource the capacity realized or damage to the hospital itself from the multiple-casualty event.
CONCLUSIONS
Hospital emergency preparedness requires an understanding of surge capacity and the impact of response strategies to increase innate capacity. The publicly available Surge tool (www.pacerapps.org) enables emergency planners to proactively estimate surge capacity at their local institution to support improved disaster response.
Acknowledgments
The authors thank Joel Cochran and Nitin Patil for their technical assistance in developing the Surge web application.
Funding
This study was supported in part by cooperative agreement 2010-ST-061-PA0001 to the National Center for the Study of Preparedness and Catastrophic Event Response at Johns Hopkins University from the US Department of Homeland Security and by grant 1441209 from the National Science Foundation. The funding agreement ensured the authors’ independence in designing the study, interpreting the data, and writing and publishing the report.
Supplementary material
To view supplementary material for this article, please visit https://doi.org/10.1017/dmp.2017.93


