Introduction
Non-alcoholic fatty liver disease (NAFLD), defined as the cytoplasmic lipid accumulation inside hepatocytes in the absence of relevant alcohol intake,Reference Chalasani, Younossi and Lavine 1 has been considered the main hepatic manifestation of metabolic syndrome (MetS) and whose prevalence has reached epidemic levels worldwide.Reference Younossi, Koenig and Abdelatif 2 Upon sustained injury, hepatocytes start releasing pro-inflammatory cytokines that lead to macrophage infiltration and disease progression to non-alcoholic steatohepatitis (NASH).Reference Day and James 3 These histopathologic and biomolecular changes have been tentatively explained by the ‘Two Hits Hypothesis’ for NAFLD/NASH, according to which the first hit corresponds to steatosis and the second one to the joint factors oxidative stress and cytokines release.Reference Day and James 3
Histopathological criteria for NASH diagnosis include mandatory presence of steatosis, ballooning degeneration and lobular inflammation, with or without perisinusoidal fibrosis on hepatic lobule zone 3.Reference Tiniakos, Vos and Brunt 4 However, physiopathological mechanisms underlying this process are still barely understood, meanwhile available animal models not fully embrace human NAFLD/NASH features.Reference Larter 5 According to Kanuri and Bergheim,Reference Kanuri and Bergheim 6 an ideal animal model should meet two basic criteria: histopathological pattern similar to human NAFLD and steatohepatitis onset occurring under a dysfunctional metabolic milieu. More recently, it has been pointed out that most NAFLD/NASH models do not evolve to more severe stages of liver disease.Reference Tsuneyama, Nishitsuji and Matsumoto 7
Neonatal injection of monosodium l-glutamate (MSG) damages hypothalamic nuclei, for example, arcuate nucleus,Reference Olney 8 , Reference Tanaka, Shimada, Nakao and Kusunoki 9 leading to deficient growth hormone (GH) secretion, as well as autonomic unbalance characterized by decreased sympathetic and increased parasympathetic toni.Reference Holzwarth-McBride, Sladek and Knigge 10 – Reference Sasaki, Kawai and Ohta 12 Consequently, MSG-obese rodents show hyperinsulinemia and reduced serum levels of insulin-growth factor 1 (IGF-1) at ages as early as 4 weeks old,Reference Remke, Wilsdorf and Müller 13 – Reference Yamamoto, Matsuo and Ueshima 15 which precede the development of dyslipidemia, glucose intolerance, hyperleptinemia insulin resistance, central obesity and type II diabetes mellitus (T2DM) at adulthood.Reference Hernandez-Bautista, Alarcon-Aguilar and Del 16 – Reference Dawson, Pelleymounter, Millard, Liu and Eppler 19 Noteworthy, early infant GH deficiency and hyperinsulinemia are thought to predispose to a range of late-in-life chronic conditions due to metabolic programming.Reference Reynolds, Perry and Vickers 20 Thus, those gathered features support MSG obesity as a reliable model to study MetS-related comorbidities under the developmental origins of health and disease concept.
In a previous study, we showed that 16-week-old MSG rats had NAFLD associated to hypertriglyceridemia.Reference Franca, Freitas and Chagas 21 Moreover, it is well documented that 24-week-old MSG mice acquire acute NASH with human histopathologic features,Reference Nakanishi, Tsuneyama and Fujimoto 22 which evolved into cirrhosis around 54 weeks old.Reference Tsuneyama, Nishida and Baba 17 Other studies have also described NAFLD-to-NASH development in MSG mice, but generally in adult to middle-aged animals.Reference Nakanishi, Tsuneyama and Fujimoto 22 , Reference Sasaki, Suzuki and Shimada 23 However, given the early metabolic disturbances abovementioned, we hypothesized that NAFLD onset and progression indeed occur at younger ages. Thus, in this study we sought to characterize the onset of NAFLD in young MSG mice (60 days old) and its evolution into NASH at adulthood, exploring metabolic and histopathological features at three distinct ages.
Methods
MSG neonatal treatment and obesity evaluation
Male Swiss mice (Mus musculus) pups (n=18) were given 4 g/kg/day of MSG (MSG; Sigma Aldrich, St. Louis, MO, USA) via subcutaneous on alternate days during the first 10 days of life. Control animals (CTR, n=19) were given a similar volume of equiosmolar saline solution. Animals were obtained from the Center Animal Facility at Federal University of Maranhão. They were kept at a temperature of 23±2°C, for a 12-h light/dark period, and given water and food ad libitum. Besides, animals were weighed twice a week for assessment of weight gain, and at each 30 days of life, Lee Index was determined, which is calculated by dividing the cube root of the body weight (g) by the nasoanal length (cm).Reference Bernardis and Patterson 24 MSG and CTR groups were divided into three subgroups according to euthanizing age: 60, 120 and 180 days old (CTR/MSG60,120,180).
At the predetermined ages, after overnight fasting, the animals were anesthetized (10 mg/kg xylazine, 40 mg/kg ketamine), weighed for morphometric assessment and subjected to laparotomy to collect periepididymal and retroperitoneal fat pads (PFP and RFP, respectively), and liver. Blood was collected by retro-orbital sinus puncture. All of the protocols were in accordance with international guidelines for animal care and welfare, and were approved by the Committee for Animal Care and Welfare (CEUA) of the Federal University of Maranhão, rule no. 001/2009.
Biochemistry and insulin resistance by TyG index
The blood samples were coagulated and centrifuged to separate the serum. The serum total cholesterol, triglycerides (TG), glucose levels were analyzed using spectrophotometry with the assistance of commercial kits from Labtest (Labtest, Minas Gerais, Brazil), following manufacturer’s instructions. Insulin resistance was assessed by TyG Index analysis, obtained by the following formulae: Ln[fasting triglycerides (mg/dl)×fasting glucose (mg/dl)/2].Reference Guerrero-Romero, Simental-Mendia and Gonzalez-Ortiz 25
Cytokines serum concentrations by flow cytometry
We assessed cytokines (TNF-α and IL-6) serum concentration by cytometric bead assay technique. All utilized reagents were obtained from Mouse Inflammation Kit (Becton Dickinson Biosciences, San Jose, CA, USA). After reading the samples in a flow cytometer, data were analyzed by FCAP Array 3.0 (Becton Dickinson Biosciences), where values were expressed in pg/ml for each cytokine.
Hepatic lipid profile assessment
Samples from liver were homogenized in a chloroform/metanol (2/1, v/v) solution. The homogenate rested overnight and, on the following day, it was filtered with common filter paper. 0.9% saline solution was added to the final solution (1/5, v/v), and the final content was mixed by inversion. After 2 h on rest, the final content was centrifugated (1000 rpm, 5 min). Aqueous phase was discarded and the other one dried in a Petri plate. Thereafter, the amount of fat in each sample was calculated. Total fat (TF) was resuspended in 1 ml of Triton X-100/metanol (2/1, v/v) for TG and TC measurement as described above.
Liver histopathology analysis
Samples from hepatic tissue were fixed in 10% phosphate-buffered formalin solution and they were analyzed by light microscopy either after hematoxilin–eosin (HE) or Masson’s Trichrome staining. NAFLD activity score (NAS) was applied during analysis. This score was validated by Kleiner et al.Reference Kleiner, Brunt and Van Natta 26 and it is based in a semi-quantitative analysis of the three definer criteria of NASH: steatosis (0–3), ballooning (0–3), and lobular inflammation (0–2). Total score is a value that ranges from 0 to 8, which indicates a prognostic status in man/animal liver. Scores >6 indicate NASH; from 3 to 5, borderline (either it can be or not be NASH); and from 0 to 2, it is not NASH. Moreover, there is a fibrosis score, from 0 to 4, which is not considered for total NAS pointing.Reference Kleiner, Brunt and Van Natta 26
Statistical analysis
CTR and MSG groups were compared using Student’s t-test, while MSG subgroups were compared by ANOVA with Newman-Keuls’ post-test. The significance level was established as P<0.05. The results were expressed as the mean±standard error of the mean (except for cytokines, expressed as median) and analyzed using the software Prism 5 (GraphPad, San Diego, CA, USA). Multivariate analysis was performed using the software Stata 14 (StataCorp, Lakeway Drive, TX, USA) for assessing the independent variable related to NAS total value among the following:Reference Hidalgo and Goodman 27 group, age, TG, fasting glycemia, RFP, PFP, Lee Index, hepatic triglycerides concentration, total fat in liver.
Results
Timing of MetS development in MSG group
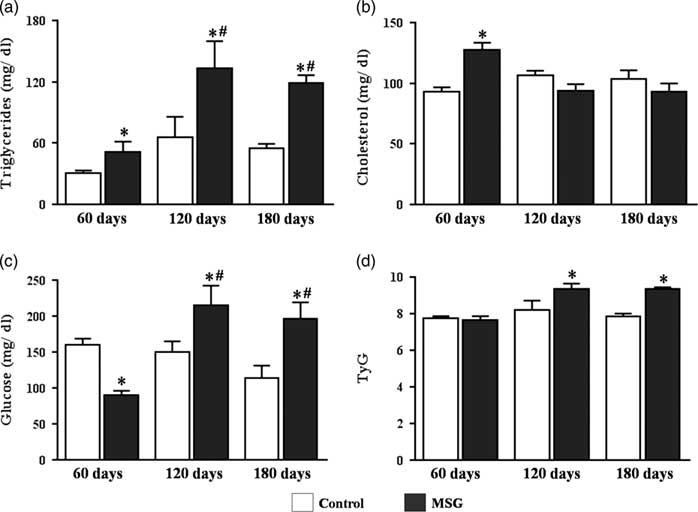
MSG60 mice were lighter than CTR60 because of their shorter nasoanal length, but had RFP and PFP storages at least 2-fold higher, depicting their increased adiposity, which was further supported by the elevated value of Lee Index (Table 1). As showed in Fig. 1a and 1b, MSG60 mice exhibited increased serum levels of TG (50.86±10.75 mg/dl) and total cholesterol (127.7±5.8 mg/dl) as compared with CTR60 (30.45±2.74 mg/dl and 93.33±3.27 mg/dl, respectively), P<0.05. On the other hand, MSG60 were hypoglycemic (90.0±5.9 mg/dl) in comparison with CTR60 (160.0±8.5 mg/dl), P<0.05 (Fig. 1c). Calculation of TyG Index for both groups did not suggest impairment of insulin sensitivity on MSG60 (Fig. 1d), which supports that at this age MSG mice were obese but did not develop MetS.

Fig. 1 Serum profile and insulin resistance evaluation through TyG index. Swiss mice received monosodium l-glutamate (MSG) on the first 10 days of life and were euthanized on the 60th, 120th and 180th day of life. Serum triglycerides (a), total cholesterol (b), fasting glycemia (c) were evaluated. TyG Index (d) was calculated from fasting triglyceridemia and glycemia values. n=5–7, mean±s.e.m., *P<0.05 v. Control (at the same age), # P<0.05 v. 60 days (at the same group). Student’s t-test for MSG v. Control at the same age; ANOVA with Newman-Keuls’ post-test for MSG/Control subgroups.
Table 1 Morphometric parameters of control and monosodium l-glutamate (MSG)-obese mice

RFP, retroperitoneal fat pad; PFP, periepydidimal fat pad; BW, body weight.
n=5–7, mean±s.e.m., Student’s test t for MSG v. Control at the same age; ANOVA with Newman-Keuls’ post-test for MSG/Control subgroups. *P<0.05 v. Control (at the same age), # P<0.05 v. 60 days (at the same group), § P<0.05 v. 120 days (at the same group).
Assessment of the abovementioned parameters showed that weight gain of MSG mice was accelerated, as MSG120 body weight did not differ from CTR120, but became higher on MSG180 (Table 1). A similar acceleration was observed in serum glucose levels, which were decreased in MSG60, but raised in both MSG120 (214.9±27.2 mg/dl) and MSG180 (195.8±23.6 mg/dl) groups in comparison with their controls (CTR120: 150.6±14.1 mg/dl; CTR180: 113.9±17.1 mg/dl) (Fig. 1c). Besides glucose, serum TG reached levels as high as twice their controls at both 120 and 180 days old (Fig. 1a), whereas total cholesterol levels did show no difference between groups (Fig. 1b). Accordingly, TyG Index value was significantly increased at both ages (Fig. 1d), which added to the elevated values of Lee Index (Table 1) jointly support the progression of MSG metabolic disturbances toward MetS onset, as they were obese and further became hyperglycemic, hypertriglyceridemic and insulin resistant.
Hepatic lipid accumulation and NAFLD-to-NASH progression in MSG mice
Livers from control mice were heavier than those from MSG at all ages (Table 1), whereas the latter exhibited higher hepatic total fat accumulation at all ages (Fig. 2c). Hepatic TG content was significantly elevated throughout the evaluated ages, reaching values four-fold higher than controls at 180 days old (CTR180: 31.1±5.5 mg/g of liver and MSG180: 126.6±15.7 mg/g of liver), P<0.05 (Fig. 2a). Surprisingly, hepatic total cholesterol levels did not differ between groups, but rather showed a parallel age-dependent increase in both groups (Fig. 2b).

Fig. 2 Hepatic lipid profile. Samples from control and monosodium l-glutamate (MSG) mice livers were taken to assess lipid profile. The concentration of triglycerides (a), cholesterol (b) and total fat (c) in liver were evaluated. n=5–7, mean±s.e.m., *P<0.05 v. Control (at the same age), # P<0.05 v. 60 days (at the same group), § P<0.05 v. 120 days (at the same group). Student’s t-test for MSG v. Control at the same age; ANOVA with Newman-Keuls’ post-test for MSG/Control subgroups.
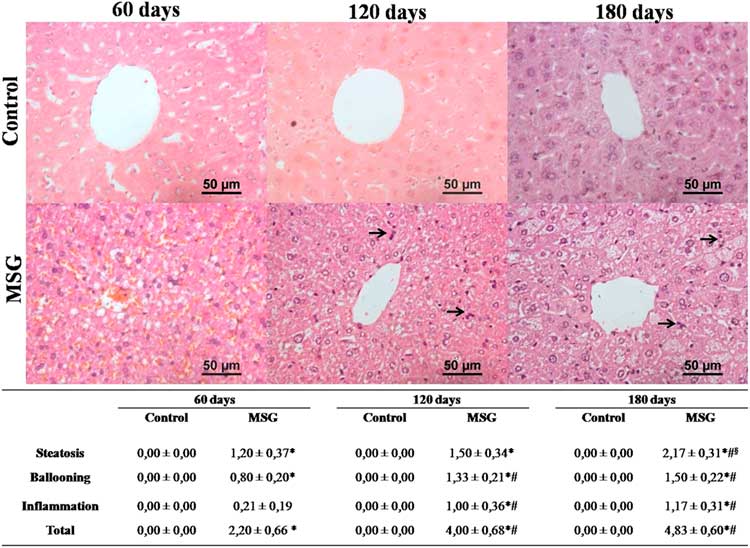
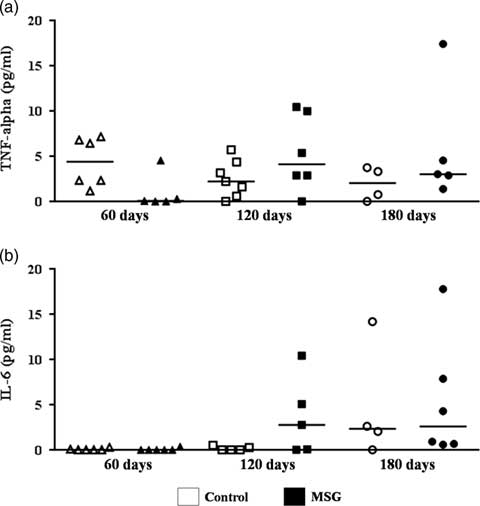
Assessment of NAFLD activity score demonstrated that MSG60 already developed NAFLD, mainly characterized by microvesicular steatosis and occasional cellular ballooning (Fig. 3). In MSG120 group, livers exhibited inflammatory foci of polymorphonuclear neutrophils and macrophages infiltration, besides mild macrovesicular steatosis with ballooning increase, causing liver disease to evolve into NASH (Fig. 3). This condition was aggravated in MSG180, with a two-fold greater steatosis score (Fig. 3) and other histopathological findings, such as microgranulomes and glycogenated nuclei (Fig. 4a and 4b). No fibrosis was observed nor in MSG120 neither in MSG180 (Fig. 4c and 4d, respectively). Despite the inflammatory condition of the liver, no difference has been found for serum cytokines concentration between the groups at any age (Fig. 5). Multivariate analysis was performed to further assess which morphometric and/or metabolic features were correlated to total NAS in each group. R 2 value for this analysis was >70%, which showed that RFP was the only variable to independently correlate with NAFLD-to-NASH progression in MSG-obese mice (Table 2).

Fig. 3 Hepatic histopathology and non-alcoholic fatty liver disease (NAFLD) activity score. Histopathology from control and MSG mice livers was analyzed and NAFLD activity score was applied. Black arrows indicate infiltration foci of polymorphonuclear cells. 400×magnification, H&E stain. n=5–7, mean±s.e.m., *P<0.05 v. Control (at the same age), # P<0.05 v. 60 days old (at the same group), § P<0.05 v. 120 days (at the same group). Student’s t-test for MSG v. Control at the same age; ANOVA with Newman-Keuls’ post-test for MSG/Control subgroups.

Fig. 4 Non-alcoholic steatohepatitis (NASH) lesions and fibrosis absence. Additional lesions were detected on livers from MSG180, such as glycogenated nuclei (a), indicated by black arrow and microgranulomes (b), indicated by dashed arrow; H&E stain. Masson’s Trichrome stain for livers of MSG120 (c) and MSG180 (d). 400×magnification.

Fig. 5 Serum cytokines by flow cytometry. TNF-α (a) and IL-6 (b) concentrations were assessed in serum samples by flow cytometry. n=5–7, median, Student’s t-testfor MSG v. Control at the same age; ANOVA with Newman-Keuls’ post-test for MSG/Control subgroups.
Table 2 Multivariate analysis for cumulative NAS value

RFP=retroperitoneal fat pad; PFP=periepydidimal fat pad.
R 2 value=71.43%.
Discussion
There are many genetic and dietetic murine models for NAFLD study available in literature, but a few display inflammation-associated progression to NASH or histopathological features resembling human disease.Reference Imajo, Yoneda and Kessoku 28 In the present study, we showed that MSG obese mice precociously develop NAFLD, which promptly progressed to NASH, following a time-course consistent with the Two Hits Hypothesis.Reference Day and James 3 Our MSG mice exhibited steatosis at the young age of 60 days old, evolving into inflammation at adulthood (120 and 180 days old), opposing other studies that showed NAFLD onset to occur at older ages in this animal model.Reference Tsuneyama, Nishida and Baba 17 , Reference Sasaki, Suzuki and Shimada 23
Hypothalamic damage consequent from neonatal administration of MSG induces vagus nerve hyperactivityReference Lubaczeuski, Balbo and Ribeiro 29 leading to precocious hyperinsulinemia,Reference Dolnikoff, Martin-Hidalgo, Machado, Lima and Herrera 30 which not necessarily concurs with hyperglycemia.Reference Cameron, Cutbush and Opat 14 , Reference Marçal, Grassiolli and da Rocha 31 MSG60 mice showed fasting serum glucose levels lower than CTR60, suggesting higher peripheral glucose uptake by insulin-sensitive tissues. On the other hand, MSG60 showed nearly two-fold higher fasting serum TG levels, a finding consistent with increased triglyceride exportation from liver. In a previous report, we showed that hypertriglyceridemia displayed by MSG obese rats was possibly correlated with decreased hepatic insulin sensitivity, as the protein expression of the hepatic isoform of microsomal triglyceride-transfer protein, an enzyme responsible for the insulin-dependent assembly and secretion of very-low density lipoprotein (VLDL) particles,Reference Franca, Freitas and Chagas 21 was increased. Assessment of TyG Index in our 60-day-old animals did not show difference between MSG and CTR, suggesting a still preserved peripheral insulin sensitivity in MSG60. However, given the established relationship between hepatic insulin resistance and increased secretion of VLDL particles,Reference Bartels, Lauritsen and Nielsen 32 these results allow us to suggest that increased serum TG levels found in MSG60 resulted from impaired hepatic insulin sensitivity, which might occur before the onset of peripheral insulin resistance caused by the well-known hyperinsulinemia of MSG model.Reference Cameron, Cutbush and Opat 14
MSG60 exhibited elevated fat liver accumulation, mainly characterized by increased TG content inside hepatocytes, which resulted in microvesicular steatosis on zone 3. Even though we have not assessed lipogenic pathways in this study, it is possible to suggest that such lipid accumulation is associated to the triggering of unfolded hepatic protein response, as previously shown,Reference Franca, Freitas and Chagas 21 which also relates to precocious hepatic insulin resistance in the physiopathology of NAFLD.Reference Baiceanu, Mesdom, Lagouge and Foufelle 33 This hepatic condition is known to predispose individuals to T2DM.Reference Hazlehurst, Woods, Marjot, Cobbold and Tomlinson 34 Indeed, MSG120 developed T2DM, with fasting hyperglycemia and peripheral insulin resistance, confirming previous reports in which MSG mice were diabetic around 10 weeks of age.Reference Nagata, Suzuki and Iizuka 18
Hepatic TG deposit enhancement clearly relates to NAFLD onset in MSG60 and steatosis progression in following ages. In human NAFLD patients, it is described that 59% of TG into hepatocytes accrue from circulating lipids, whereas 26% comes from de novo lipogenesis.Reference Donnelly, Smith and Schwarzenberg 35 Hepatic de novo lipogenesis is increased in in vitro hyperinsulinemia.Reference Hazlehurst, Woods, Marjot, Cobbold and Tomlinson 34 In humans, hyperinsulinemia has been shown to be independently associated to NAFLD onset, despite of glycemic status,Reference Rhee, Lee, Cho, Kim and Sung 36 as ‘pre-diabetes’ has been appointed as a precursor of NAFLD.Reference Hazlehurst, Woods, Marjot, Cobbold and Tomlinson 34 Besides, it has also been shown that free fatty acids regulate hepatic TG synthesis through an insulin-independent pathway,Reference Vatner, Majumdar and Kumashiro 37 which might also contribute for this precocious NAFLD development.
At 120 days old, MSG mice were hyperglycemic, meeting the criteria for MetS, as well as showing increased TyG Index, which support the development of peripheral insulin resistance. In humans, TyG Index has been validated as a reliable tool for insulin resistance assessmentReference Guerrero-Romero, Simental-Mendia and Gonzalez-Ortiz 25 , Reference Mazidi, Kengne, Katsiki, Mikhailidis and Banach 38 – Reference Irace, Carallo and Scavelli 40 and as a biomarker to identify NAFLD.Reference Zhang, Du and Li 41 , Reference Simental-Mendia, Simental-Mendia, Rodriguez-Hernandez, Rodriguez-Moran and Guerrero-Romero 42 For mice, this is the first time TyG Index is correlated with NAFLD progression, though it has already been applied for peripheral insulin resistance assessment.Reference Gamboa-Gómez, Simental-Mendía and González-Laredo 43 – Reference Sunil, Shree, Venkataranganna, Bhonde and Majumdar 46 We have not measured serum insulin levels for additional HOMA-IR calculation, even though it is well-documented that MSG obese mice develop hyperinsulinemia since early ages because of increased vagotonia.Reference Lubaczeuski, Balbo and Ribeiro 29 Besides, MSG mice showed low protein expression of glucose transporter 4 in insulin sensitive tissues, which contributed for glucose intolerance assessed at 12 weeks of age.Reference Machado, Shimizu and Saito 47
Despite MSG120 not having an increase in hepatic total fat content in relation to MSG60, hyperglycemia and peripheral insulin resistance onset can explain NAFLD progression, as some studies have correlated T2DM with NAFLD severity.Reference Hazlehurst, Woods, Marjot, Cobbold and Tomlinson 34 To the best of our knowledge, the younger age formerly describing NASH occurrence in MSG-treated mice was at 20 weeks old in SwissReference Sasaki, Shimada and Iizuka 48 or 18 weeks old in C57BL/6JReference Takai, Kikuchi and Kajiyama 49 strains. Therefore, the period between 60 and 120 days comprises crucial events, such as liver inflammation and peripheral insulin resistance, to comprehend this progression. MSG180 essentially exhibited the same scenario as MSG120, but higher hepatic TG storage, as well as larger steatosis and eventual microgranulomes and glycogenated nuclei, markers of hepatocyte injury.Reference Yeh and Brunt 50 Corroborating our study, previous reports have shown that MSG-obese mice liver predominantly exhibits microvesicular steatosis,Reference Tsuneyama, Nishida and Baba 17 , Reference Sasaki, Suzuki and Shimada 23 which constitutes a feature of severity.Reference Yeh and Brunt 50 Noteworthy, none of our mice acquired liver fibrosis. Similar to humans,Reference Argo, Northup, Al-Osaimi and Caldwell 51 fibrosis seems to be a mid-to-long term event in MSG mice non-alcoholic fatty liver progression, as mild fibrosis in this model has been described only over 48 weeks old of age.Reference Tsuneyama, Nishida and Baba 17 , Reference Sasaki, Suzuki and Shimada 23
We next sought to identify what variables were independently associated to the NAS total value on MSG-obese mice. Among all variables assessed by multivariate analysis, RFP was the only to independently correlate with NAS value. RFP is a rodent fat depot whose metabolic role is comparable with human visceral adipose tissue.Reference Chusyd, Wang, Huffman and Nagy 52 Thus, likewise human NAFLD,Reference Chung, Kim and Kwark 53 our data support that visceral adipose tissue is an independent risk factor for NAFLD onset and progression in MSG mice. Despite the well-documented relationship between visceral adipose tissue accumulation and decreased peripheral insulin sensitivity,Reference Bastard, Maachi and Lagathu 54 RFP lipectomy did not improve glucose tolerance in mice.Reference Shi, Strader, Woods and Seeley 55 Contrariwise, increased visceral lipolysis may lead to fat liver accumulation,Reference Thörne, Löfgren and Hoffstedt 56 suggesting the involvement of insulin-independent lipogenic mechanisms on NAFLD pathophysiology.
According to the multiple hits hypothesis, endocrine, immunological and even intestinal factors might gather to promote (or not) the inflammation typically associated to NAFLD-to-NASH progression.Reference Tilg and Moschen 57 In spite of that, our MSG mice did not display altered serum cytokine levels as compared with lean controls, corroborating a previous study which showed that 6-month-old MSG mice had higher hepatic but unaltered serum levels of TNF-α and IL-6.Reference Zhang, Huan and Huang 58 Indeed, MSG rodents have hypercorticosteronemia,Reference Tokuyama and Himms-Hagen 59 which suppresses systemic pro-inflammatory cytokines production.Reference Brattsand and Linden 60 However, MSG rodents also have resistance to corticosterone in adipose tissue,Reference Moreno, Perelló and Camihort 61 and corticosterone excess can induce oxidative stressReference Kratschmar, Calabrese and Walsh 62 and lipid accumulationReference Mueller, Kornfeld and Friedbichler 63 in hepatocytes, which might explain the paradoxical inflammation upon these tissues. We did not assess hepatic cytokines gene or protein levels, constituting a limitation of our study. However, hepatic inflammatory infiltration found in MSG120 and MSG180 mice allows us to suggest an increased production of pro-inflammatory cytokines in MSG hepatic microenvironment. Interestingly, Yamazaki et al. reported the absence of hepatic neutrophil infiltration, but elevated TNF-α gene expression in the liver of 16-week-old MSG mice.Reference Yamazaki, Usui and Kanatani 64
Taken together, our data show that MSG mice display precocious onset of fat liver accumulation and that the period between 60 and 120 days of life comprises a crucial window of physiopathological events involved in NAFLD-to-NASH progression. In this way, our study contributes to the usage of MSG obese model as a tool for future investigations on early molecular mechanisms underlying NAFLD and its mid-to-long term progression toward advanced fatty liver diseases, particularly in the context of early hyperinsulinemia.
Conflicts of Interest
None.
Financial Support
This study was funded by Fundação de Amparo à Pesquisa e ao Desenvolvimento Científico e Tecnológico do Maranhão, FAPEMA (UNIVERSAL 02280/12). C.F.F.C and J.R.N. received fellowships from FAPEMA. C.F.F.C. was funded in a short-time internship by FAPEMA (APEC No. 006/2013). A.P.S.A.S. and F.R.F.N. received researcher fellowship from FAPEMA and CNPq, respectively.
Ethical Standards
The authors assert that all procedures contributing to this work comply with the ethical standards of the Brazilian National Council for Animal Research Care (CONCEA) and has been approved by Committee for Animal Care and Welfare (CEUA) of the Federal University of Maranhão, ruling no. 001/2009.
Acknowledgments
Authors are grateful to Tech. Denise Frediani Barbeiro and Prof. Heraldo Possolo de Souza for their support to C.F.F.C during his short-time internship at the Department of Clinical Emergency of the School of Medicine of the University of São Paulo.