From prehistoric times to the present day, clays have played an important role in agriculture, housework, construction and health, and have also been utilized in various industrial products. Because of their unique physicochemical properties, clays have been utilized as raw materials for ceramics, cosmetics, drilling muds, adsorbents, papers, cements, filtering agents, landfills, medicines, cat litter, etc. (Konta, Reference Konta1995; Chang, Reference Chang2002; Murray, Reference Murray2007; Çelik, Reference Çelik2010; El Ouahabi, Reference El Ouahabi, Daoudi and Fagel2014; Zanelli et al., Reference Zanelli, Iglesias, Domínguez, Gardini, Raimondo, Guarini and Dondi2015). The ceramic industry, which is one of the most ancient, is among the major users of clays (Smoot, Reference Smoot1961).
The rapid growth of the ceramic industry over the years due to greater demand than supply allowed Turkey to become Europe's third-largest and the world's sixth-largest ceramic tile exporter, according to a Turkish Ceramics Federation (TCF) report (TCF, 2009). In a more regional sense, western Turkey, especially Uşak, stands out among all other areas in this respect. However, the increasing consumption and demand for raw materials for ceramic production in Turkey clearly reveal an immediate need for the evaluation of new materials. In this context, two materials – Ukrainian clay (Ukc) and Uşak clay (Usc) – were employed together in this study to carry out an in-depth investigation of their mineralogical, chemical, physical and technological properties in order to evaluate the suitability of Usc as a raw material for production of ceramics. The Ukc, which is very famous in international ceramics markets, has been used widely because of its suitable properties (Dondi et al., Reference Dondi, Guarini, Raimondo and Salucci2003; Zanelli et al., Reference Zanelli, Iglesias, Domínguez, Gardini, Raimondo, Guarini and Dondi2015; Allegretta et al., Reference Allegretta, Pinto and Eramo2016); therefore, it was taken as a reference material in the present study to assess the suitability of Usc for ceramics.
MATERIALS AND METHODS
Ukrainian and Uşak clays , which are used widely for ceramics production were studied. Numerous 10-kg bags of Ukc and Usc samples were collected from piles in a ceramics factory in Uşak, Turkey. In order to achieve greater homogeneity in the samples, the sampling procedure included extraction from a number of parts of each pile and the samples were mixed thoroughly to achieve a composite sample. Approximately 90-kg samples for technological tests and 5-kg samples for mineralogical, geochemical and physical-characterization tests were prepared.
Mineralogical and chemical analysis
The mineralogical composition of the samples studied was determined by XRD analysis, using a Panalytical Expert Pro diffractometer equipped with a Cu tube at a 40-kV voltage and a 30-mA current at the Mineralogy–Petrography Laboratory, General Directorate of Mineral Research and Exploration, Turkey. The XRD traces were obtained in the range 4–70°2θ with a scanning rate of 2°/min. Mineral identification was based on the combined methods of Thorez (Reference Thorez1976), Chen (Reference Chen1977) and Moore & Reynolds (Reference Moore and Reynolds1989). Semi-quantitative mineralogical analysis of both samples was performed using the method based on chemical analysis by XRF.
The clay mineralogy was determined from the clay (<2 μm) fractions which were separated from the bulk samples at the Clay Mineralogy Laboratory of the Engineering Faculty, Mugla Sitki Kocman University, Turkey. The clay-size fractions were analysed by XRD (GNR APD 2000 PRO diffractometer) using a Cu tube operated at a tube voltage of 40 kV and a current of 30 mA over the range 2–30°2θ at a scanning rate of 2°/min, applying air-drying (AD), ethylene glycol (EG) solvation and heating to 500°C in the X-ray Diffraction Laboratory of the Geological Engineering Department at Pamukkale University. EG solvation was used to detect swelling in the clays, whereas heat treatment at 500°C was used to identify the presence of kaolinite.
Whole-rock chemical analysis of the major elements was performed by Thermo ARL XRF on powder pellets at the Analytical Chemistry Laboratory of the General Directorate of Mineral Research and Exploration.
The Ukc and Usc clay samples were also examined by SEM (JEOL JSM-7600F) at an accelerating voltage of 15 kV to identify the micromorphology of the minerals at the Research and Application Centre for Research Laboratories of Mugla Sitki Kocman University. Elemental characterization of the minerals present was performed with energy-dispersive X-ray spectrometry (EDS; Oxford Instruments).
Fourier Transform Infrared (FTIR) spectra were collected at the Mineralogy–Petrography Laboratory of the General Directorate of Mineral Research and Exploration, using a Perkin Elmer Spectrum (version 10.03.07) spectrophotometer. Spectra were recorded in transmission mode over the range 450–4000 cm–1, with a resolution of 4 cm–1 and 10 scan signal averages for each sample.
The cation exchange capacity (CEC) of the samples was measured at the Clay Mineralogy Laboratory of the Engineering Faculty, Mugla Sitki Kocman University, by methylene blue adsorption. Each 50-g clay sample was passed through a no. 200 mesh (equivalent to a 0.074 mm opening sieve) and mixed with 50 mL of distilled water. Methylene blue solution was prepared according to the method of Jones (Reference Jones1964).
Thermal analysis
The thermal behaviour of the Ukc and Usc samples was studied using a Rigaku Thermoflex TG 8110 instrument over the range 25–1050°C at a rate of 10°C/min at the Industrial Raw Materials and Ceramic Materials Research Laboratory of the General Directorate of Mineral Research and Exploration.
Physical properties
The liquid limit (LL), plastic limit (PL) and particle-size distribution of the samples were determined at the Clay Mineralogy Laboratory of the Engineering Faculty, Mugla Sitki Kocman University, using a Casagrande apparatus according to Bowles (Reference Bowles1992). 250 g of each sample was passed through a no. 40 mesh (equivalent to a 0.0165 mm sieve). The plasticity index (PI) was calculated by the difference between the LL and PL.
For the particle-size distribution, the coarse fraction from each sample was separated by wet sieving based on TS 4790 (1986) standards. Silt-size (<63 μm) and clay-size (<4 μm) fractions were measured by hydrometer analysis using a 152 H hydrometer according to Bowles (Reference Bowles1992). To avoid flocculation, 5 g of sodium hexametaphosphate (NaPO3) was added to each sample.
Technological tests
The technological tests on the Ukc and Usc samples were performed at the Industrial Raw Materials and Ceramic Materials Research Laboratory of the General Directorate of Mineral Research and Exploration. Size fractions of <2.8 mm from each sample were prepared to form rectangular prism bodies prism bodies 25 mm × 25 mm × 115 mm in dimension for technological tests. The bodies were dried overnight at room temperature and then were dried again in a furnace first for 4 h at 55°C and then for 24 h at 110°C to determine the linear drying shrinkage and dry-bending strength. To measure the total linear shrinkage, bending strength and compressive strength at various temperatures, each body from the Ukc and Usc samples was fired in a kiln at 800°C, 900°C, 1000°C, 1100°C, 1150°C, 1300°C and 1430°C with a heating rate of 150°C/h. Linear drying and total linear shrinkage values were calculated using equation 1:
 $$\% S_{\rm d} = L_{\rm p} - L_{\rm d}/L_{\rm p} \times 100$$
where S d is the % linear drying shrinkage or total linear shrinkage L p is the length before drying or firing temperatures and L d is the length after drying or firing temperatures.
The bending-strength test was performed at 4.5 N/min load on the dried and fired bodies. The bending strength values were calculated using equation 2:
 $$ M = 3(P \times L)/2(a \times h)^2$$
where M is the dry or fired bending strength (N/mm2), P is the breaking (bending) force (N), L is the distance between supports (mm), a is the width of the breaking point of the body (mm) and h is the thickness of the breaking point of the body (mm) (TS 4790, 1986).
For the compressive strength tests, two new bodies from each sample with 10–15 cm2 surface area and 1.5 cm height were formed by cutting them from the previously fired bodies. The compressive strength test was carried out by applying the stress at the same time to both sides of each body with an increasing pressure rate of 4.9–5.9 bar for every second until body failure. Compressive strength values were calculated using equation 3:
 $$ F_{\rm b} = P_{\rm k}/A_0 = k $$
where F b is the compressive strength of the body (bar), P k refers to the load applied to break the body (N), A 0 stands for the surface area of the body (cm2) and k is the shape factor of the body (standard of 0.5) (TS 4790, 1986).
Colour changes were identified using a Minolta Chroma Meter CR-300 model reflected light colorimeter after firing of the bodies at 800°C, 900°C, 1000°C, 1100°C, 1150°C, 1300°C and 1430°C.
Water adsorption was determined tested after firing the bodies at 800°C, 900°C, 1000°C and 1100°C separately by keeping them in water for 24 h and after boiling them in water for 5 h using TS EN 772-21 (2011) and TS EN 772-7 (2000), respectively.
The unit volume mass property of each body was calculated at 800°C, 900°C, 1000°C and 1100°C using TS EN 771-1 (2012). In addition, the firing status was recorded by naked-eye observation and the hardness of the bodies fired at the aforementioned temperatures was recorded according to the Mohs hardness scale. The percentages of CaCO3 were determined according to TS 4790 (1986) using equation 4:
 $$\% {\rm CaC}{\rm O}_3 = 0.1604 \times \lpar {P.V} \rpar /\lpar {T.a} \rpar $$
where P is atmospheric pressure (mmHg), V is volume of emitted CO2 gas (mL), T is room temperature in K (T°C + 273) and a is the amount of sample (g).
RESULTS
Mineralogical and chemical characterization
The results of XRD analysis of the bulk Ukc and Usc samples are given in Fig. 1a and 1b, respectively. The bulk compositions of both samples have the same mineral assemblages in terms of total clay (including kaolinite and illite), quartz and dolomite (Fig. 1a and 1b). Total clay was identified from the reflections at 4.44–4.48 Å at ~19°2θ. Quartz was identified from the reflection of 3.35 Å at 26.5°2θ and dolomite from the major peak at 2.89–2.90 Å at 31°2θ (Fig. 1b).
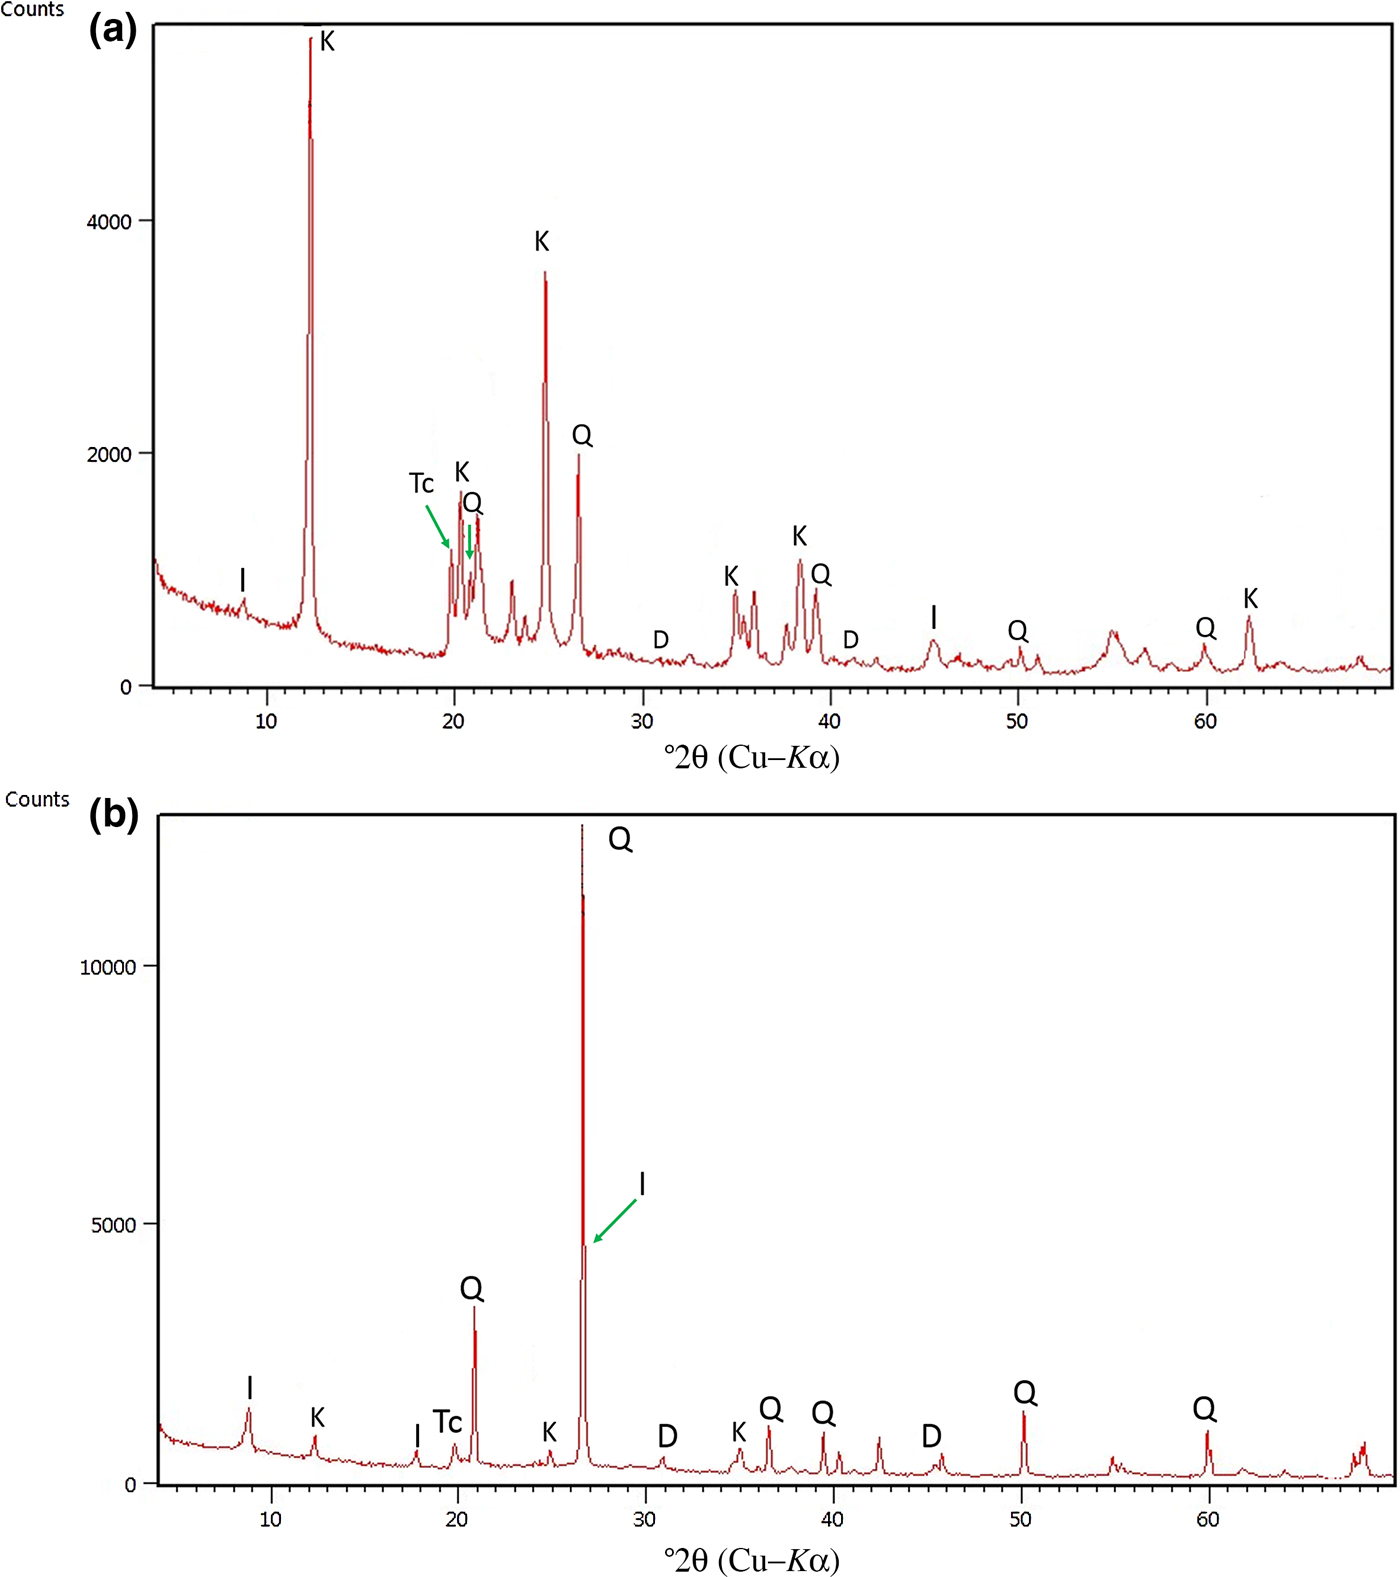
Fig. 1. XRD traces of randomly oriented powders of (a) Ukc and (b) Usc. Q = quartz; D = dolomite; I = illite; K = kaolinite; Tc = total clay.
The clay fractions of Ukc and Usc show very intense reflections of kaolinite at 7 and 3.58 Å (Fig. 2a,b) in AD XRD patterns. Kaolinite did not react with EG, but collapsed after heating at 500°C (Fig. 2a,b). Illite was identified from the 10 Å peak at 8.2°2θ (Fig. 2a,b) in AD conditions; which was not affected by EG solvation and heating to 500°C (Figs 2a,b).
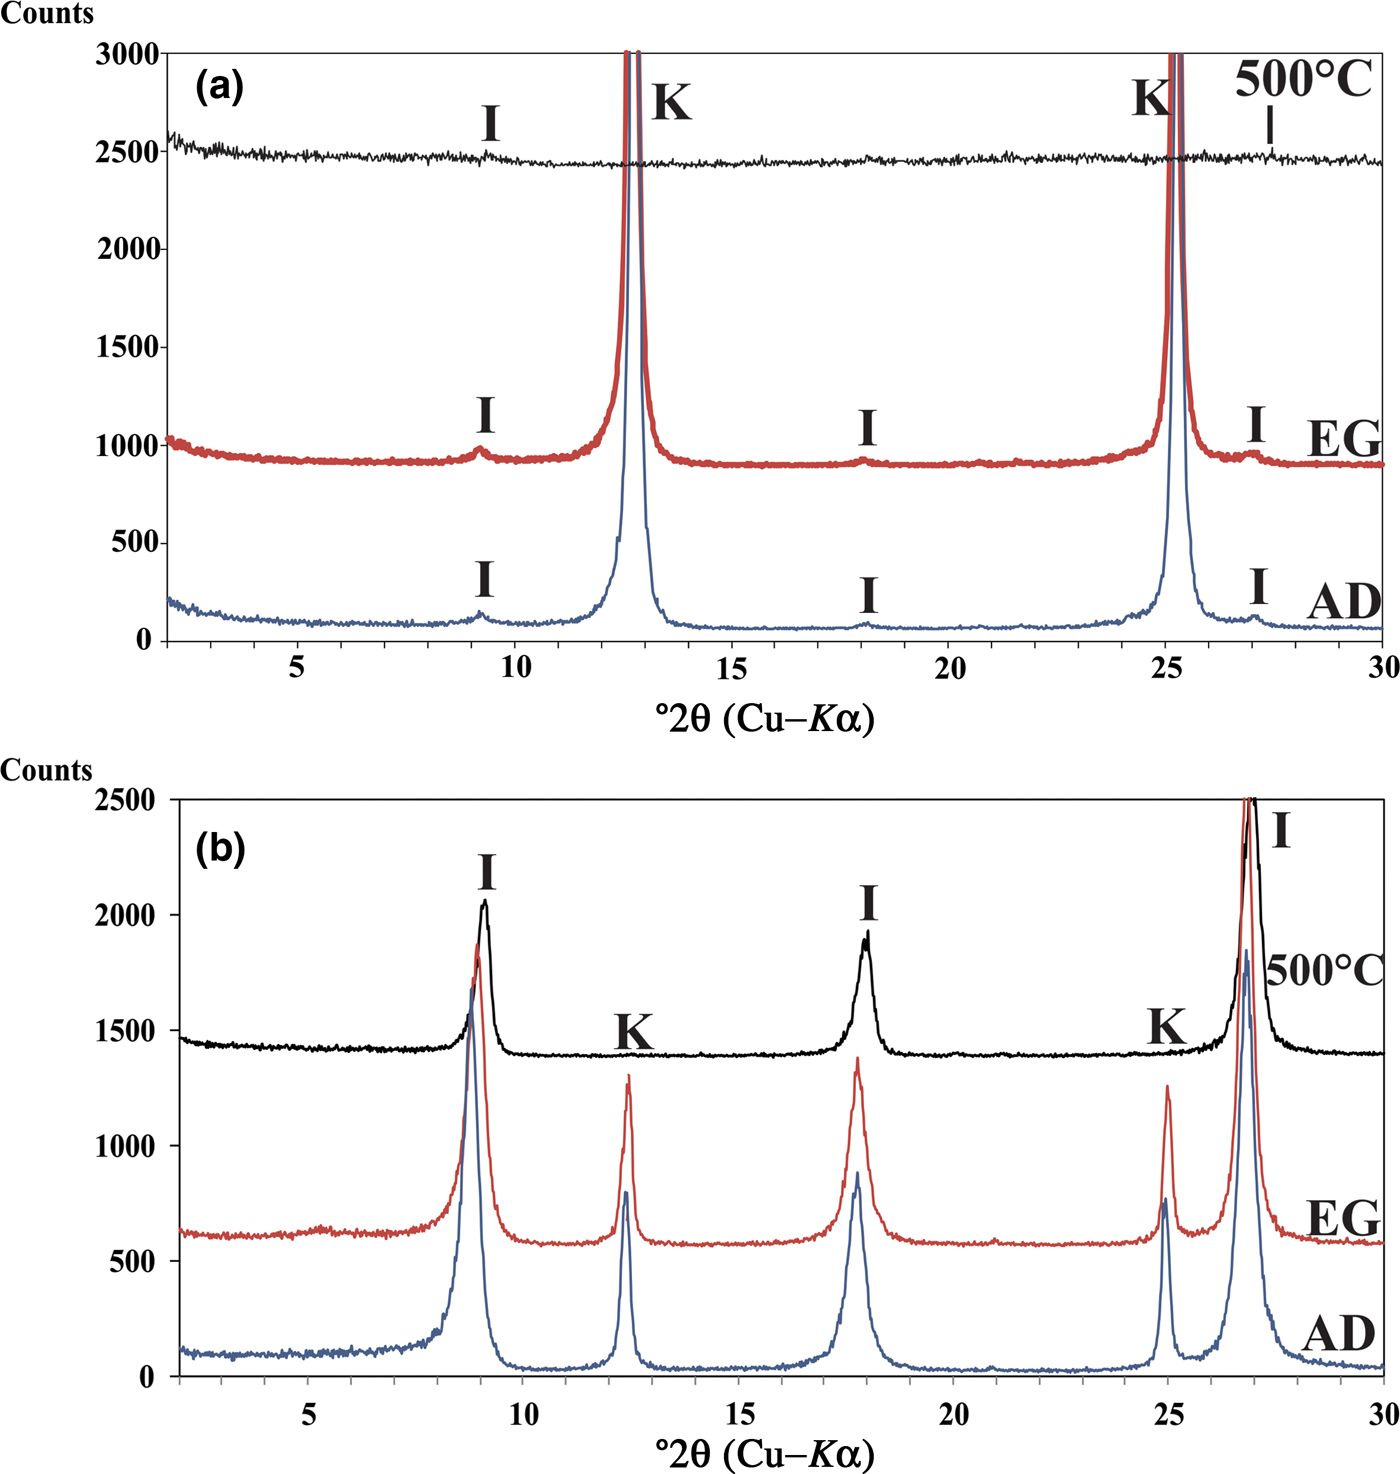
Fig. 2. XRD patterns of: (a) oriented Ukc samples and (b) oriented Usc samples air-dried (AD), ethylene glycol solvated (EG) and heated at 500°C. I = illite; K = kaolinite.
Based on the chemical analysis, the bulk mineralogical composition of the Ukc sample is characterized by the dominance of kaolinite (51%), quartz (35%) and small amounts of illite (8%) and dolomite (6%) (Table 1). The Usc sample, on the other hand, has more abundant quartz (56%) and relatively large amounts of illite (26%) in association with small amounts of kaolinite (12%) and dolomite (6%) (Table 1).
Table 1. Bulk chemical and mineralogical compositions (mass %) of the Ukc and Usc samples.

The results of bulk geochemical analysis by XRF are given in Table 1. Both Ukc and Usc samples are characterized by high SiO2 and relatively low Al2O3 contents. The amount of alkals (K2O and Na2O) is small (1%) in the Ukc sample, represented by the small amount of illite, while it is relatively high (3%) in the Usc sample, confirming the greater amount of illite in the compositions. For both samples, very small amounts of CaO and MgO (2.0% for Ukc and 2.2% for Usc) indicate very small amounts of dolomite in their compositions. In addition, Fe2O3, which plays an important role in colouring the red fired products, is present in very small amounts for the Ukc sample (0.3%) and the Usc sample (1.2%). Other oxides (e.g. CaO, MgO, MnO and TiO2) also contribute to this property (Kreimeyer, Reference Kreimeyer1987) and the degree of firing, together with Al2O3. The relatively high value of loss on ignition (LOI) in the Ukc sample (8.37%) with respect to that in the Usc sample (4.27%) is associated with the larger amount of kaolinite.
Large CaCO3 contents may cause cracks on the fired bodies, calcification in kilns and high porosity and water absorption values, all of which affect directly the quality of the ceramic raw materials (TS 4790, 1986). The CaCO3 contents was 2.0% in the Usc sample and 2.92% in the Ukc sample. The micromorphology of the minerals observed by field-emission gun–scanning electron microscopy (FEG-SEM) is characterized by stacked platelets (‘booklets’) of kaolinites in the Ukc sample (Fig. 3a,b) with almost equal intensities for Al and Si EDS spectra (Fig. 3c,d). The SEM images of the Usc sample show quartz crystals with conchoidal fracture partly coated with kaolinite platelets (Fig. 3e), which is represented by an intense Si peak in the EDS spectrum (Fig. 3g). Additionally, the mosaic form of kaolinite together with filamentous illite were observed in the Usc sample (Fig. 3f), as was shown in the EDS results for both morphologies (Fig. 3h).
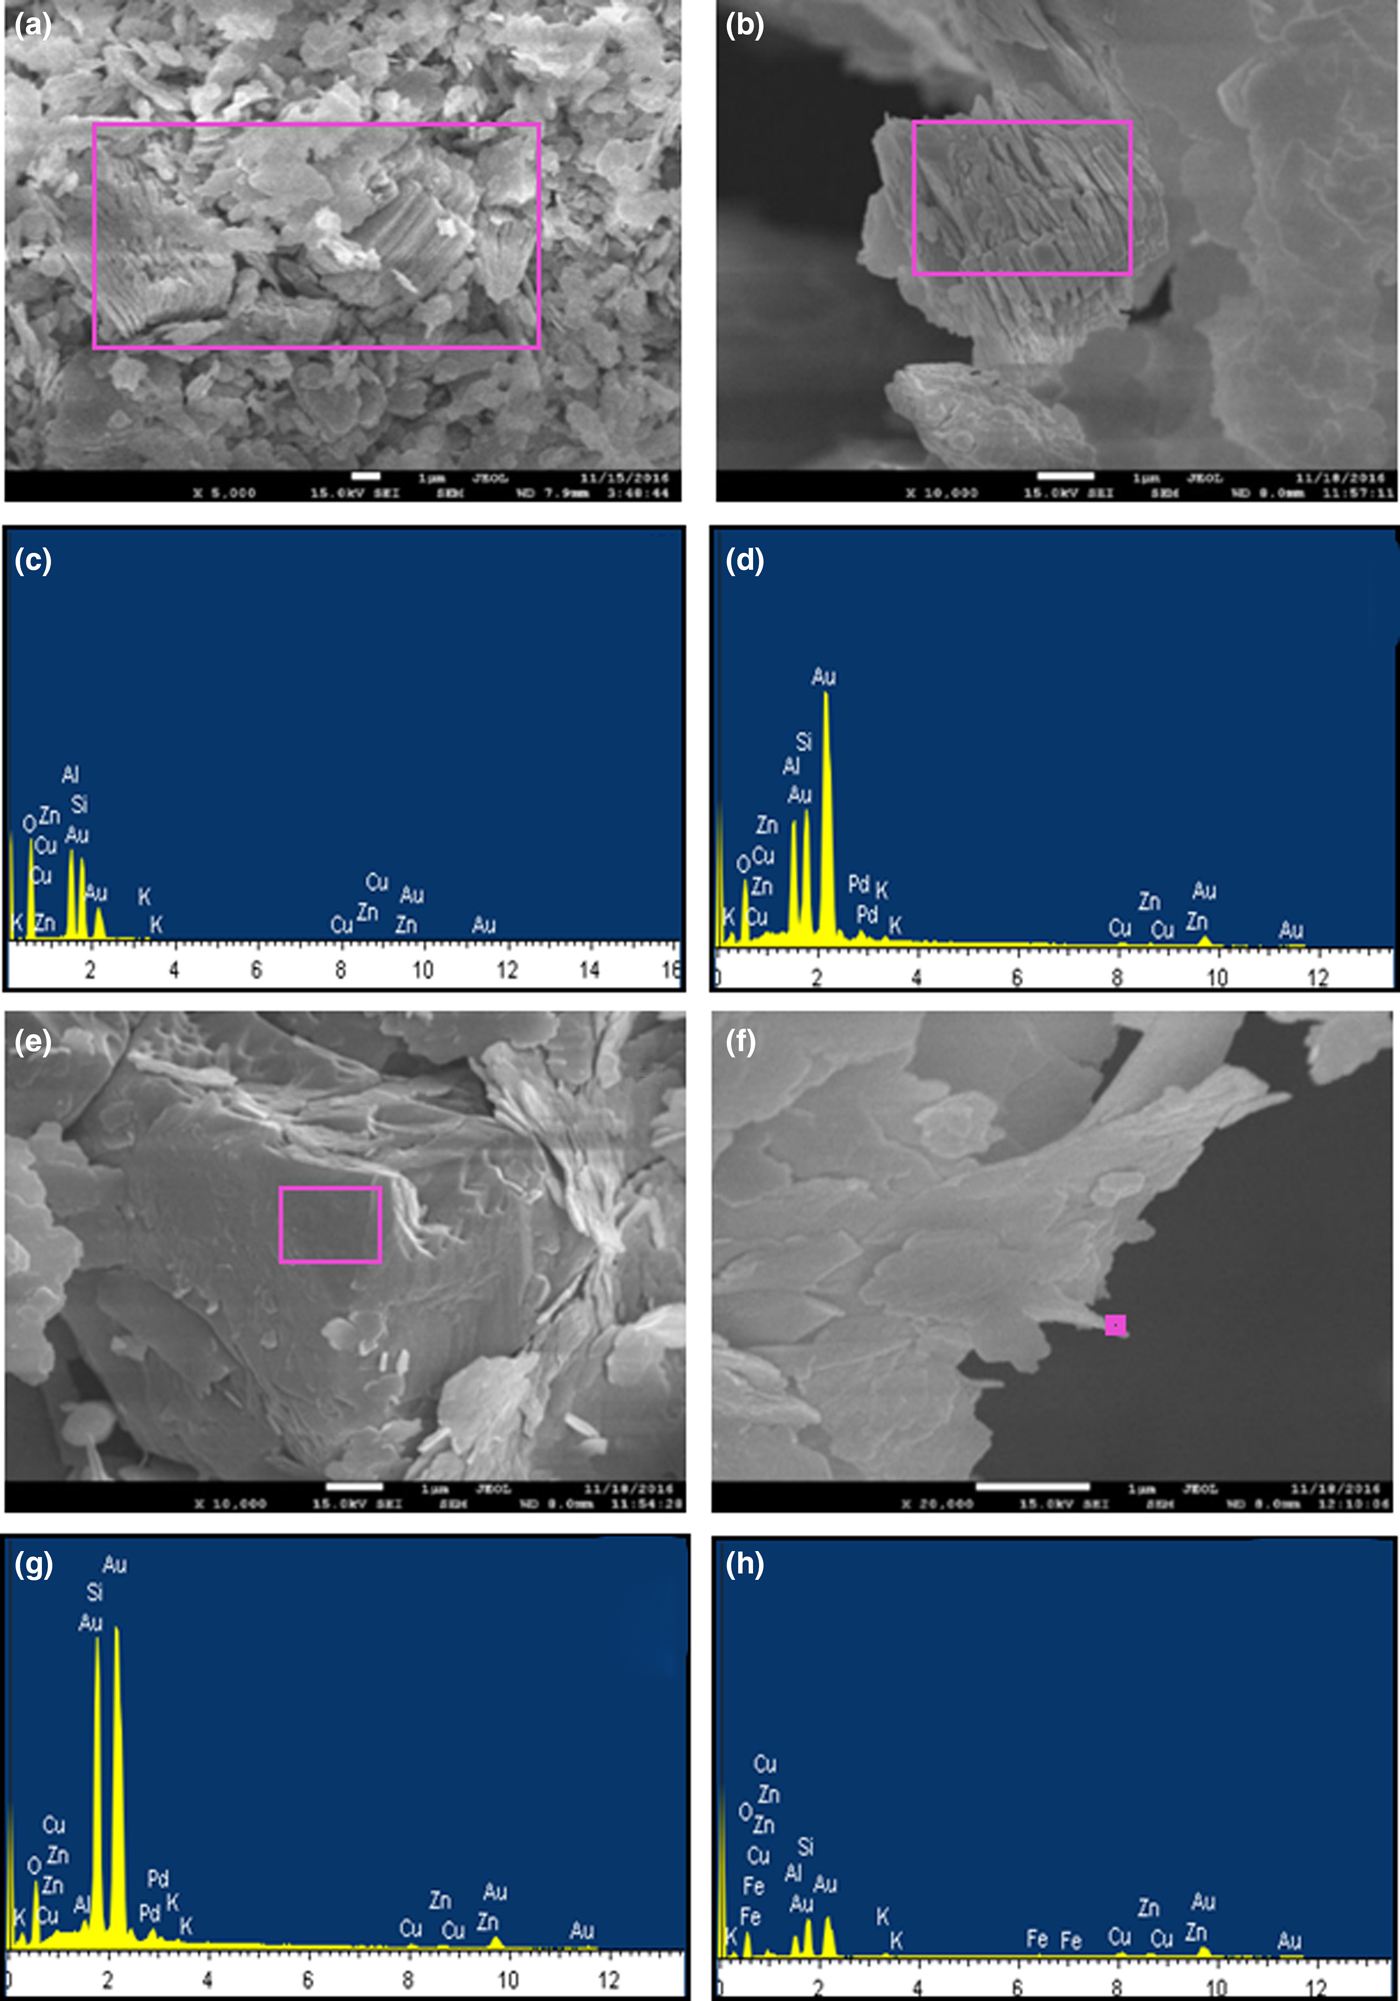
Fig. 3. SEM images and EDS of the Ukc and Usc samples: (a, b) kaolinite booklets in the Ukc sample; (c, d) EDS spectra of (a) and (b); (e) quartz crystals with conchoidal fracture partly coated with kaolinite platelets; (g) EDS spectrum of (e); (f) mosaic form of kaolinite together with filamentous illite in the Usc sample; (h) EDS spectrum of (f).
The results of the thermal analysis of the Ukc and Usc samples are shown in Figs 4a and 4b, respectively. The weak endothermic peak near 100°C for the Usc sample is related to the removal of adsorbed water, which was confirmed by the first mass loss on thermogravimetry (TG) (Fig. 4b). Due to the dehydroxylation of kaolinite and illite, broad endothermic peaks at 505°C and 495°C were observed on differential thermal analysis (DTA) diagrams of Ukc (Fig. 4a) and Usc (Fig. 4b), respectively. These events cause the transformation of kaolinite to metakaolinite (Brindley & Nakahira, Reference Brindley and Nakahira1959). A relatively sharp peak at 568°C for Ukc (Fig. 4a) and a relatively weak one at 565°C for Usc (Fig. 4b) were attributed to the α–β quartz transformation (Grim & Rowland, Reference Grim and Rowland2009). The weak exothermic peak at 1004°C for Usc (Fig. 4b) and a slightly more intense one at 994°C for Ukc (Fig. 4a) are attributed to the formation of mullite (Insley & Ewell, Reference Insley and Ewell1935; Brindley & Nakahira, Reference Brindley and Nakahira1959; Çelik, Reference Çelik2010). Second exothermic peaks were also recorded at >1050°C for the Ukc sample (Fig. 4a) and at 1040°C for the Usc sample (Fig. 4b). The mass losses were ~6.7% for Ukc (Fig. 4a) and 4.5% for Usc (Fig. 4b).
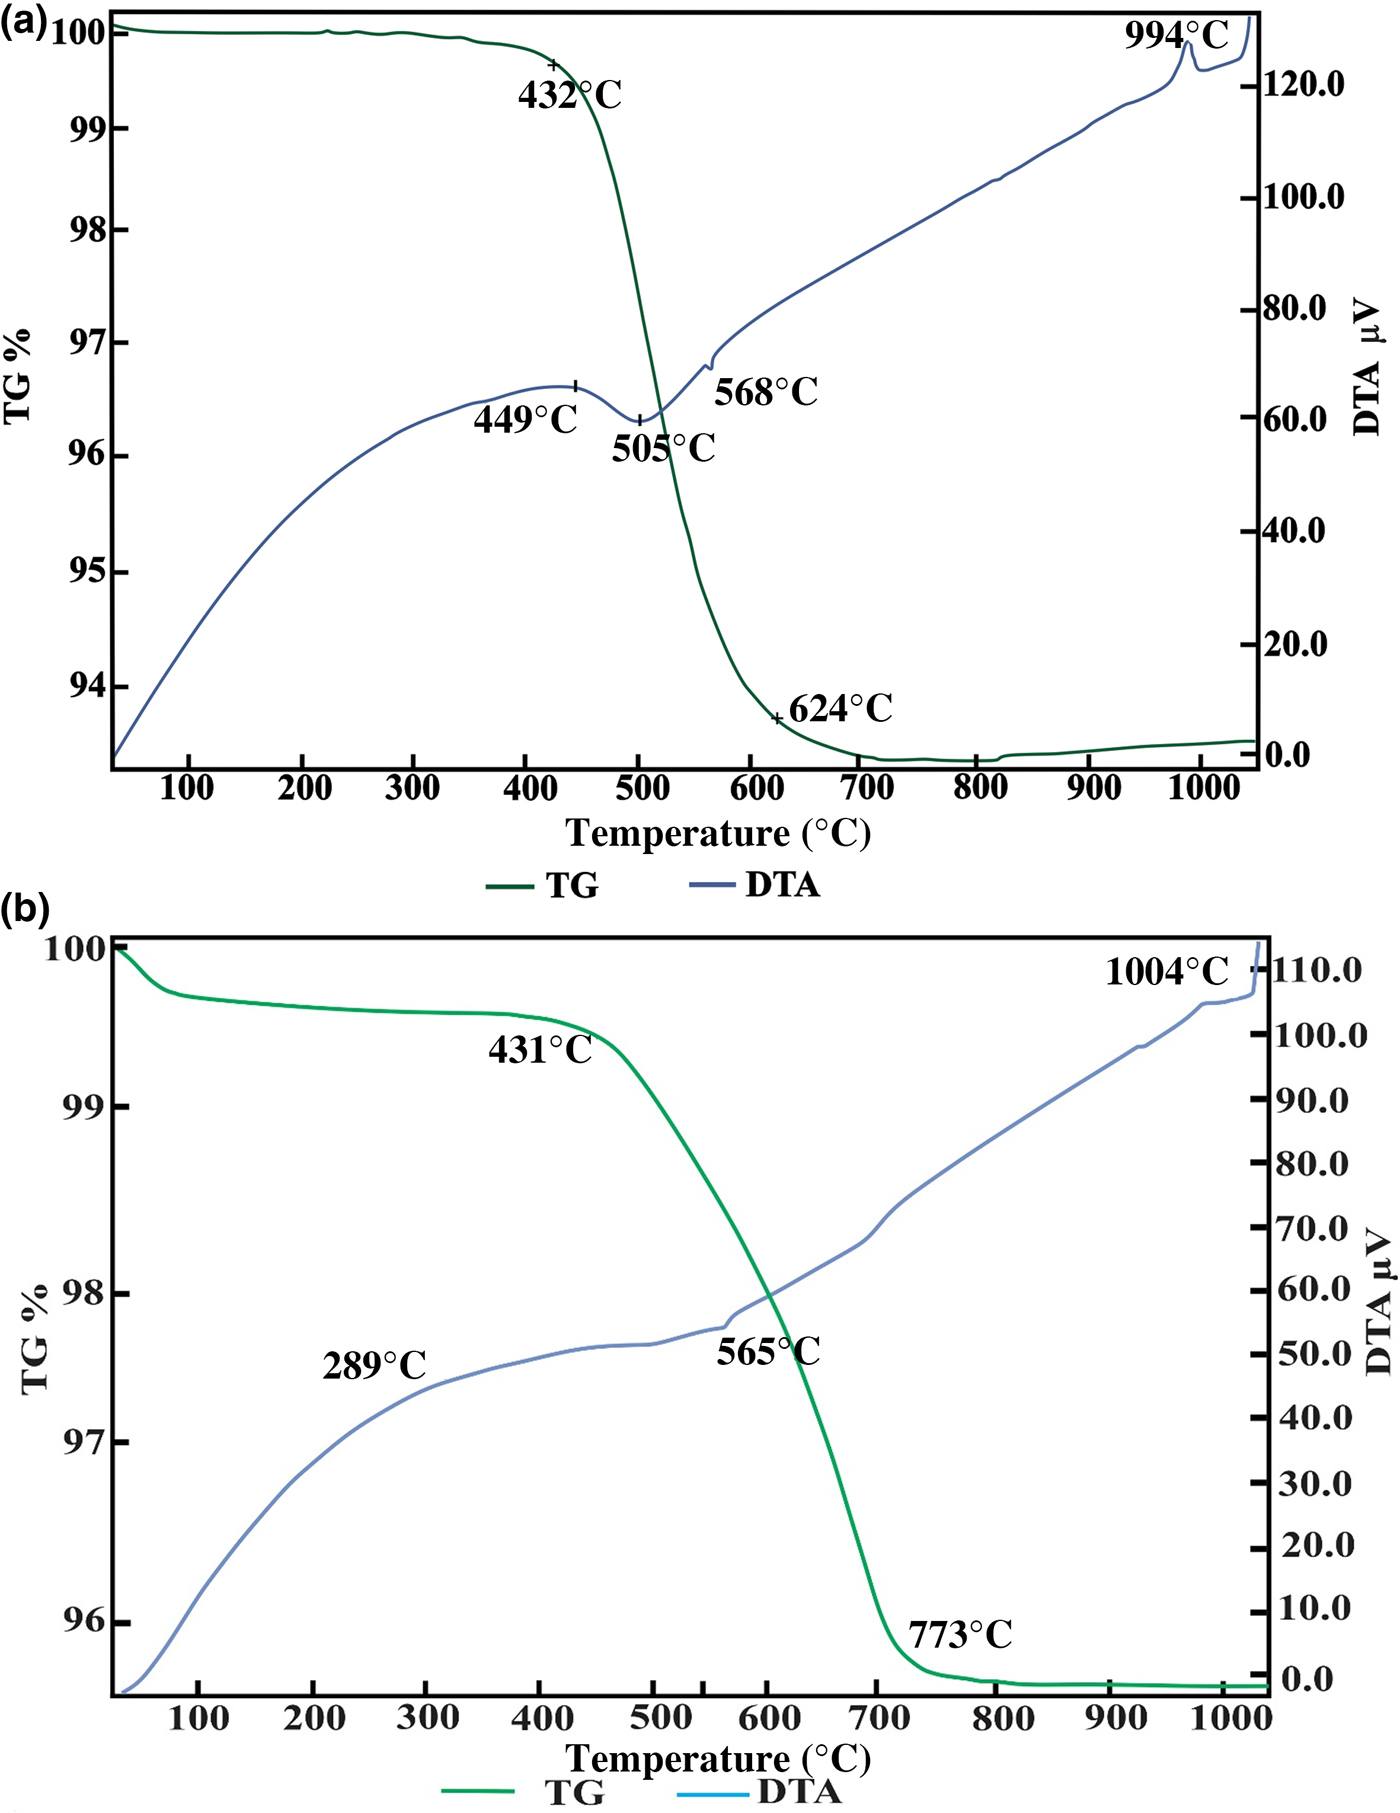
Fig. 4. DTA/TG curves of (a) Ukc and (b) Usc.
The ternary diagram of SiO2–Al2O3–other major oxides of Fabbri & Fiori (Reference Fabbri and Fiori1985) was used to compare the samples chemically with other commercial clay raw materials for ceramics (Fig. 5). On this diagram, the Ukc sample is projected in the same region as the clays of German and English white stoneware, while the Usc sample plots very close to the region for white stoneware from Germany (Fig. 5).
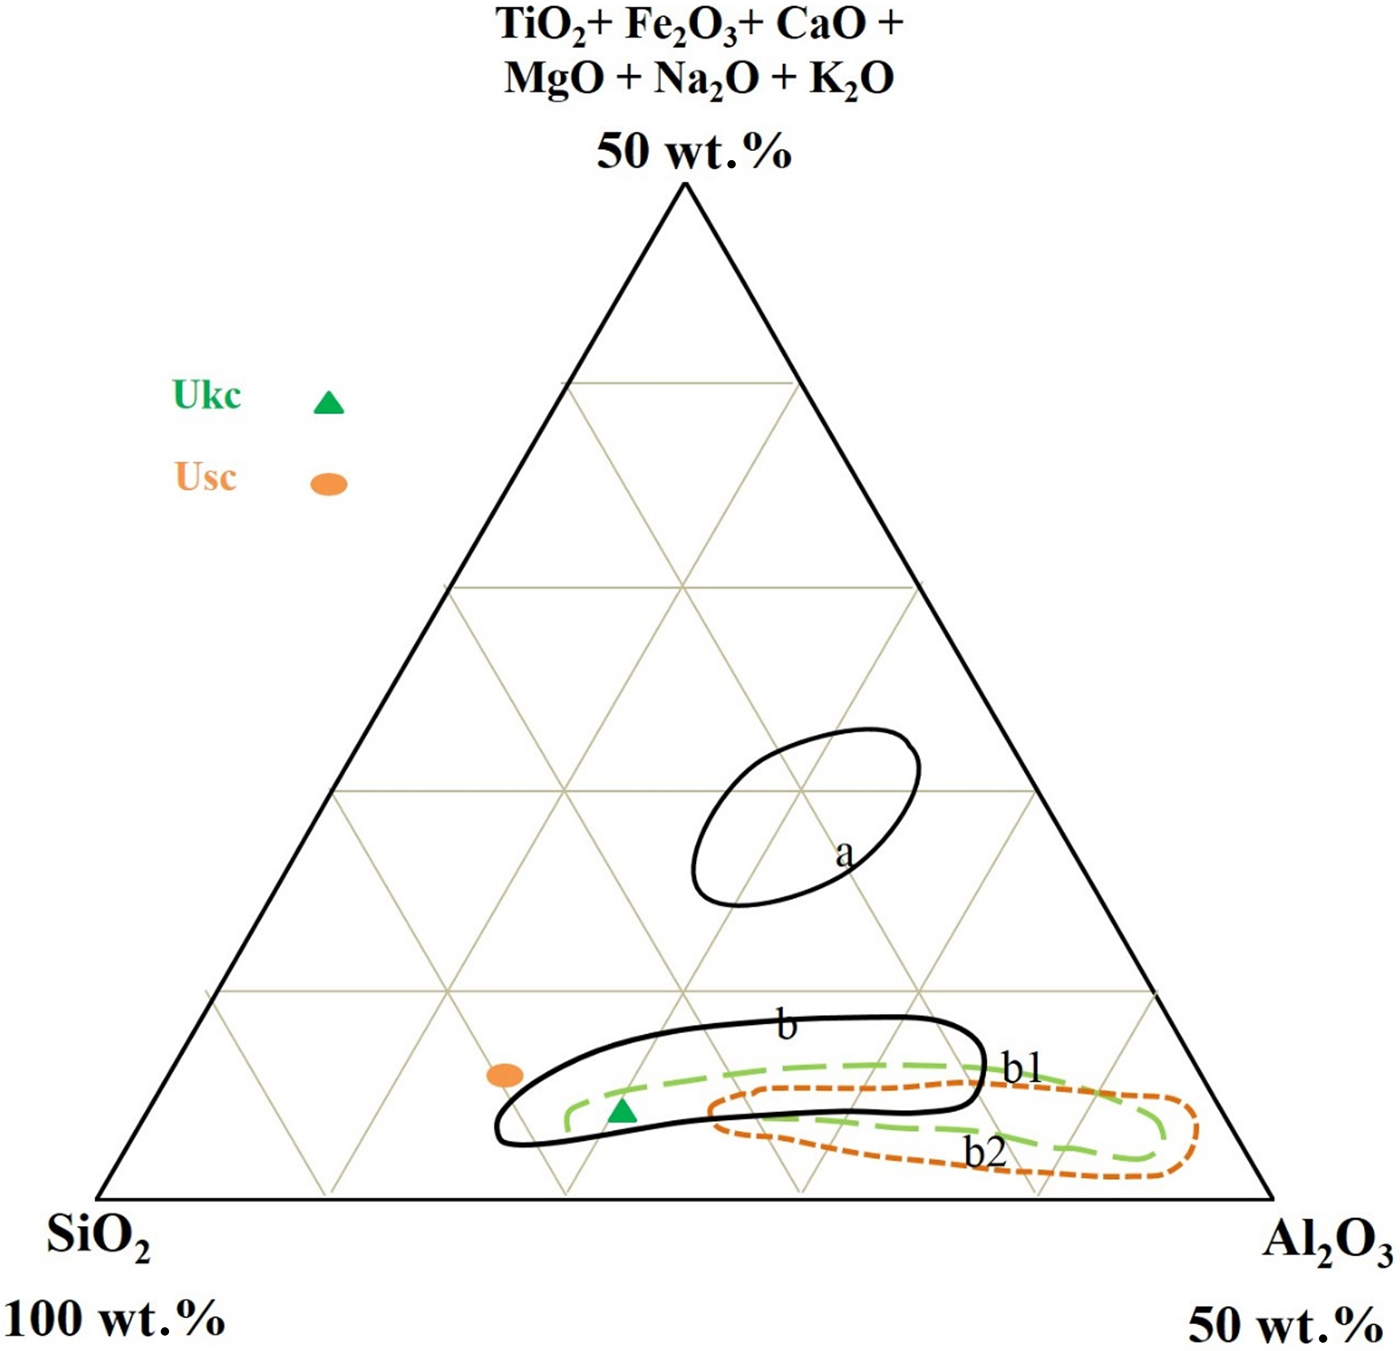
Fig. 5. SiO2-Al2O3-other oxides ternary diagram of Ukc and Usc: a = red stoneware (Italy); b, b1, b2 = white stoneware (German, English, and French, ceramics industries, respectively). Data from Fabbri & Fiori (Reference Fabbri and Fiori1985).
The infrared spectra for the bulk samples are shown in Figs 6a and 6b. The presence of clay minerals in samples of both Ukc and Usc was confirmed by the absorption bands at 3700–3620 cm–1 (Azzi et al., Reference Azzi, Osacký, Uhlík, Čaplovičová, Zanardo and Madejová2016). The sharp OH-stretching band at 3695–3670–3652 and 3620 cm–1 coupled with OH-deformation bands of 938 and 913 cm–1 are characteristic of kaolinite in the Ukc sample (Udvardi et al., Reference Udvardi, Kovács, Kónya, Földvári, Füri, Budai, Falus, Fancsik, Szabó, Szalai and Mihály2014; Bennour et al., Reference Bennour, Mahmoudi, Srasra, Hatira, Boussen, Ouaja and Zargouni2015a; Zaied et al., Reference Zaied, Abidi, Slim-Shimi and Somarin2015) (Fig. 6a). The relatively broad absorption band at 697 cm–1 in the Si-O bending region is attributed to quartz in the Ukc sample (Fig. 6a). A weak band near 1030 cm–1 in the Si–O stretching region together with a 3620 cm–1 band in the OH-stretching region confirm the presence of illite also (Udvardi et al., Reference Udvardi, Kovács, Kónya, Földvári, Füri, Budai, Falus, Fancsik, Szabó, Szalai and Mihály2014; Bennour et al., Reference Bennour, Mahmoudi, Srasra, Boussen and Hatira2015b; Zaied et al., Reference Zaied, Abidi, Slim-Shimi and Somarin2015) (Fig. 6a). Strong absorption bands of quartz at 692 and 796 cm–1 were recognized in the Si–O bending and Si–O stretching regions of the infrared spectra of the Usc sample, respectively (Udvardi et al., Reference Udvardi, Kovács, Kónya, Földvári, Füri, Budai, Falus, Fancsik, Szabó, Szalai and Mihály2014; Bennour et al., Reference Bennour, Mahmoudi, Srasra, Boussen and Hatira2015b) (Fig. 6b). Intense bands at 3620–3651–3695 cm–1 together with a 913 cm–1 OH deformation band demonstrate the presence of kaolinite in the Usc sample (Udvardi et al., Reference Udvardi, Kovács, Kónya, Földvári, Füri, Budai, Falus, Fancsik, Szabó, Szalai and Mihály2014; Azzi et al., Reference Azzi, Osacký, Uhlík, Čaplovičová, Zanardo and Madejová2016) (Fig. 6b). The diagnostic band of dolomite in the Usc sample at 1431 cm–1 is attributed to CO3 stretching (Udvardi et al., Reference Udvardi, Kovács, Kónya, Földvári, Füri, Budai, Falus, Fancsik, Szabó, Szalai and Mihály2014; Bennour et al., Reference Bennour, Mahmoudi, Srasra, Boussen and Hatira2015b) (Fig. 6b).
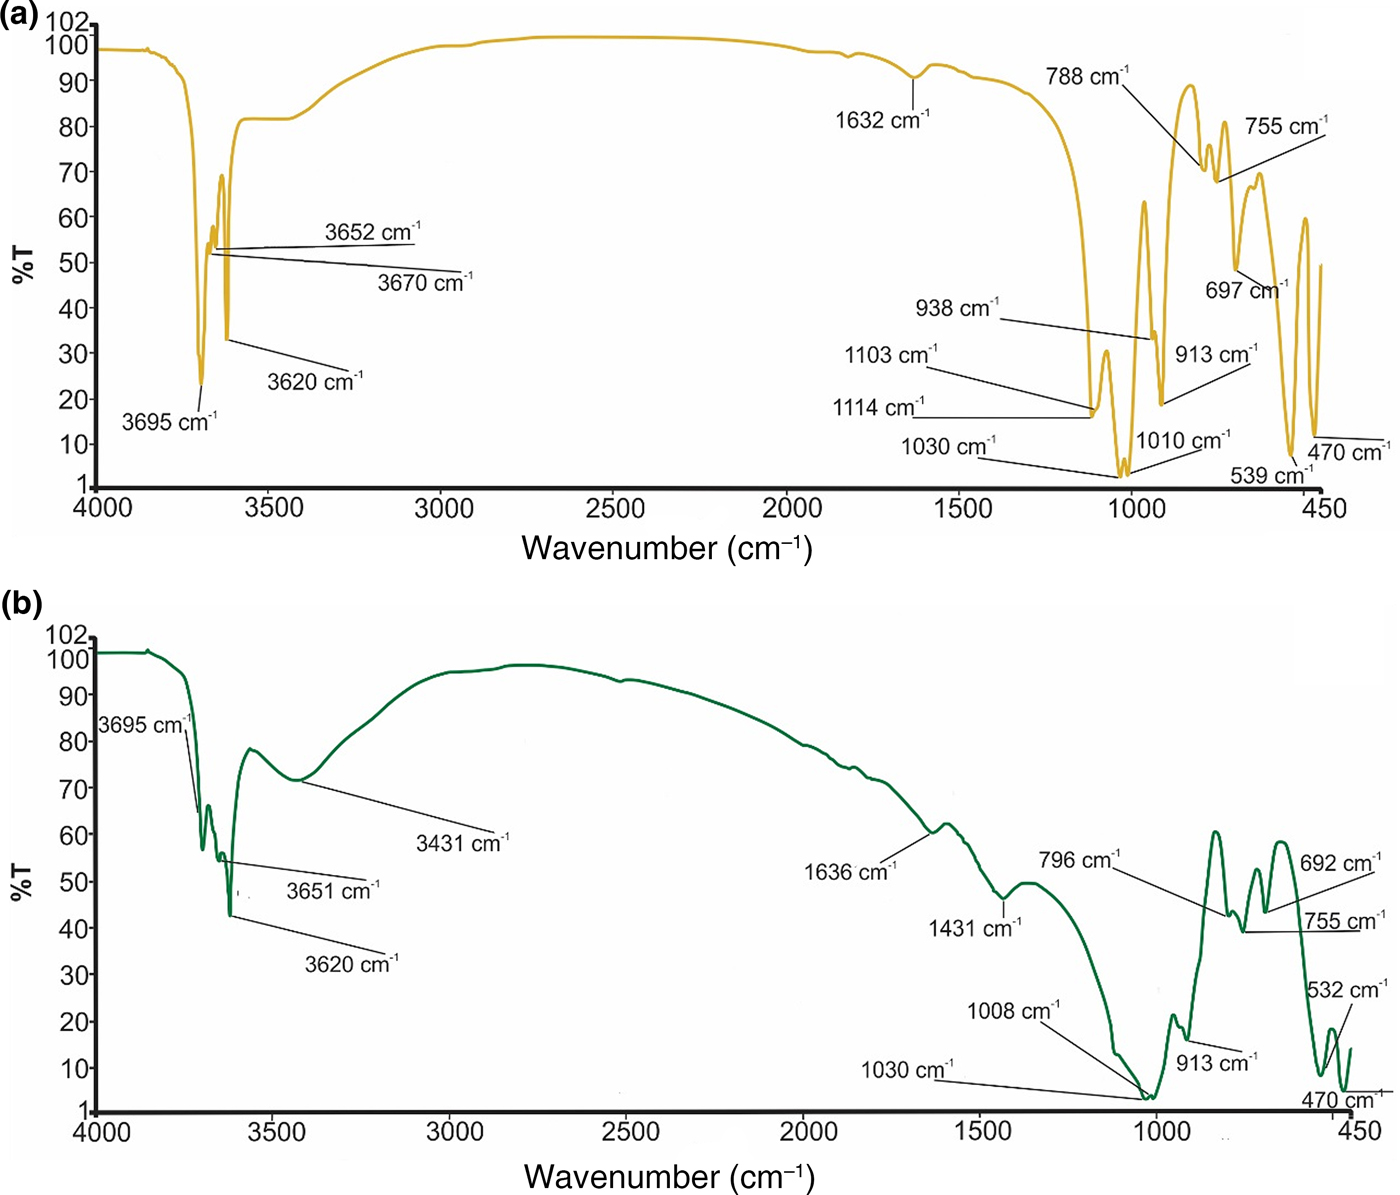
Fig. 6. FTIR spectra of (a) Ukc and (b) Usc.
The CEC values for both clay materials determined by the methylene blue test (Jackson, Reference Jackson1979) were 3.73 meq/100 g for the Ukc sample and 5.97 meq/100 g for the Usc sample. In both samples, the CEC values are typical of clays with small specific surface areas (Bain et al., Reference Bain, Smith and Wilson1994). As the percentages of the finer fractions of the Ukc samples are much greater than those of the Usc samples and the specific surface area of kaolinite is smaller than that of illite, these findings are in agreement with the mineralogical results.
Physical properties
The PL, LL and PI values of the Ukc and Usc samples are given in Table 2. The LL values of Ukc and Usc were 38.0% and 25.7%, respectively, while the PL values were 23.8% and 14.9%, respectively. Based on the Atterberg limits, the PI is calculated as 14.2% for Ukc and 10.8% for Usc.
Table 2. Dry-bending strengths, linear shrinkage, Atterberg limits, CEC values and particle-size distributions of Ukc and Usc.

According to the calculated consistency limits plotted on the Holtz & Kovacs (Reference Holtz and Kovacs1981) diagram (Fig. 7), the Ukc sample resides in the medium plastic zone while the Usc sample is located in the low plastic region. The presence of quartz and the absence of interstratified I-S and expandable clays tend to reduce the LL, PI and CEC values, which is also relevant in the present study (Bennour et al., Reference Bennour, Mahmoudi, Srasra, Hatira, Boussen, Ouaja and Zargouni2015).
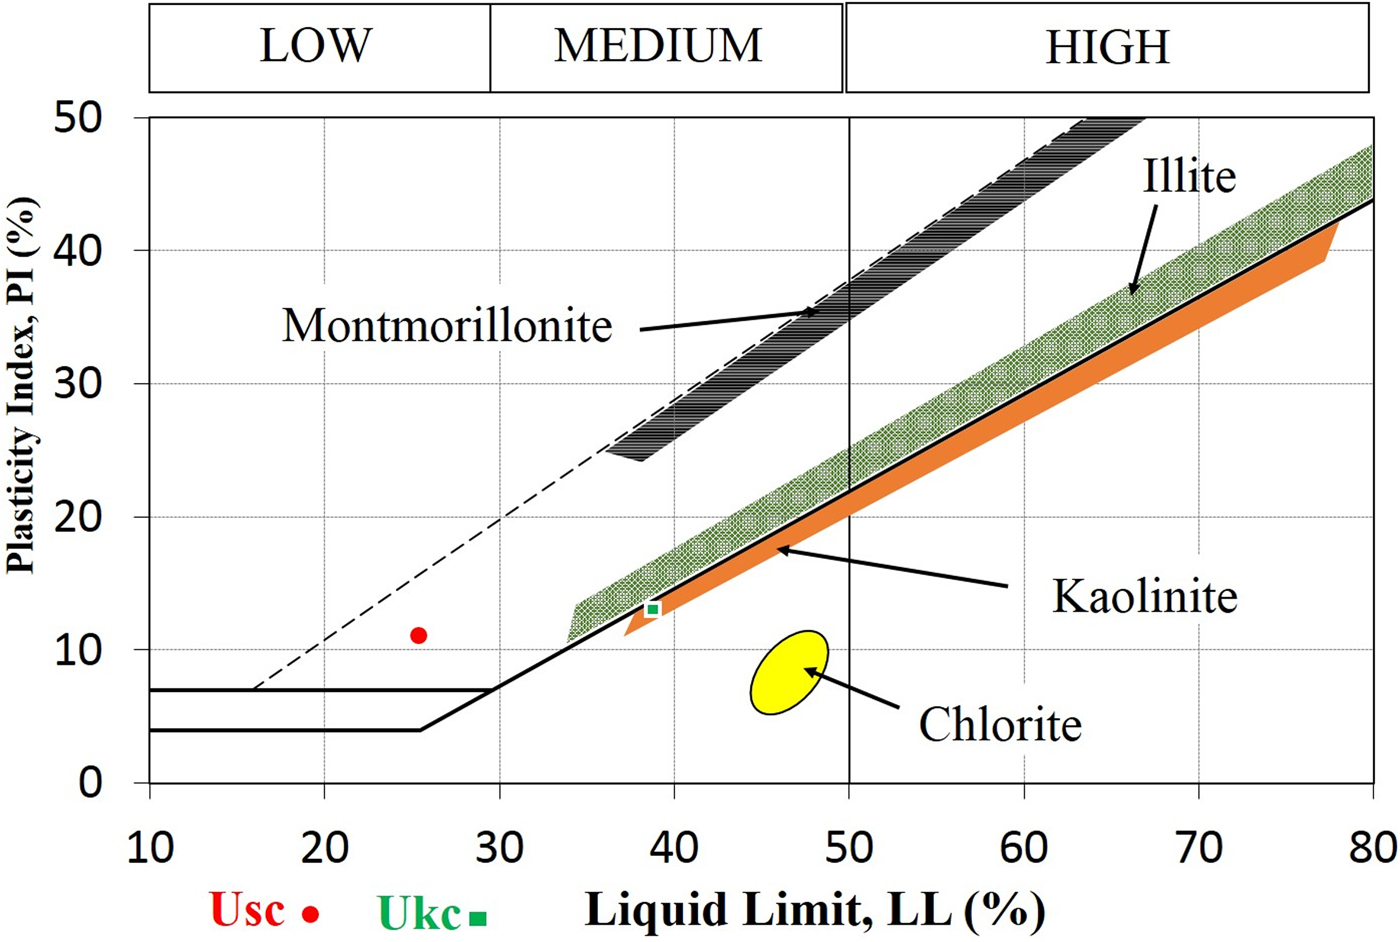
Fig. 7. LL and PI values of the Ukc and Usc samples on the Holtz & Kovacs (Reference Holtz and Kovacs1981) diagram.
According to Çelik (Reference Çelik2010), the high-plastic raw materials may cause hard drying and reducing the wearing down of the equipment for grinding and conformation (Monteiro & Vieira, Reference Monteiro and Vieira2004).
The particle-size distributions of the raw materials are important for many studies, and a fine fraction size distribution is diagnostic of ceramic products (Mahmoudi et al., Reference Mahmoudi, Srasra and Zargouni2008; Çelik, Reference Çelik2010). The clay fraction content (<4 μm) was ~54% for the Ukc sample, and 25% for the Usc sample (Table 2). The silt fraction contents (4–63 μm) were ~32% for the Ukc sample and 58% for the Usc sample. The sand fraction content (>63 μm) was ~14% for the Ukc sample and ~18% for the Usc sample (Table 2).
Technological properties
The technological properties of the samples studied are listed in Table 3. Ukc reached its maximum lightness (L*) value (94.21%) at 1100°C. In contrast, the maximum L* value for Usc was observed at 1000°C (83.59%). The hardness values measured for both samples were almost identical over the whole temperature range. However, the compressive strength of Usc was greater at all tested temperatures (except at 800°C) than that of Ukc. The compressive strength of Usc reached 13 MPa at 1300°C, while Ukc showed a compressive strength of 9.5 MPa. The compressive strength of Ukc decreased at 1430°C.
Table 3. Technological properties of Ukc and Usc.

L* = value of white colour; a* = redness when positive and greenness when negative; b* = yellowness when positive and blueness when negative.
The firing characteristics of the unit volume mass of the bodies prepared from the samples studied were demonstrated with respect to temperature (Fig. 8a). There were no major changes in the measured unit volume mass for either Ukc or Usc. For Ukc, a very slight increase was observed between 800°C and 900°C and then a constant value was obtained between 900°C and 1100°C. The unit volume mass for Usc was slightly higher than for Ukc, increasing slightly between 1000°C and 1100°C because of the substantial glassy phase, the presence of which was confirmed by the exothermic peak of the Usc sample at 1004°C (Fig. 4b).

Fig. 8. (a) Unit-volume mass and (b) water-absorption values of fired Ukc and Usc samples at various temperatures.
Water absorption is a technological parameter that permits the classification of ceramic tiles (Çelik, Reference Çelik2010). The water absorption values for Ukc are much greater than those for Usc (Fig. 8b). Ukc (24 h) and Usc (24 h) indicate that the bodies were kept underwater for 24 h. The boiling procedure for Ukc (5 h) and Usc (5 h) was carried out to measure the absorption values at 5 h as well. Generally, water absorption of the bodies is influenced by the boiling process. Sample Usc (5 h) displayed greater water absorption values (15.24–17.70%) with increasing temperature (800–1100°C) (Fig. 8b). The water absorption of Ukc (5 h) was virtually constant over the same temperature range (26.35–25.73%) (Fig. 8b).
The total linear shrinkage of Usc and Ukc was plotted on a total linear shrinkage (%) vs. temperature diagram (Fig. 9). The linear shrinkage values of Usc are mostly greater than those of Ukc between 800°C and 1430°C. For Usc, the total linear shrinkage values increased greatly over 1000°C with a major change (11.89%) observed at 1300°C (Fig. 9). For Ukc the greater total linear shrinkage values (3.86–6.64%) were observed above 1100°C. Because the Usc sample had melted completely at 1430°C, the total linear shrinkage values were not recorded at high temperatures.

Fig. 9. Total linear shrinkages of the fired Ukc and Usc samples at various temperatures.
The bending strengths of the Ukc and Usc in the temperature range of 800–1430°C, are shown in Fig. 10. Temperature clearly affects the bending strength of both samples. Usc reached a maximum bending strength rate of 19.4% at 1300°C, while the bending strength of Ukc was 2.23% at the same temperature.

Fig. 10. Bending-strength values of Ukc and Usc at various temperatures.
The Ukc and Usc were projected in the ternary diagram of Dondi et al. (Reference Dondi, Raimondo and Zanelli2014) (Fig. 11) for classifcation of light-firing clays. Ukc is plotted in an area dominated by low-grade kaolin clays, while Usc is plotted within an area dominated by raw kaolin and kaolinitic loam.
Fig. 11. Projection of Ukc and Usc in the mineralogical composition chart of light-firing clays for ceramic tiles (Dondi et al., Reference Dondi, Raimondo and Zanelli2014).
DISCUSSION
The mineralogical, physico-chemical and technological characteristics of Usc clay from Turkey were investigated and compared with a reference clay, Ukc. The smaller amount of Fe2O3 and larger amount of Al2O3 yielded a white colour for Ukc (Dondi et al., Reference Dondi, Raimondo and Zanelli2014). In the ternary diagram of Fabbri & Fiori (Reference Fabbri and Fiori1985) (Fig. 5), Ukc is projected in the region for German and English white stoneware, whereas. The Usc sample plots close white stoneware used in the German industry. This is due to the small Fe2O3 contents of both samples as the amount of Fe2O3 (<3%) allows the classification of Ukc and Usc samples as light-firing clays (Dondi et al., Reference Dondi, Raimondo and Zanelli2014). Besides affecting the colour, Fe2O3 acts as flux with MgO, K2O and Na2O (Dondi et al., Reference Dondi, Ercolani, Melandri, Mingazzini and Marsigli1999; Çelik, Reference Çelik2010; Mefire et al., Reference Mefire, Njoya, Fouateu, Mache, Tapon, Nzeukou Nzeugang, Melo Chinje, Pilate, Flament, Siniapkine, Ngono and Fagel2016). The total amount of fluxing oxides in Usc (Table 1) provides a better explanation of its low melting temperature (1300°C; Table 3). The small amount of fluxing oxides in Ukc is associated with the kaolinite content (Monteiro & Vieira, Reference Monteiro and Vieira2004). Moreover, the large Al2O3 content is related to the presence of kaolinite and illite in the mineralogical compositions of both samples (Murray, Reference Murray2007). On the other hand, Usc showed better technological characteristics when fired, which is also due to the presence of fluxing oxides in Usc. The decrease in water absorption and increase in total linear shrinkage, bulk density, bending strength and compressive strength observed at temperatures >1000°C are probably related to the formation of new phases, as observed in the DTA curve for Usc (Fig. 4b) at 1004°C and 1040°C. Sharp increase in the bending strength, total linear shrinkage and compressive strength of Usc were also recorded at 1300°C, which was the starting temperature of melting (Table 3). The bulk density value of Ukc (1.47 g/cm3) at 1100°C is less than that of Usc (1.66 g/cm3). The mechanical strength of the ceramic raw materials increased with bulk density (Lee & Yeh, Reference Lee and Yeh2008; Ngun et al., Reference Ngun, Mohamad, Sulaiman, Okada and Ahmad2011). Due to the sharp increase in bending strength at 1300°C (Fig. 10), it is expected that the bulk density would increase at the same temperature. The water absorption of Ukc is greater than that of Usc at all temperatures. The water-absorption value of Ukc might be related directly to the high porosity of the fired body, which induces a low mechanical strength in Ukc (Dondi et al., Reference Dondi, Guarini, Ligas, Palomba and Raimondo2001) (Fig. 8b). The water absorption for bricks should be <25%, whereas in roof tiles it should be >20% (Milheiro et al., Reference Milheiro, Freire, Silva and Holanda2005). Furthermore, in the study by Cengiz & Kuşçu (Reference Cengiz and Kuşçu2010), the water absorption was 8–18%, dry and firing shrinkage values were ≤10% at 1100°C and plasticity index water was 25–35% at 1000°C. Therefore, Usc might be considered to be suitable for bricks and tiles. The Mohs hardness values of both Ukc and Usc were 2 at between 800°C and 1000°C, increasing to 3 at 1100°C. In Fig. 11, Usc was classified as raw kaolin and kaolinitic loam clay (Dondi et al., Reference Dondi, Raimondo and Zanelli2014), suggesting that it might be used as a raw material for ceramics due to the abundance of quartz, kaolinite and flux materials. This type of clay material might also be suitable as a raw material for tile manufacture, subject to economics. In addition, Usc may also be considered as a versatile raw material suitable for use in vitrified bodies in amounts of up to 20–25% (Dondi et al., Reference Dondi, Raimondo and Zanelli2014). The Usc sample, due to its melting at 1430°C, is not classified as refractory; however, the kaolinite-rich Ukc sample, with its melting point at ~1850°C, clearly has refractory properties (Murray, Reference Murray2007).
CONCLUSION
The ceramic properties of Usc clay from Turkey were compared with those of a reference clay from the Ukraine. Mineralogical, chemical, physical and technological analyses were performed on both samples, and the findings compared. The small amount of Fe2O3 content and the abundance of Al2O3 in Usc and Ukc led to a white colour after firing. The abundance of fluxing oxides and the smaller amounts of fire-resistant refractory minerals caused melting of Usc at 1300°C. The formation of new phases at 1004°C and 1040°C explain the remarkable improvements in of the technological properties of Usc at temperatures of >1000°C. The small amount of fine-grained material in Usc suggests that additional grinding of the coarser fraction might be necessary prior to use.
Because of the poor plasticity and large amount of SiO2 in Usc, it can be used to reduce the plasticity and viscosity of the slip-casting applied ceramics. On the other hand, the white firing colour of Usc rendered it suitable for use in light-coloured ceramics. Because the melting of Usc started at 1300°C, it is not classified as refractory. However, the low melting point renders Usc economically viable for development of technological characteristics at lower firing temperatures.
ACKNOWLEDGEMENTS
The authors thank Muğla Sıtkı Koçman University for financial support under Project 15/195. The authors are also grateful to Michele Dondi (ISTEC CNR) and Prof. Dr Ömer Bozkaya (Pamukkale University) for their constructive comments. The reviewers of this contribution are acknowledged for their invaluable comments which improved the quality of the manuscript significantly.