


Introduction
It is commonly accepted that parasite communities are fragmented among host individuals, host species, and host communities. At these hierarchical scales, these communities are termed infracommunities, component communities, and compound communities, respectively (Holmes and Price, Reference Holmes, Price, Kittawa and Anderson1986; Poulin, Reference Poulin2007). Infracommunities are short-lived and shaped mainly by epidemiological and demographic (i.e. stochastic) processes, whereas component and compound communities persist substantially longer and are assembled via evolutionary and biogeographic processes (Morand et al., Reference Morand, Rohde and Hayward2002; Poulin, Reference Poulin2007; Hoberg and Brooks, Reference Hoberg and Brooks2015). Consequently, infracommunities have often been considered as subsets of species randomly taken from a larger species pool of either a component or a compound community (e.g. Poulin, Reference Poulin1996; Norton et al., Reference Norton, Rollinson and Lewis2004; Timi and Lanfranchi, Reference Timi and Lanfranchi2008), whereas deterministic processes were proved to predominate in the assembly of component and compound communities (e.g. Poulin and Luque, Reference Poulin and Luque2003; Salgado-Maldonado et al., Reference Salgado-Maldonado, Novelo-Turcotte, Vazquez and Caspeta-Mandujano2014). Nevertheless, some evidence suggested that (a) some deterministic processes associated with host-related and environmental factors may determine the composition of infracommunities (e.g. Spickett et al., Reference Spickett, Junker, Krasnov, Haukisalmi and Matthee2017) and (b) species composition in infracommunities is not always random (e.g. Zelmer et al., Reference Zelmer, Paredes-Calderón, León-Règagnon and García-Prieto2004). It is still debated whether parasite infracommunities are predominantly random or predominantly structured.
One of the ways to understand the processes that determine whether the communities are randomly assembled or are governed by certain assembly rules is to investigate patterns of variation of their diversity in space and/or time. Furthermore, community diversity should not be considered solely based on species inventories as in earlier studies (e.g. Wilson and Shmida, Reference Wilson and Shmida1984) but rather should also encompass functional and phylogenetic aspects (Webb et al., Reference Webb, Ackerly, McPeek and Donoghue2002; Cavender-Bares et al., Reference Cavender-Bares, Kozak, Fine and Kembel2009; De Bello et al., Reference De Bello, Lavergne, Meynard, Lepš and Thuiller2010; Pavoine and Bonsall, Reference Pavoine and Bonsall2011). From this perspective, species assemblages are also envisaged as ensembles of sets of certain traits and phylogenetic lineages. Consequently, compositional, functional, and phylogenetic diversity can be distinguished (Rocha et al., Reference Rocha, Bini, Domisch, Tolonen, Jyrkänkallio-Mikkola, Soininen, Hjort and Heino2018; Krasnov et al., Reference Krasnov, Shenbrot, Korallo-Vinarskaya, Vinarski, Warburton and Khokhlova2019a; Llopis-Belenguer et al., Reference Llopis-Belenguer, Pavoine, Blasco-Costa and Balbuena2020).
Investigation of spatial and/or temporal diversity variation would allow us to determine whether species, traits, or phylogenetic lineages are either randomly or non-randomly represented in communities. If species, traits, and phylogenetic lineages co-occur more frequently than expected by chance, then a community would be restricted to a certain subset of species that share traits and/or phylogenetic affinities (functional and/or phylogenetic clustering sensu Pavoine and Bonsall, Reference Pavoine and Bonsall2011). Alternatively, if species, traits, and phylogenetic lineages co-occur less frequently than expected by chance, then a community would be represented by species profoundly different in their traits or phylogeny (functional and/or phylogenetic overdispersion sensu Pavoine and Bonsall, Reference Pavoine and Bonsall2011). These options suggest the predominance of either environmental filtering (e.g. Ackerly and Cornwell, Reference Ackerly and Cornwell2007), or a limiting similarity (MacArthur and Levins, Reference MacArthur and Levins1967), respectively, as the main assembly rule.
Here, we studied the spatial and temporal patterns of compositional, functional, and phylogenetic diversity in infracommunities of two taxa of ectoparasitic arthropods (fleas and gamasid mites) harboured by small mammals (rodents and shrews) in different biomes of Western Siberia, taking into account host-associated and environmental factors (biome or sampling period). We considered the sampling period as a substitute for the environment at the temporal scale because of climatic fluctuations between these periods. Fleas are obligatory insect parasites with haematophagous imagoes that alternate between periods of staying on the bodies and in the burrows of the hosts and with non-parasitic larvae residing in host shelters. Gamasid mites are characterized by a broad range of feeding strategies (see Radovsky, Reference Radovsky and Kim1985). We focused on obligatory and facultative haematophagous species of mites that either stay and reproduce on host bodies almost permanently or attack the host only to obtain a blood meal or else spend most of their life off-host.
We considered diversity at two hierarchical components, namely α-diversity (in our case, the diversity of a parasite assemblage harboured by an individual host) and β-diversity (variation in infracommunity composition among individual hosts). Furthermore, real biological units (e.g. communities) exist in a complex nested hierarchy of spaces, such as, for example, sites within habitats and habitats within landscapes (Pavoine and Dolédec, Reference Pavoine and Dolédec2005; Pavoine et al., Reference Pavoine, Marcon and Ricotta2016), so that β-diversity can be decomposed into (a) β-diversity among finer scale units within broader scale units (β1) and (b) β-diversity among broader scale units (β2). In our study, we considered β1 as the dissimilarity between infracommunities within a host species, biome, or sampling period and β2 as the dissimilarity between infracommunities among host species, biomes, or sampling periods.
We asked the following questions: (a) Is infracommunity diversity more strongly affected by host species identity or environment (biome or sampling period) or by the interaction between these factors? (b) Does infracommunity composition at the scale of α- or β-diversity, in terms of species, traits, and phylogenetic lineages, deviate from random? If yes, (c) what is the predominant assembly rule in ectoparasite infracommunities (environmental filtering or limiting similarity) as indicated by species, trait, and phylogenetic lineage clustering or overdispersion, respectively? In addition, we asked whether patterns of infracommunity diversity differ between the three facets of diversity and/or the two ectoparasite taxa.
Materials and methods
Data on ectoparasite infracommunities
Data on the species composition of fleas and mites in host individuals were extracted from the database of the Omsk Research Institute of Natural Foci Infections (Omsk, Russia) that were collected from 1960 to 2013 by various collectors in 109 localities across Western Siberia, from the Taimyr Peninsula in the north to the Altai Mountains in the south, and including the eastern slope of the Ural Mountains. Sampling was carried out in different biomes, namely tundra, mountain, southern, and northern taiga forests, mixed (coniferous and deciduous) forests, forest-steppes, and grasslands (see Rikhter, Reference Rikhter1963 for the natural zonation of Western Siberia). Tundra is a forestless biome with vegetation consisting mainly of lichens, mosses, and relatively low diversity of herbaceous plants. Taiga is a forest dominated by coniferous trees, such as pine, Siberian pine, larch, spruce, and fir. The northern taiga is characterized by a less dense tree canopy, and by the higher lichen abundance and diversity. Coniferous trees are substantially more predominant in the northern taiga than the southern taiga. The mountain taiga is represented by coniferous forests forming a particular altitudinal zone in the mountainous areas of Siberia. Mixed forests are forest belts in which coniferous (pine, spruce and larch) and deciduous (birch, asp, linden and alder) trees grow. Forest-steppe is a mixture of open lands and forests, with the latter represented by small isolated patches. The steppe part of this biome is formed by various grasses (Poaceae), whereas the forest part consists mainly of deciduous trees. Siberian grasslands ( = steppe) are a semi-arid to arid biome with very few forests and dominant plants belonging to the Poaceae family.
Small mammals (rodents and shrews) were captured from late spring to early fall with pitfall traps and snap-traps. Further details on sampling procedures can be found in van der Mescht et al. (Reference van der Mescht, Warburton, Khokhlova, Stanko, Vinarski, Korallo-Vinarskaya and Krasnov2018), Surkova et al. (Reference Surkova, Korallo-Vinarskaya, Vinarski, Stanko, Warburton, van der Mescht, Khokhlova and Krasnov2018a, Reference Surkova, Korallo-Vinarskaya, Vinarski, van der Mescht, Warburton, Khokhlova and Krasnov2018b), and Krasnov et al. (Reference Krasnov, Shenbrot, Korallo-Vinarskaya, Vinarski, van der Mescht, Warburton and Khokhlova2019b). Five localities were sampled multiple times (from 2 to 21), with at least a year break between sampling periods.
We analysed the diversity of ectoparasite infracommunities (fleas and mites separately) at either spatial or temporal scales. For spatial analyses, we selected parasite assemblages of those host species that were represented in a locality by at least five individuals infested by either fleas or mites. This resulted in 1928 flea and 2123 mite infracommunities of 12 host species (Apodemus agrarius, Arvicola amphibius, Craseomys rufocanus, Microtus agrestis, Microtus arvalis, Microtus gregalis, Microtus middendorffi, Microtus oeconomus, Myodes glareolus, Myodes rutilus, Sorex araneus, and Sorex tundrensis; see details in Table 1) from 41 localities (see map in Supplementary Material, Appendix 1, Fig. S1) infested with 30 flea and 25 mite species. For temporal analyses, we focused on a single locality (Tenis Lake; situated in the forest-steppe belt at 56°N) that was sampled multiple times from 1976 to 2006. We selected sampling periods at which at least three host species, each with at least five infected individuals, were recorded. This resulted in 1336 flea and 1740 mite infracommunites represented by 14 species and 20 species, respectively, harboured by 12 host species as specified above. For each part of the analysis, we constructed matrices by host individuals in rows and ectoparasite species in columns, and the number of ectoparasites of each species collected from an individual host in each cell.
Table 1. Data on flea and mite infracommunities used in the analyses
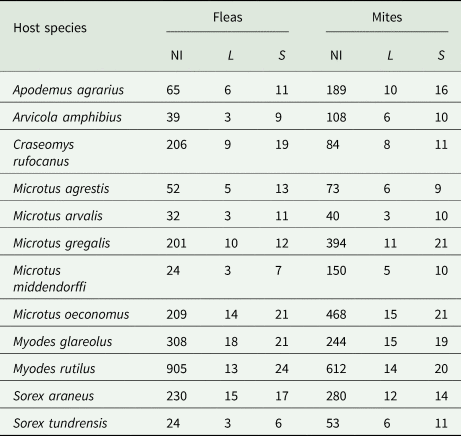
NI, number of individuals; L, number of localities; S, number of parasite species.
Flea and mite traits
Each ectoparasite species was characterized by eight (fleas) or six (mites) ecological, morphological, or life-history traits. Ecological trait variables were characteristic abundance, the mean number of exploited host species, and phylogenetic distinctness of a global host spectrum. The latter trait represented the Δ+ index (Clarke and Warwick, Reference Clarke and Warwick1999), modified for phylogenetic, rather than taxonomic, distances and calculated using the ‘taxondive’ function of the ‘vegan’ package (Oksanen et al., Reference Oksanen, Blanchet, Friendly, Kindt, Legendre, McGlinn, Minchin, O'Hara, Simpson, Solymos, Stevens, Szoecs and Wagner2019), implemented in the R 3.6.1 Statistical Environment (R Core Team, 2019). All ecological trait variables were continuous, calculated from the extensive database on flea and mite distribution in the Palearctic and, when necessary, corrected for sampling effort (see details in Krasnov et al., Reference Krasnov, Shenbrot, Korallo-Vinarskaya, Vinarski, Warburton and Khokhlova2019a). Continuous morphological trait variables were body size [see details of measurements and calculations in Krasnov et al. (Reference Krasnov, Vinarski, Korallo-Vinarskaya and Khokhlova2013) for mites and Surkova et al. (Reference Surkova, Korallo-Vinarskaya, Vinarski, Stanko, Warburton, van der Mescht, Khokhlova and Krasnov2018a) for fleas] and the degree of sexual size dimorphism (logarithm of female to male size ratio; Surkova et al., Reference Surkova, Korallo-Vinarskaya, Vinarski, Stanko, Warburton, van der Mescht, Khokhlova and Krasnov2018a). Fleas were also characterized by the number of sclerotinized combs (no combs, pronotal comb only, both genal and pronotal combs). Life history variables (all categorical) were microhabitat preference (higher or equal proportion of time spent either on a host's body or its shelter; see Krasnov, Reference Krasnov2008) and seasonality of reproduction (the peak during either the warm or cold period or no seasonal preference) for fleas and feeding mode (exclusive blood-feeding, blood-feeding and predation upon other nidicolous arthropods, or intermittent non-obligatory blood-feeding and predation; Radovsky, Reference Radovsky and Kim1985) for mites. Additional details on the measurement of flea and mite traits can be found elsewhere (Krasnov et al., Reference Krasnov, Shenbrot, Korallo-Vinarskaya, Vinarski, Warburton and Khokhlova2019a; Vinarski et al., Reference Vinarski, Korallo-Vinarskaya, Shenbrot, Warburton, Surkova, Khokhlova and Krasnov2020).
Phylogeny and quasi-phylogeny
We used the most comprehensive molecular phylogeny of fleas (Zhu et al., Reference Zhu, Hastriter, Whiting and Dittmar2015) and determined the positions of species that were not represented in this phylogeny, using their taxonomic affinities based on morphology. Because no comprehensive phylogenetic tree for mites is available, we constructed a quasi-phylogeny (a proxy of phylogeny sensu Llopis-Belenguer et al., Reference Llopis-Belenguer, Pavoine, Blasco-Costa and Balbuena2020) using the Linnean taxonomic tree with four above-species hierarchical levels (subgenus, genus, subfamily, family) (see Krasnov et al., Reference Krasnov, Shenbrot, Korallo-Vinarskaya, Vinarski, Warburton and Khokhlova2019a for details).
Data analyses
In this study, we followed the approach of Llopis-Belenguer et al. (Reference Llopis-Belenguer, Pavoine, Blasco-Costa and Balbuena2020) by using the double principal coordinate analysis (DPCoA) developed by Pavoine et al. (Reference Pavoine, Dufour and Chessel2004) that was successfully applied to ectoparasite communities in earlier studies (Krasnov et al., Reference Krasnov, Shenbrot and Khokhlova2015a; Warburton et al., Reference Warburton, van der Mescht, Stanko, Vinarski, Korallo-Vinarskaya, Khokhlova and Krasnov2017). An important feature of the DPCoA is that the dissimilarity information is given by the Rao's index of diversity (quadratic entropy Q; Rao, Reference Rao1982). Further details on the DPCoA can be found in Supplementary Material, Appendix 2. We used the DPCoA to calculate the compositional, functional, and phylogenetic diversity of flea and mite infracommunities. For calculation of compositional diversity, a value of 1 is assigned to all distances in the matrix (Llopis-Belenguer et al., Reference Llopis-Belenguer, Pavoine, Blasco-Costa and Balbuena2020). As a result, all species are equally and maximally distant, so that Rao's diversity = Simpson's diversity and represents the probability that any two individuals are randomly taken from a community would belong to the same species (Pavoine et al., Reference Pavoine, Dufour and Chessel2004). Matrices of functional dissimilarities were constructed by using the function ‘dist.ktab’ from the R package ‘ade4’ (Thioulouse et al., Reference Thioulouse, Dray, Dufour, Siberchicot, Jombart and Pavoine2018) and calculating between-species Gower's distances (Gower, Reference Gower1971). The latter allows for combining different types of trait variables (continuous, categorical, nominal, and ordinal). These matrices were then transformed into Euclidean pairwise distances. Matrices of phylogenetic pairwise distances between flea species were constructed using the function ‘distTips’ (method = ‘patristic’) from the R package ‘adephylo’ (Jombart and Dray, Reference Jombart and Dray2010). Matrices of Euclidean quasi-phylogenetic distances between mite species were built using the function ‘taxa2dist’ from the R package ‘vegan’. Each of these matrices was then divided by its maximum to obtain the range of distances between 0 and 1.
α-Diversity values were calculated using the function ‘dpcoa’ from the package ‘ade4’ and then transformed into their equivalent numbers (Jost, Reference Jost2006). In simple terms, the equivalent number of species is the number of equally common species needed to produce a given value of a diversity index. The values of the equivalent number of species may vary from a minimum of 1 (when an assemblage is composed of a single species) to a maximum of a total number of species (if all species are equally abundant). Ricotta and Szeidl (Reference Ricotta and Szeidl2009) extended this approach to the Rao's index of diversity, revising the definition of the equivalent number of species, by adding a dissimilarity component so that this number represents the number of equally common and maximally dissimilar species required to give a particular value of the diversity index.
We tested for the effects of (a) host species and biome (at the spatial scale) and (b) host species and sampling period (at the temporal scale) on each facet of α-diversity (separately) of flea or mite infracommunities via a linear model evaluation with a randomized residual permutation, using the function ‘lm.rrpp’ from the R package 'RRPP' (Collyer and Adams, Reference Collyer and Adams2018) with prior log-transformation of α-diversity values. Then, we ran ANOVAs, using random distributions of the F-statistics (Collyer and Adams, Reference Collyer and Adams2018) and posteriori pairwise comparisons of each diversity facet between (a) host species and biome (for the spatial scale) and (b) host species and sampling periods (for the temporal scale).
β-Diversity was calculated using the hierarchical approach of Pavoine et al. (Reference Pavoine, Marcon and Ricotta2016) that allows estimation of Rao's diversity for any number of nested levels. At each scale and for each factor, two nested organizational levels were considered. At the spatial scale, the sampling units (host individuals) were nested in either host species or biomes, so that the two components of β-diversity, for each factor, were dissimilarities among infracommunities within either a host species or a biome (β1) and dissimilarities among infracommunities between either host species or biomes (β2). At the temporal scale, the sampling units (host individuals) were nested either in host species or sampling periods, so that the two components of β-diversity were dissimilarities among infracommunities either within a host species or a sampling period (β1) and dissimilarities among infracommunities between either host species or sampling periods (β2). We calculated both β1 and β2 for each diversity facet and each ectoparasite taxon with the function ‘EqRao’ from the R package ‘adiv’ (Pavoine, Reference Pavoine2020), using the third alternative of the Rao index of Pavoine et al. (Reference Pavoine, Marcon and Ricotta2016), because it is specifically designed for data when sampling is uneven and matrices differ in size. Both versions of β-diversity were calculated using the equivalent number approach (see above).
Then, we compared each version of β-diversity for each diversity facet and each ectoparasite taxon with 999 randomly simulated β-diversity values, using the function ‘rtestEqRao’ in the R package ‘adiv’. The observed values that were either significantly greater or lower than random values would indicate that infracommunities in the same (β1) or different (β2) host species, habitat types, or sampling periods are either more dissimilar or more similar, respectively, to each other than expected by chance (Llopis-Belenguer et al., Reference Llopis-Belenguer, Pavoine, Blasco-Costa and Balbuena2020). Standardized β-diversity values (the difference between the observed value and the mean of simulated values divided by the standard deviation of simulated values) indicate whether species, traits or lineages are overdispersed (negative values) or clustered (positive values) within an organizational level (β1) or between organizational levels (β2) (Pavoine et al., Reference Pavoine, Baguette and Bonsall2010).
The DPCoA is designed to test for the relationships between diversity and only one independent variable (factor). To overcome this limitation, Pavoine et al. (Reference Pavoine, Blondel, Dufour, Gasc and Bonsall2013) proposed that the extension of the DPCoA, called the crossed-DPCoA, be used when the composition of communities is affected by two crossed factors (factor A and factor B). Attributes (i.e. levels) of these factors can be placed in the DPCoA ordination space, with each species being associated with a particular level of each factor. Consequently, a level of factor A or B may be positioned at the centroid of species’ points associated with this level. A component of the total diversity associated with dissimilarity among communities of the DPCOA may thus be further decomposed into dissimilarity due to factor A, dissimilarity due to factor B, and dissimilarity due to the interaction of both factors. In other words, the crossed-DPCoA can be applied to investigate the pattern of diversity due to one of the crossed factors, while controlling for the existence of the other crossed factor. The crossed-DPCoA constructs an ordination space in which each species, community and the level of each factor are characterized by coordinates on each axis. The main effect of one of the factors is analysed by defining the axes of the highest variance of coordinates of this factor's levels and to project the points for the species and the factor levels onto these new axes without taking into account other points (i.e. communities and the levels of another factor). Pavoine et al. (Reference Pavoine, Blondel, Dufour, Gasc and Bonsall2013) proposed two versions of the crossed-DPCoA. The first version removes the component of dissimilarity among communities determined by the main effect of factor B but retains the combined effects of factors A and B. The second version eliminates any diversity pattern associated with either factor B or the interactions between the two factors and leaves the diversity solely associated with factor A. If the factors are independent, then both versions of the crossed-DPCoA produce the same results. We carried out the crossed-DPCOAs, using the respective functions of the R package ‘adiv’. In our analyses, crossed factors A and B were (a) host species and biome, respectively, for the analyses at the spatial scale and (b) host species and sampling period for the analyses at the temporal scale. Detailed R code can be found in Llopis-Belenguer et al. (Reference Llopis-Belenguer, Pavoine, Blasco-Costa and Balbuena2020).
Results
Diversity of infracommunities at the spatial scale
A summary of the results of the ANOVAs of the effect of host species or biome on the three facets of infracommunity α-diversity is presented in Table 2. Compositional, functional, and phylogenetic α-diversity of both taxa differed significantly among host species (Fig. 1A for fleas and Fig. 1B for mites) and biomes (Fig. 2A for fleas and Fig. 2B for mites).
Table 2. Results of ANOVAs (using random distributions of the F-statistics) of the compositional (CD), functional (FD), and phylogenetic (PD, for fleas), or quasi-phylogenetic (QPD, for mites) α-diversity of ectoparasite infracommunities at the spatial scale as affected by host species or biome

F-test and P values are shown.

Fig. 1. Compositional (CD), functional (FD), and phylogenetic (PD, for fleas), or quasi-phylogenetic (QPD, for mites) α-diversity of ectoparasite infracommunities in different host species. (A) Flea infracommunities, (B) mite infracommunities. Abbreviations of species names contain the first three letters of the genus name and the first three letters of the species name (see Table 1).

Fig. 2. Compositional (CD), functional (FD), and phylogenetic (PD, for fleas), or quasi-phylogenetic (QPD, for mites) α-diversity of ectoparasite infracommunities in different biomes. (A) Flea infracommunities, (B) mite infracommunities. Biomes are FS: forest-steppe, MF: mixed forests, MT: mountain taiga, NT: northern taiga, ST: southern taiga, GL: grasslands, TR: tundra.
Flea and mite infracommunities harboured by the same host species or in the same biome (i.e. at the level of β1), as well as those harboured by different host species or in different biomes (i.e. at the level of β2), were consistently more dissimilar than expected by chance (Table 3). Standardized observed values of diversity were positive, suggesting that infracommunity composition, in terms of species, trait, and phylogenetic/quasi-phylogenetic lineages, differed between host individuals, both within and between host species, as well as between host individuals occurring in the same or different biomes (i.e. species, traits, and lineages were clustered in infracommunities at both organizational scales). In other words, the similarity of infracommunities, in terms of species, trait, and phylogenetic/quasi-phylogenetic composition, was higher than expected by chance from a total species pool.
Table 3. Standardized observed values of compositional (CD), functional (FD), and phylogenetic (PD, for fleas), or quasi-phylogenetic (QPD, for mites) diversity of ectoparasite infracommunities at β1 (dissimilarity of infracommunities within host species or biome) and β2 (dissimilarity of infracommunities among host species or biomes) levels (spatial scale)

All are significant (P < 0.001) in comparison to a distribution of 999 randomly generated β1 or β2 values.
Analyses of the effect of two crossed factors (host species and biome) demonstrated that the highest proportion of taxonomic, functional, and phylogenetic diversity of the entire flea assemblage was associated with the crossed-effect between the two factors, followed by the effect of diversity in each infracommunity (i.e. host individual) with the proportions of diversity due to ‘pure’ effect of host species and biomes being substantially lower (Table 4). In mites, however, the highest proportion of diversity was associated with the effect of host species, closely followed by proportions due to the effects of host individual and interaction between the two factors, whereas the effect of biome was minor (Table 4).
Table 4. Percentage of compositional (CD), functional (FD), and phylogenetic (PD, for fleas), or quasi-phylogenetic (QPD, for mites) β-diversity of ectoparasite infracommunities associated with factors of host individual (HI), host species (HS), biome (BM), and interaction between host species and biome (HS × BM)

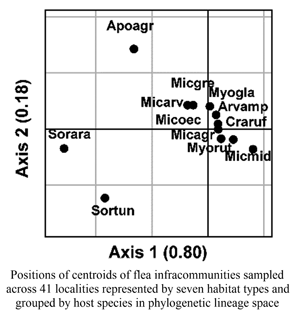
Ordination diagrams of the crossed-DPCoAs demonstrated that flea infracommunities of shrews (S. araneus and S. tundrensis) were clearly separated from infracommunities of rodents along the first axis of species, trait, and lineage space (Fig. 3A–C). In addition, flea infracommunities harboured by field mice (Apodemus agrarius) were separated from the infracommunities of the remaining hosts along the second axis (Fig. 3A–C). Ordination diagrams of the crossed-DPCoAs of mite infracommunities showed separation of infracommunities harboured by water voles (Arvicola amphibius) along the first axis (Fig. 3D and E), although this was much less pronounced in the space of quasi-phylogenetic lineages (QPD) (Fig. 3F). Mite infracommunities of shrews were separated from those of rodents along the second axis in the species and trait space, and along both axis in the lineage space (Fig. 3D–F).

Fig. 3. Positions of centroids of flea (A)–(C) and mite (D)–(F) infracommunities sampled across 41 localities represented by seven habitat types and grouped by host species in species space (CD), trait space (FD), and phylogenetic/quasi-phylogenetic lineage space (PD/QPD). Ordination was carried out using the first version of the crossed-double principal coordinate analysis (host species and biome as factors; see text for explanation). Abbreviations of species names contain the first three letters of the genus name and the first three letters of the species name (see Table 1). Values in parentheses at axis title are percentages of the variance explained by a given axis.
Diversity of infracommunities at the temporal scale
All three facets of infracommunity α-diversity in both ectoparasite taxa in Tenis Lake were significantly affected by host species or sampling period (Table 5). Similarly to the spatial scale, both β1 and β2 of both taxa's infracommunities significantly differed from randomness (Table 6). Standardized observed values of all facets of flea and mite β-diversity, at both organizational levels, were positive (albeit low) (0.004–0.06), indicating clustering of infracommunities from compositional, functional, and phylogenetic/quasi-phylogenetic perspectives, both within and between host species or sampling periods. The results of the crossed-factor (host species and sampling period) analyses demonstrated that the highest proportion of either facet of diversity in either fleas or mites was associated with the crossed effect between these factors (Table 7). The effect of diversity in each individual host was responsible for a substantial proportion of the diversity as well, whereas the ‘pure’ effects of host species and sampling period were weaker (Table 7). Similarly to the results of the spatial analysis, ordination diagrams of the crossed-DPCoAs for the temporal analysis demonstrated that flea infracommunities harboured by S. araneus were clearly separated from those harboured by rodents (Fig. 4A–C), whereas mite infracommunities of Arvicola amphibius differed substantially from those of the remaining hosts, except for quasi-phylogenetic composition (Fig. 4D–F).
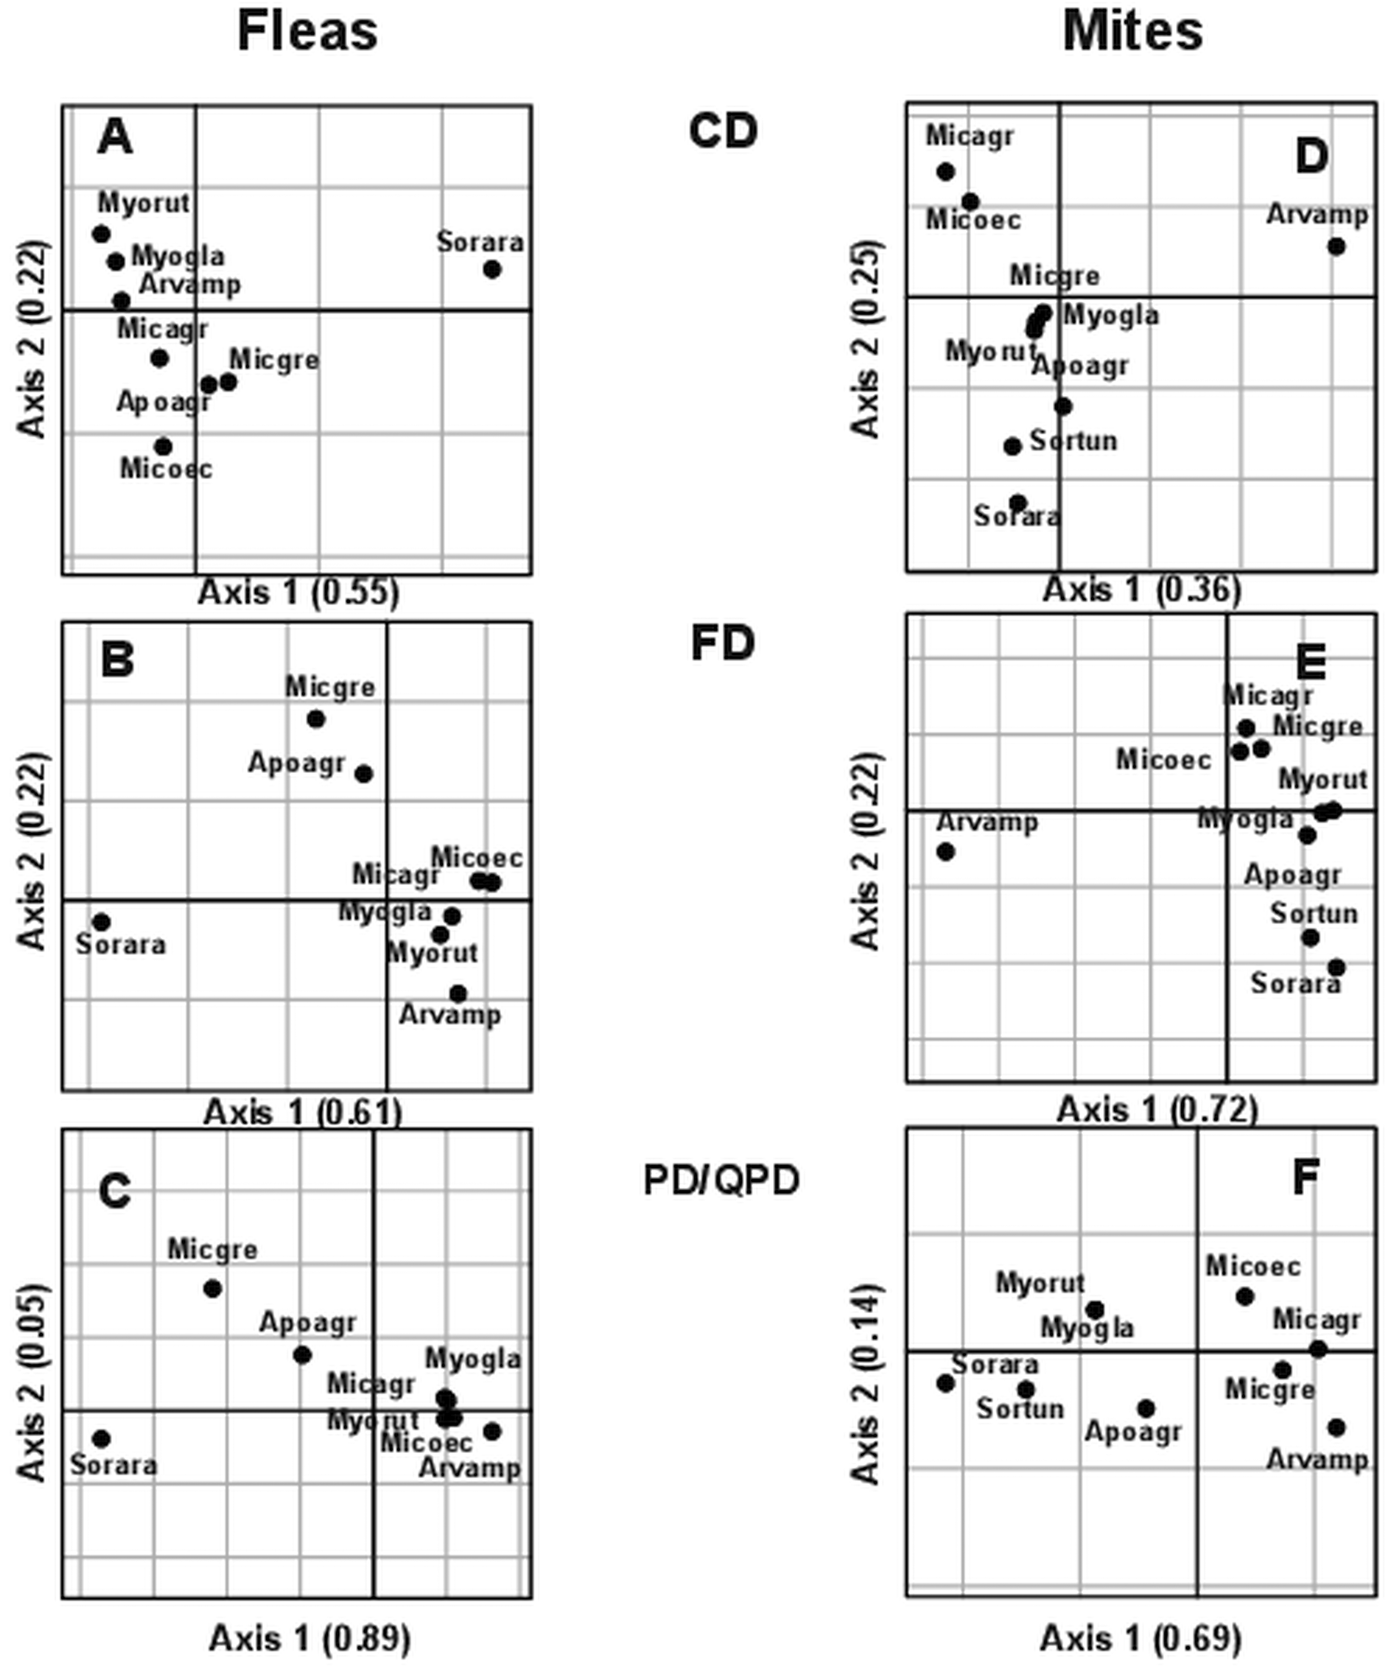
Fig. 4. Positions of centroids of flea (A)–(C) and mite (D)–(F) infracommunities sampled in different periods at the Tenis Lake locality in species space (CD), trait space (FD), and phylogenetic/quasi-phylogenetic lineage space (PD/QPD). Ordination was carried out using the first version of the crossed-double principal coordinate analysis (host species and sampling period as factors; see text for explanation). Abbreviations of species names contain the first three letters of the genus name and the first three letters of the species name (see Table 1).
Table 5. Results of ANOVAs (using random distributions of the F-statistics) of the compositional (CD), functional (FD), and phylogenetic (PD, for fleas), or quasi-phylogenetic (QPD, for mites) α-diversity of ectoparasite infracommunities at the temporal scale as affected by host species or sampling period

F-test and P values are shown.
Table 6. Standardized observed values of the compositional (CD), functional (FD), and phylogenetic (PD, for fleas), or quasi-phylogenetic (QPD, for mites) diversity of ectoparasite infracommunities at β1 (dissimilarity of infracommunities within host species or sampling period) and β2 (dissimilarity of infracommunities among host species or sampling periods) levels (temporal scale)

All are significant (P < 0.001) in comparison to a distribution of 999 randomly generated β1 or β2 values.
Table 7. Percentage of the compositional (CD), functional (FD), and phylogenetic (PD, for fleas), or quasi-phylogenetic (QPD, for mites) β-diversity of ectoparasite infracommunities in Tenis Lake associated with factors of host individual (HI), host species (HS), sampling period (Y), and interaction between sampling period and host species (HS × Y)

Discussion
The main results of this study are as follows. First, α-diversity of ectoparasite communities was strongly affected by host species (at both spatial and temporal scales), biome (at the spatial scale), and sampling period (at the temporal scale). Second, the highest proportion of infracommunity diversity in both ectoparasite taxa was associated with the interaction between host species and biome (at the spatial scale), or host species and sampling period (at the temporal scale). Third, ectoparasite infracommunities within, as well as between, host species, biomes, and sampling periods were characterized by clustering of species, traits and lineages. Finally, the patterns of the effects of host species, biome, and sampling period on ectoparasite infracommunity diversity were congruent among the three diversity facets in both ectoparasite taxa.
All the above-mentioned findings suggest that ectoparasite infracommunity composition, in terms of species, traits, and phylogenetic lineages, is the most strongly affected by the interplay between factors associated with host species and factors associated with the off-host environment. This is not especially surprising because ectoparasites of terrestrial hosts, in contrast to endoparasites, are exposed to the external environment and often spend a long time in, for example, the substrate of host's burrow or nest than on the host's body (Radovsky, Reference Radovsky and Kim1985 for mites; Krasnov, Reference Krasnov2008 for fleas). In particular, microclimatic factors, such as ambient temperature and relative humidity, strongly affect both immature stages and adult ectoparasites. For example, the development and survival of flea larvae are strongly affected by both these factors, with different (even congeneric) species having species-specific temperature and humidity preferences (Krasnov, Reference Krasnov2008). Although microclimatic preferences of parasitic gamasids have rarely been studied (but see Kozlova, Reference Kozlova1983), the results of investigations on closely related free-living mesostigmate mites suggest that (a) air temperature and relative humidity, as well as soil structure, may have a profound effect on mite survival, oviposition rate, and development, and that (b) mites demonstrate species-specific environmental preferences (e.g. Al-Azzazy and Alhewairini, Reference Al-Azzazy and Alhewairini2020; Park and Lee, Reference Park and Lee2020). Both phenomena are likely true for parasitic gamasids as well. This is indirectly supported by the finding of the effect of a geographic location's mean annual temperature on intraspecific variation in the body size of a parasitic gamasid Laelaps clethrionomidis (Korallo-Vinarskaya et al., Reference Korallo-Vinarskaya, Vinarski, Khokhlova, Shenbrot and Krasnov2015). Obviously, climate variables, as well as soil structure, vary between habitats of different types and situated in different climatic zones. These between-habitat or between-biome differences in general climate are further translated, at least partly, into between-biome differences in microclimatic conditions in the burrows of small mammals (e.g. Shenbrot et al., Reference Shenbrot, Krasnov, Khokhlova, Demidova and Fielden2002). This results in differential species composition and diversity of ectoparasite infracommunities among biomes. Similar to the effect of between-biome climatic variation on ectoparasite diversity at the spatial scale, variation of weather conditions between sampling periods was the main reason for the effect of sampling period on flea and mite diversity. In fact, yearly weather variation is strongly pronounced in Western Siberia (Rikhter, Reference Rikhter1963). Nevertheless, environmental variation between sampling periods in the same locality is obviously less strong than the environmental variation between biomes. As a result, although the effects of both biome at the spatial scale and sampling period at the temporal scale on ectoparasite diversity were significant, the latter was clearly weaker than the former (compare the F-statistics values in Tables 2 and 5).
A strong effect of host species identity on parasite diversity has been repeatedly demonstrated for various parasite taxa (Gregory et al., Reference Gregory, Keymer and Harvey1996; Morand and Poulin, Reference Morand and Poulin1998; Bordes et al., Reference Bordes, Morand and Krasnov2011). Furthermore, this effect was found not only in parasite taxa characterized by a high degree of host specificity (e.g. bat flies; Bordes et al., Reference Bordes, Morand and Guerrero2008) but also in taxa with many host-opportunistic species (gamasid mites; Korallo et al., Reference Korallo, Vinarski, Krasnov, Shenbrot, Mouillot and Poulin2007). In our study, the effect of host species was pronounced in both fleas and mites, although many mite species are broad host generalists. For example, all species of the mite genus Androlaelaps in Asiatic Russia were recorded on various host species belonging to different genera, families, orders, and even classes (Vinarski and Korallo-Vinarskaya, Reference Vinarski and Korallo-Vinarskaya2016). The effect of host species on parasite diversity is associated with a variety of host traits linked to host morphology (e.g. body size; Esser et al., Reference Esser, Foley, Bongers, Herre, Miller, Prins and Jansen2016), physiology (e.g. metabolic rate; Morand and Harvey, Reference Morand and Harvey2000), ecology (e.g. Bordes et al., Reference Bordes, Morand and Guerrero2008), behaviour (e.g. Bordes et al., Reference Bordes, Blumstein and Morand2007), and geographic distribution (e.g. Krasnov et al., Reference Krasnov, Shenbrot, Khokhlova and Degen2004). For example, basal metabolic rate (BMR) has been shown to correlate positively with parasite species richness in mammalian hosts because hosts exposed to diverse infections likely invest in a higher BMR in order to compensate for a costly immune response (Morand and Harvey, Reference Morand and Harvey2000).
The contribution of the interaction between host species and biome or sampling period to the highest percentage of diversity supports our earlier finding that habitat for an ectoparasite is not merely a particular host, but rather a particular host in a particular habitat or biome (Krasnov et al., Reference Krasnov, Shenbrot, Medvedev, Vatschenok and Khokhlova1997). The results of this study demonstrated that this is true not only from the perspective of the species identity of a parasite but also from the perspectives of a parasite species as a representation of a set of traits and a phylogenetic entity. The most likely reason behind this is between-habitat or between-biome variation in the physiological, ecological, and behavioural traits of the same host species. In other words, the resources provided by a host to a parasite and the parasite's pattern of acquiring this resource may differ in different biomes. The resources of a host used by a haematophagous ectoparasite are represented by both the host's body, providing a food source, and the host's burrow, providing a place for living, reproducing, and development of immature stages. Both these resources may vary between habitats. For example, between-habitat variation in the basal metabolic rate of Phyllotis darwini (Darwin's leaf-eared mouse; Cricetidae) has been shown to be associated with between-habitat variation in productivity (Bozinovic et al., Reference Bozinovic, Muñoz and Cruz-Neto2007). In small mammals, burrow architecture and, consequently, its microclimate often differ between habitats, depending on soil structure and/or vegetation cover (Rosi et al., Reference Rosi, Cona, Videla, Puig and Roig2000; Shenbrot et al., Reference Shenbrot, Krasnov, Khokhlova, Demidova and Fielden2002). Although variation in, for example, the host's body characteristics and burrow architecture at the temporal scale is less known, some studies suggest that this may be the case. For example, the level of a host's immunocompetence may vary in dependence on food availability (Martin et al., Reference Martin, Navara, Bailey, Hutch, Powell, Sheridan and Nelson2008), which, in turn, varies from year to year (e.g. Ostfeld and Keesing, Reference Ostfeld and Keesing2000).
Although the effect of the interaction between host species and either biome or sampling period on diversity was similar in both ectoparasite taxa, the relative contributions of host individual and host species differed between fleas and mites, with a stronger effect of host species on the latter's diversity. This is counterintuitive because the opposite can be expected due to the generally higher host specificity in fleas than in mites. One possible explanation can be associated with a host individual's losses and acquisitions of flea individuals and species on a daily basis (Krasnov et al., Reference Krasnov, Shenbrot, Khokhlova, Hawlena and Degen2006a). No study on the temporal stability of mite assemblages on an individual host has ever been carried out, but higher stability, as compared to flea assemblages, can be expected given the undoubtedly lower mobility of mites as compared to fleas. In addition, immature fleas of species considered here are never parasitic, whereas not only imagoes but also nymphs of many parasitic gamasids are haematophagous, with some mite species spending their entire life cycle on a host's body (Zemskaya, Reference Zemskaya1969; Radovsky, Reference Radovsky and Kim1985). The dependence of both the mite's imago and pre-imago on the host body can, at least partly, be a reason behind the tighter association between host species and ectoparasite diversity for mites than for fleas (compare also the F-statistics values between fleas and mites for the ANOVAs with host species as a factor in Tables 2 and 5).
Clustering of parasite species, traits, and lineages in the infracommunities at the β1 level (between host individuals within host species, habitat type, or sampling period) contradicts what has been found by Llopis-Belenguer et al. (Reference Llopis-Belenguer, Pavoine, Blasco-Costa and Balbuena2020) in the helminth parasites of marine fish. It also contradicts the broadly accepted idea that the species composition of a parasite assemblage on or in an individual host is a random subset of a larger species pool due to the predominance of stochastic processes in the infracommunity assembly (e.g. Poulin, Reference Poulin2007). Nevertheless, other studies provided some indirect evidence that the species assembly in infracommunities of, at least, fleas can be, to some extent, deterministic. For example, Krasnov et al. (Reference Krasnov, Stanko and Morand2006b) and Vinarski et al. (Reference Vinarski, Korallo-Vinarskaya, Shenbrot, Warburton, Surkova, Khokhlova and Krasnov2020) found positive species co-occurrences in flea infracommunities. These results and the results of the present study indicate a process resembling environmental filtering (in our case, filtering via some features of a host individual) as a governing force of species assembly in infracommunities. Features of an individual host that act as a filter may include between-individual heterogeneity in both the quality of the resource (e.g. blood) used by blood-feeding parasites and in the pattern of its acquisition associated with the host's anti-parasitic defence. These features vary among host individuals in dependence on, for example, sex and age (e.g. Hämäläinen et al., Reference Hämäläinen, Raharivololona, Ravoniarimbinina and Kraus C2015), social status (e.g. Snyder-Mackler et al., Reference Snyder-Mackler, Sanz, Kohn, Brinkworth, Morrow, Shaver, Grenier, Pique-Regi, Johnson, Wilson, Barreiro and Tung2016), and body conditions (e.g. Sánchez et al., Reference Sánchez, Becker, Teitelbaum, Barriga, Brown, Majewska, Hall and Altizer2018). However, Surkova et al. (Reference Surkova, Korallo-Vinarskaya, Vinarski, van der Mescht, Warburton, Khokhlova and Krasnov2018b) reported reduced body size overlap in flea species co-occurring in infracommunities, implying limiting a similarity as a community assembly rule. This suggests that species composition in infracommunities may be the net result of the simultaneous actions of the opposite forces (Poulin, Reference Poulin2007). Nevertheless, the environmental ( = host) filtering seems to be a predominant force because its actions in the infracommunities are indicated more often than those of environmental similarity.
Similar to findings in the helminth parasites of fish (Llopis-Belenguer et al., Reference Llopis-Belenguer, Pavoine, Blasco-Costa and Balbuena2020), the infracommunity composition of species, traits, and lineages differed between (but were clustered within) host species, biomes, and sampling periods (i.e. at the β2 level). This strongly indicates environmental filtering as the main assembly mechanism of infracommunities with the filters being (a) host features, such as host species-specific blood properties and defence abilities that affect patterns of ectoparasite feeding (see detailed discussion in Krasnov et al., Reference Krasnov, Shenbrot, Khokhlova, Stanko, Morand and Mouillot2015b); (b) biome features, such as the environmental characteristics of each biome that affect immature and adult ectoparasites via the microclimate of host shelters (Krasnov et al., Reference Krasnov, Shenbrot, Khokhlova, Stanko, Morand and Mouillot2015b, Reference Krasnov, Shenbrot, Korallo-Vinarskaya, Vinarski, Warburton and Khokhlova2019a); and (c) sampling period features, such as weather conditions in a given period that similarly to the biome-associated filter, influence fleas and mites residing in hosts’ burrows or nests.
In both ectoparasite taxa (and contrary to some of the findings of Llopis-Belenguer et al., Reference Llopis-Belenguer, Pavoine, Blasco-Costa and Balbuena2020 for helminths of marine fish), the patterns of the effects of host species, biome, and sampling period on infracommunity diversity were congruent among the three diversity facets. The most likely reasons behind this congruence are (a) trait clustering within a parasite species (e.g. Paseka and Grunberg, Reference Paseka and Grunberg2019) and (b) tight links between parasite traits and their phylogeny (the pattern of resemblance among phylogenetically related species; i.e. phylogenetic signal). Indeed, a phylogenetic signal for many traits has been shown for parasites (e.g. Mouillot et al., Reference Mouillot, Simková, Morand and Poulin2005). In particular, fleas demonstrated a phylogenetic signal in their characteristic abundance and the degree of host specificity, although the latter was relatively weak and dependent on spatial scale, and differed between geographic realms (Krasnov et al., Reference Krasnov, Poulin and Mouillot2011). The association between any trait and phylogeny has never been specifically studied for parasitic gamasids due to the lack of detailed phylogenetic information.
Previously, environmental filtering as the main mechanism of community assembly from compositional, functional, and phylogenetic perspectives has been shown for component and compound communities of fleas and mites (Krasnov et al., Reference Krasnov, Shenbrot, Khokhlova, Stanko, Morand and Mouillot2015b, Reference Krasnov, Shenbrot, Korallo-Vinarskaya, Vinarski, Warburton and Khokhlova2019a, Reference Krasnov, Shenbrot, Korallo-Vinarskaya, Vinarski, van der Mescht, Warburton and Khokhlova2019b; but see Vinarski et al., Reference Vinarski, Korallo-Vinarskaya, Shenbrot, Warburton, Surkova, Khokhlova and Krasnov2020 for mites). We thus may conclude that the patterns of assembly in ectoparasite infracommunities mirror those characteristic for their component and compound communities.
Supplementary material
The supplementary material for this article can be found at https://doi.org/10.1017/S0031182021000299
Data
The data that support the findings of this study are available from the corresponding author upon reasonable request.
Acknowledgements
This is publication no. 1094 of the Mitrani Department of Desert Ecology.
Author contributions
BRK conceived the study, MVV and NPK-V collected the data. BRK, ISK and GIS performed the data analysis. BRK and MVV wrote the first draft of the manuscript. All authors commented on previous versions of the manuscript. All authors read and approved the final manuscript.
Financial support
This study was partly supported by the Israel Science Foundation (grant no. 149/17 to BRK and ISK) and the Russian Ministry of Higher Education and Science (project no. 6.1352.2017/4.6 for MVV and NPKV).
Conflict of interest
The authors declare there are no conflicts of interest.
Ethical standards
All sampling procedures were in accordance with the national laws and guidelines of the former USSR and Russian Federation at the time of sampling.


