Introduction
In Ecuador 147,282 ha—nearly 0.6% of Ecuador's land area1—are used for banana cultivation. Commercial banana production takes place chiefly on the alluvial plains of the coastal lowlands in the provinces of Los Rios, Guayas and El Oro. About 10–12% of all economically active people in the country obtain some benefit from banana production. At presently, there are 5871 producers of banana and plantain. Unlike banana production in other exporting countries, production in Ecuador is not in the hands of multinational companies cultivating large areas. Instead, 80% of the total export production comes from growers maintaining areas smaller than 30 ha1.
Black Sigatoka, caused by the ascomycete Mycosphaerella fijiensis, is a major economic constraint on banana production because it reduces the photosynthetic area and consequently reduces fruit filling and induces premature fruit ripeningReference Carlier, Fouré, Gauhl, Jones, Lepoivre, Mourichon, Pasberg-Gauhl, Romero and Jones2–Reference Ploetz5. Yield losses range from 30 to 100% without fungicide applicationsReference Mobambo, Gauhl, Vuylsteke, Ortiz, Pasberg-Gauhl and Swennen6, Reference Stover7.
In Ecuador the disease was reported in 1987 in Cavendish plantations near the northern coastal province of EsmeraldasReference Fernández8. From there, the disease spread rapidly throughout the country and affected all banana-growing areas. Since then, black leaf streak has been controlled with contact and systemic fungicides, and with mineral oil sprays. Disease forecast systems based on climatic data are rarely used. Also, the behavior of the fungus towards fungicides has not been evaluated by farmers so farReference Fernández8. Chemical control is based on alternating systemic fungicides (benzimidazole, triazole, morpholine and strobilurin) and contact fungicides (chlorothalonil and mancozeb). During the past 10 years, the number of fungicide cycles has increased dramatically in Ecuador. This is most probably due to a reduced sensitivity of M. fijiensis towards fungicides of the propiconazole groupReference Jiménez, Bermeo, Jama, Pérez, Guzmán and Maribona9.
Because of environmental concerns regarding heavy pesticide use and soil degradation, many banana growers have shifted towards organic production. In such systems nutrients come from large amounts of organic matter, animal manure and rock phosphate. Key practices in this production system include the application of products of organic origin, soil management that stimulates biological activity, improved drainage, balanced nutrition, and removal of Sigatoka-infected leavesReference Holderness, Bridge and Gold10. Today, over 5000 ha of bananas have been certified as organic in Ecuador, whereas many more are in the process of transition towards organic production.
Since black Sigatoka is such an aggressive airborne fungus, especially in large banana plantations consisting of Cavendish varieties onlyReference Mourichon, Carlier and Fouré11, it is puzzling to note that so many farmers in Ecuador adopt a fungicide-free production system. Thus the main aim of this study is to describe the specific agronomic practices of the organic production system while proving the presence and evaluating the aggressiveness of fungal isolates from organic (OR) and inorganic (IN) farms. Future aims focus on understanding why black Sigatoka is not devastating organic banana production.
Materials and Methods
Geographical situation and climatic characteristics
Two neighboring farms (7 km apart from each other) were selected: one farm receiving only inputs of organic origin and products approved for organic agriculture, and henceforth called the OR farm, and a farm receiving inorganic fertilizers and fungicides, hereafter called the IN farm. Both farms were located in the Guayas province (southern coast of Ecuador), near the village of Taura (2°18′00″S, 79°42′00″W). The close proximity was essential for conducting a comparative study on black Sigatoka because weather conditions (such as temperature, amount of rainfall and sunshine) influence fungal developmentReference Gauhl12.
Based on 10-year averages, weather data for this area were as follows: maximum temperature 30.6°C; minimum temperature 20.4°C; annual rainfall 842 mm; and relative humidity 80.6%13. The rainy season lasts from January until May, and the dry season from June until December.
General facts about the OR and IN farms
The OR farm covered 196 ha cultivated with the Cavendish cultivarsReference Daniells, Jenny, Karamura, Tomekpe, Arnaud and Sharrock14 Williams (40%), Valery (40%), Grand Naine (10%) and Taura (10%), a local Cavendish selection. Plant density varied between 1450 and 1500 plants ha−1. The plantation was at least 10 years old and was initially treated with synthetic fertilizers and pesticides. Eight years ago, these practices ceased. The OR farm no longer used pesticides against black Sigatoka. Presently black Sigatoka-infected leaves were pruned and nutrients were applied through solid bio-fertilizers and liquid bio-fertilizers (LBFs). Annual yields varied from 1100 to 1500 boxesha−1 yr−1 depending on the geographical distribution of the different plots within the farm.
The IN farm consisted of 87.5 ha of the cultivar Williams. Plant density was 1450 plants ha−1. This plantation was about 15 years old and annual yields were 2100 boxes ha−1 yr−1. Black Sigatoka was controlled by both protectant (carbamates, chlorothalonil) and systemic (triazoles, benzimidazoles, morpholines and strobirulins) fungicides with seven or more fumigation cycles per year. Weeds were controlled with glyphosate every six to eight weeks in the rainy season and every 10 weeks in the dry season. The banana fertilization consisted of 400 kg ha−1 N mostly from urea, 600 kg ha−1 K, 80 kg ha−1 Mg, 2 kg ha−1 Zn and 1 kg ha−1 B spread over 13 application cycles within a year.
General facts relating to LBFs
Local micro-organisms (LM)
The growth medium for micro-organisms consisted of boiled rice (150 g) and 400 ml of a mixture of sugarcane molasses (40 liters), fish meal (27 kg), NaCl (680 g) and water (80 liters). This mixture was boiled, put into small containers covered by a mosquito net and placed near trees bordering the banana field.
After 21 days, unidentified micro-organisms were harvested. Simultaneously another sugarcane molasses–fish meal–NaCl–water mixture was made and transferred to a 500 liter tank. Fifty to seventy pots with micro-organisms were transferred to the big tank immediately and were hermetically sealed. Micro-organisms were multiplied by transferring 50 liters of the raw material to another tank (500 liters), where 20 liters of sugarcane molasses were added to 430 liters of water. The tank was then hermetically sealed for 7 days, after which it was ready for use in the preparation of the LBF.
LBF preparation
The LBF was a fermented solution prepared from raw materials used in the OR farm. The production of the LBF was based principally on fresh cow dung (40 kg), sugarcane molasses (4 liters), soybeans and bean leaves (10 kg), burned rice husks (10 kg) and LM (8 liters from the diluted LM tank). A 200 liter tank was filled with water, and the mixture was left to ferment under anaerobic conditions.
Once the fermentation process was finished, and prior to the foliar application, each tank of 200 liters was enriched with the following micronutrients: MgSO4 (0.9–1.3 kg), H3BO3 (0.9–1.3 kg), ZnSO4 (0.9–1.3 kg), CuSO4 (0.9–1.3 kg) and MnSO4 (0.9–1.3 kg). In the case of LBF for soil application, the enriching with K and P was done post-fermentation and with the following quantity per 200 liters tank: 3.2–6.4 kg of K2SO4 and 3.2–6.4 kg of phosphoric rock. After 60 days of anaerobic fermentation, the LBF was used as foliar or soil fertilizer. The LBF was sprayed on the leaves with a motorized backpack sprayer at a rate of 3 liters of pure bio-fertilizer diluted in 17 liters of water ha−1 week−1. The soil LBF was applied weekly through the irrigation system at 100 liters ha−1.
For approximately 1 year six samples were collected from the organic banana plantation to analyze the nutrient composition of the liquid products used as a main alternative in the management of black Sigatoka disease. Methodology for the chemical characterization is explained below.
Experiment one: black Sigatoka in vitro development
Thirty randomly selected plants in their vegetative and generative growth stage were twice selected from the OR and IN farms, during both rainy and dry seasons. The disease development was measured in fully extended leaves 1–6, leaf 1 being the youngest leaf emergedReference Brun15. In the laboratory, an incubation medium was prepared with bacto agar Difco™ (4 g l−1) added to distilled water and sterilized for 25 min at 121°C and 15 psi. Benzimidazole at 50 ppm was added to the Petri dish with a sterile syringe (Millex®-GP 0.22 μm) under sterile conditions. Leaf discs (5 cm2) with the upper leaf surface on the medium were incubated under continuous light (4000±200 Lux) at 26°C for 30 days approximately3. For each leaf disc, symptom development was recorded as: Stage 1: small whitish or yellow specks (less than 1 mm long); Stage 2: narrow reddish-brown or dark brown streaks, generally 2–5 mm long; Stage 3: streaks of 20–30 mm length; Stage 4: coalescing streaks broadened to a brown spot; Stage 5: elliptical black spot, usually surrounded by a yellow halo; Stage 6: center of the spot dry and clear grey, surrounded by a well-defined black borderReference Fouré, Persley and De Langhe16.
Experiment two: black Sigatoka disease development under greenhouse conditions
The experiment was repeated two times. Each time, 80 micropropagated Cavendish plantlets (Williams variety) were established in a greenhouse at 28°C and 96% relative humidity. Eight weeks after pot planting, plants were inoculated with in vitro conidia of M. fijiensis (3×10⁴conidia ml−1) isolates from each farm. Three different media were used to produce in vitro conidia from monosporic colonies (both from the OR and IN farms). Potato dextrose agar (4%) Difco™ was used for colony growth for 7 days at 26°C and in complete darkness. Then, colonies were transferred to a mycophil medium for 20 days under the above-mentioned conditions. Conidiophores were induced by transferring small pieces of mycelium to V8 sporulation medium (pH 6). Conidia were produced after 7 days at 26°C and with continuous light (4000±200 Lux).
The disease in the greenhouse was measured according to Alvarado et al.Reference Alvarado, Leiva, Dita, Acosta, Cruz, Portal, Gómez, García, Bermúdez, Padrón, Jacome, Lepoivre, Marin, Ortiz, Romero and Escalant17, which is a modification of the scale presented by Fullerton and OlsenReference Fullerton and Olsen18, as follows: 0: leaf symptoms absent; 1: reddish flecks on lower leaf surface, no symptoms on the upper surface; 2: regular or irregular circular spots on the lower leaf surface, no symptoms on the upper surface; 3: regular or diffused light brown circular spots on the upper leaf surface; 4: black or brown circular spots, possibly with a yellow halo or chlorosis of adjacent tissues, on the upper leaf surface, areas of green tissue sometimes present; 5: black spots with dry center of gray color and the leaf completely necrotic.
Experiment three: black Sigatoka disease and nutritional status under field conditions
During 2003 and 2004, 80 banana plants of 2 m height were randomly chosen per season (rainy and dry) in the OR and IN farms. For each plant, leaves number 3 and 4 were evaluated weekly for 10 weeks for black Sigatoka symptom developmentReference Fouré, Persley and De Langhe16. The disease severity was evaluated on 20 plants per stage [vegetative (2 m height), flowering and harvest] with Gauhl's modification of Stover's severity scoring systemReference Carlier, De Waele, Escalant, Vézina and Picq19. This is based on the proportion of leaf area covered by disease symptoms: 0=no symptoms; 1=(stages 1, 2 or 3) but not more than 1%; 2=less than 5% of the leaf affected; 3=from 6 to 15% of the leaf affected; 4=from 16 to 33% of the leaf affected; 5=from 34 to 50% of the leaf affected; and 6=more than 50% of the leaf affected.
At the experimental site the nutritional status was monitored during the years 2003 and 2004. Leaf samplesReference Martin-Prével, Halliday, Trenkel and Wichmann20 consisting of 15 cm wide strips were collected from the central part of leaf number 3 in 30 randomly chosen plants. The leaf nutrients content was compared with the leaf critical values (LCV)Reference Lahav and Turner21. Fifteen soil samples were collected at 0–30 cm depth, twice a year, from each farm. This sampling depth was sufficient because the majority of banana roots develop in the topsoilReference Blomme, Swennen, Tenkouano, Ortiz and Vuylsteke22. Moreover, the soil nutrient content from both farms was analyzed using the chemical characterization data over time (5 years).
Elements such as K, Ca, Mg, Cu and Mn were determined by atomic absorption spectrophotometry. Other elements like B and S were determined by UV–VIS spectrophotometry and the analytical methods were based on the Official Methods of Analysis of AOAC International Reference Jones23. Soil samples were processed by Mehlich extraction, whereas foliar samples were treated by wet-acid digestion. Nitrogen was analyzed by the Kjeldahl digestion procedure for plant tissue.
Statistical Analysis
The variables were classified into two types: discrete variables for the disease symptoms, and continuous variables such as nutrient content or yield per farm and the data of area under a curve of index disease evolution during evaluation time. Univariate descriptive statistics were applied for the estimation of central tendency parameters such as averages, and dispersion parameters such as standard deviation and coefficient of variance (CV). Multivariate descriptive statistics were used for analyzing similarities between the nutrient content over time in both farms. The soil nutrient content over time was analyzed by hierarchical cluster analysis using the Ward method and Euclidian distance.
Inferential statistics—analysis of variance (ANOVA) and the central limit theorem—were applied to compare the leaf nutrient content from experimental site versus LCV, by hypothesis contrast where H0: μ=LCV versus H1: μ>LCV. The t-test was used for analyzing the yields, income and profit data, and by Levene's test the equality of variances was proved. All data were analyzed by running SPSS version 11 and MINITAB 13 for Windows.
Results and Discussion
Yields, incomes and profits at OR and IN farms
Over a 5-year period, banana yields for the IN farm averaged 40.9 t ha−1 yr−1 which was 69% greater (P=0.01) than the 24.2 t ha−1 yr−1 for the organic farm (Table 1). However, prices over the 5-year period for the organic fruit averaged over two times that of conventional fruit (6.9 versus 3.1 dollars per box) resulting in gross product sales the same or higher on the OR farm (8735 versus 6757 dollars ha−1 yr−1; P=0.025). Hence on an annual basis the IN farm was more productive than the OR farm (Table 1). However, as organic fruit fetches much higher prices, the lower yield in the OR farm was more than compensated. Therefore, an average 16% higher net profit (3485 versus 1457 dollars ha−1 yr−1; P=0.023) was calculated in the OR farm compared to the IN farm during 2001–2005.
Table 1. Banana yields and incomes during five continuous years (each year being the total of 52 weekly values) from OR and IN banana farms.

1 Personal comunication from farmers.
2 Arias et al.Reference Arias, Dankers, Liu and Pilkauskas24.
Nutrient composition of LBF
The nutrient composition of the LBF was monitored over a period of 10 months (Table 2). The high CV (from 77.4 to 241.5%) indicated that the mineral composition of the LBF varied substantially during the year. This was not surprising since the LBF was made from locally available materials that also varied during the year25, Reference Restrepo26. Moreover, the quantities of the different materials used for the fermentation process were not well controlled. Table 2 shows that macronutrients like K, Na and Ca and micronutrients such as Fe, Si and Mn were present in the largest quantities.
Table 2. Nutrient composition of LBF samples prepared and applied on six different dates by foliar application in the OR farm.

Black Sigatoka development under in vitro conditions
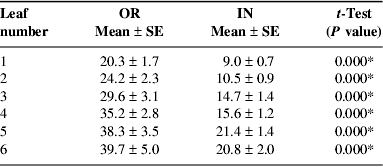
Leaf discs of banana leaves 1–6 were collected from vegetative growing and flowering plants in the organic and inorganic fields. Black Sigatoka symptoms under in vitro conditions were more pronounced in leaf discs from the OR farm than in leaf discs from the IN farm, both in plants in the vegetative growing stage (data not shown) and in the flowering stage (Fig. 1). The pattern of black Sigatoka symptom evolution was similar for all leaves, in both farms and at both plant stages. However, differences in symptom evolution in the OR and IN farms were more pronounced in the flowering plants and with increasing leaf age.

Figure 1. Black Sigatoka (BS) symptoms evolution during 28 days on in vitro cultured leaf discs of flowering plants. Leaves 1–6 were infected during the rainy season in an OR and IN farm.
While in the generative plant growth stage black Sigatoka in leaves 5 and 6 reached about stage 5 in the OR farm after 28 days incubation, it reached only stage 3 in the IN farm (Fig. 1). In the vegetative growth stage, black Sigatoka was also more pronounced in the OR farm than in the IN farm but differences were smaller (scores 2 and 1 for leaf 5 after 28 days' incubation for the OR and IN farms respectively (data not shown). The symptom evolution in the vegetative growth stage did not show any differences, but were significantly different in the generative growth stage between the OR and IN farms (Table 3).
Table 3. Black Sigatoka symptoms accumulation (area under the curve) in six leaves from banana plants in their generative stage in an OR and IN farm (n=50 per leaf and per farm).

* Significant differences at α=0.05.
These results corresponded to symptom development under field conditionsReference Gauhl12, Reference Stover27. The lower infection level in the IN farm was attributed to fungicide residues. The increase in black Sigatoka development stages was linked to leaf age and plant stage. This might be caused by the lower nutrient status of the leavesReference Lahav28–Reference Hedge and Srinivas31 when aging leaves export nutrients to younger leaves and the developing bunch. The translocation of nutrients from the older to the younger plant tissue could also contribute to higher disease developmentReference Restrepo26.
Black Sigatoka disease development under greenhouse conditions
In order to eliminate environmental effects and the possible effects of different M. fijiensis isolates, disease symptoms were monitored on micropropagated plants grown under greenhouse conditions. Disease symptoms were similar to those observed in the field on mature plants for conidia originating from both farmsReference Gauhl12. The disease development generated by both isolates was similar regardless of the origin of the conidial suspension during each evaluation time (Fig. 2). In addition, in vitro characterization of both isolates showed similarities in the organ's development (data not shown).

Figure 2. Black Sigatoka (BS) symptoms evaluation over 60 days on micropropagated banana plants grown in the greenhouse and inoculated with a M. fijiensis conidial suspension from an OR and IN farm.
Black Sigatoka disease and nutritional status under field conditions
In both growing seasons, black Sigatoka disease symptoms were more pronounced in the OR farm than in the IN farm (Fig. 3), and the accumulation of the disease symptoms in leaves 3 and 4 confirmed significant differences between OR and IN farms in relation to the season (data not shown). This was attributed to the fact that black Sigatoka was kept under control in the IN farm by frequent fungicide applications. In the OR farm however, the fungus was not controlled by fungicides, but leaves received LBF on a regular basis. This conclusion is supported by other authorsReference Fouré, Persley and De Langhe16, Reference Mobambo, Gauhl, Pasberg-Gauhland and Zoufa32.

Figure 3. Black Sigatoka (BS) symptoms evolution in leaf 3 and leaf 4 in an OR and IN farm during the rainy and dry seasons.
Disease severity was always lowest in the IN farm during any plant growth stage, indicating good chemical control (Table 4). This resulted in a significantly higher number of standing leaves in the IN farm at any growing stage except flowering. Despite the better Sigatoka control in the IN farm, the Sigatoka seemed to have been adequately controlled in the OR farm. Indeed, at harvesting 8.5 functional leaves were observed, while 6–7 functional leaves are considered adequateReference Zapata, Rodríguez, Cuesta, Armijo, Abuchar, Tábora, Rosales, Tripon and Cerna33. Hence, black Sigatoka in the OR farm was properly controlled, avoiding serious yield losses.
Table 4. Standing leaves and black Sigatoka severity (%) in banana plants at different growth stages in an OR and IN farm (n=50 plants per growth stage).

* Significant differences at α=0.05.
ns=not significant at α=0.05.
For bananas little is known about optimal nutrient requirements in relation to disease resistance. Unpublished data from Mendez et al., mentioned by RomeroReference Romero, Rosales, Tripon and Cerna34, reveal that N and K imbalances favor black Sigatoka development. Results in Uganda show that the intensity of black Sigatoka disease has a highly significant relationship with factors such as organic matter content in the topsoil and amounts of Ca and Mg10 in the soil. Deficiencies in Ca and P content predispose the plant to fungal and bacterial infectionReference Gunifer, Touchton and Johnson35. Black Sigatoka severity can be reduced if soil fertility and organic matter are high, such as in backyards that collect household refuseReference Mobambo, Zoufa, Gauhl, Adeniji and Pasberg-Gauhl36.
Since both farms received nutrients in different ways, the soil nutrient status was evaluated. Both the OR and IN farms had the same nutrient content (Table 5) except for Zn, which was significantly higher in the IN farm. On the other hand, higher electrical conductivity (EC) values in soil from the IN farm may result from the continuous use of synthetic fertilizers and subsequent nitrification of urea.
Table 5. Soil parameters and nutrients from OR and IN farms.
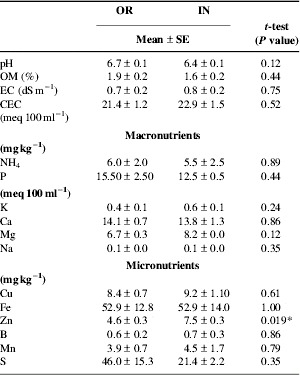
* Significant difference at α=0.05.
OM, organic matter; EC, electrical conductivity; CEC, cation exchange capacity.
Also, macro- and micronutrient content in leaf 3 of banana plants from OR and IN farms was similar, and all nutrient requirements were those recommended for banana productionReference Lahav and Turner37, Reference Alvarez, Ortega, Fernández and Borges38. Moreover, the leaf nutrient content from OR and IN farms was separately compared with the banana LCV. In the OR farm the concentrations of K (StDev=0.12) and Fe (StDev=7) were significantly higher (P=0.05), as was B (StDev=1.05) in the inorganic farm (Table 6). Yet soil nutrient data over a 5-year period clearly show that soils in both farms can be separately grouped (data not shown).
Table 6. Nutrient concentration on a dry matter basis in leaf 3 of banana plants from OR and IN farms and comparison with the LCV.

* Significant difference at α=0.05.
ns=not significant at α=0.05.
Conclusions
Cavendish plantations are reported to depend on synthetic fungicides to remain productive where black Sigatoka disease occurs. However, present results indicate that bananas can be grown commercially without fungicides in Ecuador. Indeed in an OR farm under study an average productivity of 23 t ha−1 yr−1 was recorded, with an average of 8.5 functional leaves, and 6.3% disease severity at harvest.
This OR farm received organic products made on-farm by fermentation of waste products, which vary tremendously from application to application. However, with inorganic fertilizers and fungicides, yield and black Sigatoka control is higher (42 t ha−1 yr−1 with 9.7 functional leaves and a disease severity of 1.3% at harvest). Comparative results both in vitro and in the greenhouse showed that the black Sigatoka fungus of both farms interacts in the same way with plants from the OR and IN farms. Soil analysis shows no differences between the OR and IN farms except for Zn, yet cluster analysis over a 5-year period allowed a clear separation between the OR and IN farms.
Leaf nutrient analysis shows that all plants had optimal nutrient amounts except for K and Fe in the OR farm, and B in the IN farm. The fact that organic fruit costs twice as much as inorganic fruit means greater profits and makes organic banana production a profitable agricultural system. Therefore further research is needed to investigate whether the Sigatoka disease in the OR farm is controlled due to a fungicidal action of the bio-fertilizer and/or whether some nutrients or nutritional balance have an effect on the plant defense system.
Acknowledgements
This work was financed by VLIR (Flemish Interuniversity Council, Belgium) by way of a grant given to ESPOL (Escuela Superior Politécnica del Litoral, Ecuador). Our special thanks go to Simon Cañarte for allowing access to his field and Jose Ruiz and Albert Liptay for the critical reading. This work is dedicated to Rodolfo Maribona, who initiated banana research at ESPOL, but passed away during the course of this work.