Introduction
Forage cactus consists of several species of the genera Opuntia and Nopalea, which belong to the Cactaceae family (Santos and Albuquerque, Reference Santos, Albuquerque, Mondragón-Jacobo and Pérez-González2002). Characterized by a remarkable tolerance to drought conditions, high water use efficiency, a rapid dissemination and growth, a high biomass yield, tolerance to salinity and a multipurpose use, cactus is a promising range of species that can promote ruminant livestock sector in dry areas and improve farmers’ income (Ben Salem, Reference Ben Salem2010).
In many arid regions, farmers use cactus extensively as an emergency forage that is harvested from both wild and cultivated stands to prevent the negative consequences of frequent and severe droughts (Guevara et al., Reference Guevara, Suassuna and Felker2009). According to Rocha (Reference Rocha2012) Brazil is the world's largest cactus producer, with approximately 5 00 000 ha of cultivated area in the North-east region. In semi-arid areas of Brazil, cactus is the main forage used in milk production systems and serves to bridge the gap in feed supply that occurs during the dry season (de Vasconcelos et al., Reference de Vasconcelos2009).
Despite adaptation to harsh environments of semi-arid north-eastern Brazil, the occurrence of pests and diseases limit cactus productivity in this region, due primarily to the carmine cochineal Dactylopius opuntiae (Cockerell). This insect is currently considered the most serious pest of this plant, and it has been a limiting factor to the growth of the crop (Warumby et al., Reference Warumby, Menezes, Simões and Sampaio2005). According to Almeida et al. (Reference Almeida2011) the carmine cochineal is known by its aggressiveness, weakening plants until death, with drastic impacts on ruminant breeding. In addition, the activity of this insect has negatively impacted regional agricultural systems and contributed to increased vulnerability and economic loss of local farmers, which can be up to 100% (Silva et al., Reference Silva2013). Use of resistant cultivars has been suggested as a promising pest management strategy in several crops. Use of resistant cultivars decreases insect populations, poses no potential environmental hazards, minimizes production costs and requires no specific knowledge or management skills from farmers (Agrawal and Heil, Reference Agrawal and Heil2012). With these goals in mind, over the last 10 years the Agronomic Institute of Pernambuco (IPA) has developed and released new varieties and clones of spineless cactus for field testing, which have resisted establishment of pest infestations after successive artificial or natural exposures in infested fields (de Vasconcelos et al., Reference de Vasconcelos2009; Silva et al., Reference Silva2009). Although these studies have evaluated the agronomic characteristics of spineless cactus that are resistant to the carmine cochineal, data on their nutritive value and digestibility have not been investigated extensively. Because of this gap in knowledge about these genotypes, the objective of the current study was to evaluate the nutritional divergence of 13 genotypes of spineless cactus including types that are susceptible, semi-resistant, or resistant to the carmine cochineal, with the ultimate aim of identifying promising genotypes for ruminant feeding.
Materials and methods
Location, sampling and treatments
Cactus genotypes that are part of a cactus-breeding programme were planted in the Arcoverde Experimental Station of the Agronomic IPA in the municipality of Arcoverde, Pernambuco State, Brazil (08°25′ S, 37°03′ W, 650 m a.s.l.). The climate in this region is characterized as ‘BSh’ according to the Köppen climate classification (Kottek et al., Reference Kottek2006), described as semi-arid with an annual rainfall of 690 mm and average maximum and minimum temperatures of 33 and 19 °C, respectively.
The soil type is a eutrophic regosol (Santos et al., Reference Santos2013) and analysis showed it to have the following properties: pH (water): 6.7; phosphorus (P): 3.8 mg/dm3; potassium (K): 0.35 cmolc/dm3; aluminium (Al): 0.10 cmolc/dm3; hydrogen (H) + Al (cmolc/dm3): 2.12; calcium (Ca) (cmolc/dm3): 8.4; Na = 0.12 cmolc/dm3; S = 13.8 cmolc/dm3; magnesium (Mg) (cmolc/dm3): 3.85 and organic matter (OM, g/kg): 16.3. Based on these soil characteristics and fertilizer recommendations for forage cactus, the experimental area was fertilized prior to planting with 100 kg N, 50 kg P and 100 kg K/ha.
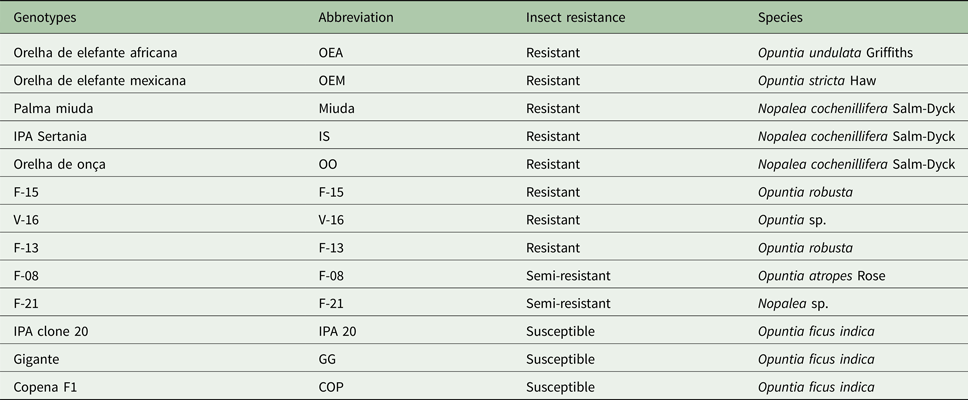
The treatments consisted of 13 spineless cactus genotypes, of which eight were resistant, two semi-resistant and three susceptible (Table 1). Treatments were arranged in a randomized complete block design with three blocks, where the plots were the blocking factors. An experimental unit consisted of one 4-m long row, with 1-m spacing between rows and 0.5 m between plants, with eight plants per row. Thus, plots were considered to be 4 m2 and were planted with the vegetative material (i.e. cladodes).
Table 1. Description of the 13 spineless cactus genotypes

The cactus plants were manually harvested 2 years after planting (early flowering stage), in the summer, at the base of the secondary and tertiary cladodes. Only the six central plants in each plot were harvested, with the remainder being discarded. The total mass harvested was used to measure the nutrient composition. After cutting, the samples were weighed, oven-dried at 55 °C for 48 h, ground through a 1-mm screen using a mill and stored at room temperature.
Chemical analyses and in vitro experiments
Ground samples were analysed for dry matter (DM) and OM as described by AOAC (2005) (methods 934.01 and 942.05, respectively). A Leco combustion N analyser (FP-428N Determinator, Leco Corporation, St Joseph MI, USA) was used to measure N concentration. Crude protein (CP) was calculated as N × 6.25. Ether extract (EE) was determined as described by AOAC (2005) (method 920.39) using an Ankom Fat Extractor (Ankom Technology Corporation, Macedon, NY, USA) and ash was determined as the gravimetric residue after heating to 550 °C for 8 h. Both neutral detergent fibre (NDF), which was determined by using heat-stable α-amylase and sodium sulphite, and acid detergent fibre (ADF) were quantified as described by Van Soest et al. (Reference Van Soest, Robertson and Lewis1991) and expressed exclusive of residual ash (aNDFom and ADFom).
Total (TC) and non-fibrous (NFC) carbohydrates were calculated as described by Sniffen et al. (Reference Sniffen1992):
 $${\rm T}{\rm C}_{{\rm g}/{\rm kg}{\rm} {\rm DM}} = 100{\rm} - {\rm} \left( {{\rm CP} + {\rm EE} + {\rm ash}} \right)$$
and
 $${\rm NF}{\rm C}_{{\rm g/kg DM}} = 100{\rm} - {\rm} \left( {{\rm CP} + {\rm EE} + {\rm ash} + {\rm NDFom}} \right)$$
where NDFom represents NDF corrected for ash and the other variables as previously described.
In vitro DM digestibility (IVDMD) was determined by the two-stage method of Tilley and Terry (Reference Tilley and Terry1963). Gas production and degradability were measured using the in vitro semi-automatic gas production technique of Mauricio et al. (Reference Mauricio1999) using inocula collected from three ruminally cannulated Sindi bulls fed a 600:400 (DM) cactus:grass diet, for 8 days prior to collection of inoculum. The ruminal liquid from bulls was removed, combined and stored in previously warmed 2-l thermal bottles. In the laboratory, ruminal liquid was filtered through two layers of cotton gauze, subject to continuous carbon dioxide (CO2) injection and kept in a warm thermostatic bath at 39 °C.
Pressure readings were taken at pre-established intervals of 2, 4, 6, 8, 10, 12, 14, 17, 20, 24, 28, 34, 48, 72 and 96 h by means of a pressure transducer. The pressure data (P in PSI - pounds per square inch) were converted into measurements of gas volume (V) by applying the quadratic equation of Pereira et al. (Reference Pereira, Jobim and Scapinello2009):
 $$\eqalign{V{\rm} \left( {{\rm ml}} \right) &{\rm = 0}{\rm {\cdot}17454}{\rm P}^{\rm 2}\left( {{\rm S}{\rm. E}{\rm. 0}{\rm. 09155}} \right) + {\rm 4}{\rm. 09089P} \ \left( {{\rm S}{\rm. E}{\rm. 0}{\rm. 06369}} \right) \cr &+ {\rm 0}{\rm. 00315} \left( {{\rm S}{\rm. E}{\rm. 0}{\rm. 00315}} \right){\rm,} R^{\rm 2}{\rm = 0}{\rm {\cdot}9917}}$$
Fermentation residues were obtained through filtration of fermentation bottles in crucibles (i.e. porosity 1, 100–160 µm) at 6, 12, 24, 48 and 96 h. Results obtained were used to calculate degradation kinetics parameters. For a mathematical description of ruminal fermentation kinetics obtained from the in vitro gas production technique, the dual-pool logistic model of Schofield et al. (Reference Schofield, Pitt and Pell1994):
 $$\eqalign{V =& (Vf1/(1 + {\rm exp}(2 - 4 \times K1 \times (t - L))) + Vf2)/(1 + {\rm exp}(2 \cr & - 4 \times K2 \times (t - L)))}$$
where Vf1 is equivalent to the maximum volume of gases from NFC; K1, to the degradation rate (/h) of NFC; Vf2, to the maximum volume of gases from fibrous carbohydrates (FC); K2, to the degradation rate (/h) of FC; and t and L, to the incubation times (h) and to the lag time (h), respectively.
For evaluation of degradation kinetics using gravimetric techniques an exponential model was used, corrected for the latency period, as described by Snedecor and Cochran (Reference Snedecor and Cochran1989) as:
 $$Y = b^{\prime} - B \times {\rm exp}( - c \times t)$$
where Y is the DM residue at time t; b′, potential DM degradation; B, the insoluble but potentially degradable DM fraction which will be degradable as a function of time at degradation rate c; c, the degradation rate of fraction B (/h); and t, the incubation time.
Multivariate analyses
A canonical variate analysis was used to reduce the dimensionality of the data (i.e. number of variables) and was mostly employed in relation to the analysis of main components due to the presence of samples with repeated observations. Use of this technique allowed evaluation of the simultaneous effect of the original features (i.e. DM, OM, CP, ADF, NDF, EE, TC, NFC, b′, B, c, L, Vf1, K1, Vf2, K2 and IVDMD) and thus captures variations not detected when using the original features alone.
The relative importance of the nutritional characteristics evaluated was quantified by the magnitude of the standardized canonical coefficients in the canonic variables, where the chemical composition and in vitro data of lowest importance were those for which the canonical coefficients had greater magnitude, in absolute value, in the last canonical variables. All variables in the current study were used initially but, among the variables, those with a low contribution for the distinction of the accessions were discarded (i.e. DM, OM, ADF, NDF, EE, B, c, L, K1, Vf2 and IVDMD).
For the hierarchical clustering procedure, the six discriminatory variables indicated by the analysis of canonical variables (CP, TC, NFC, Vf1, K2 and b′) were used since they had greater discriminatory power in distinguishing accessions. The complete linkage method, based on the maximum distance of similarity between genotypes, and standardized average Euclidean distance, was used to form the dendrogram.
Statistical analyses
Data about chemical composition and parameters relative to in vitro degradation of DM and gas production kinetics were analysed using a mixed model approach with the fixed effect of cultivar and random effects of blocks and residual error using the MIXED procedure of SAS Version 9.4 statistical program (SAS 2013). When significant, means across genotypes were compared using the Scott-Knott test carried out at P < 0.05. Then, multivariate variance analysis with the canonical variate analysis (CANDISC of SAS (2013)) and hierarchical agglomerative clustering by the complete linkage method was applied using the computational resources of MINITAB Version 16.2.4.4 (MINITAB 2013), adopting standardized mean Euclidean distance as a basic measure of dissimilarity. Mean variables of the groups used in cluster analysis were subjected to Tukey's test at the 0.05 probability level.
The univariate and multivariate analyses (i.e. canonical variate analysis) were made through SAS (2013). The non-linear models used to determine the in vitro DM kinetics parameters (i.e. potential DM degradation, insoluble but potentially degradable DM fraction and degradation rate of insoluble but potentially degradable DM fraction) were fitted using NLIN of SAS (2013).
Results
Chemical composition
Dry matter, ash, CP, NDF, EE, TC and NFC differed (P < 0.05) among genotypes (Table 2). The concentration of DM and ash ranged from 53 to 105 g/kg and from 95 to 205 g/kg DM, respectively. Crude protein concentration of the genotypes varied from 40 to 55 g/kg DM. Average NDF concentration among genotypes was 327 g/kg DM, and concentrations of EE in the DM varied from 18 to 33 g/kg. The genotype F-13 exhibited the highest (P < 0.05) TC concentration, although there was a similarity in NFC concentration for Miuda, IS, F-15 and V-16 genotypes. There was no difference in ADF concentration among genotypes which varied from 176 to 221 g/kg DM.
Table 2. Chemical composition (g/kg DM) and in vitro DM digestibility coefficient for 13 spineless cactus genotypes
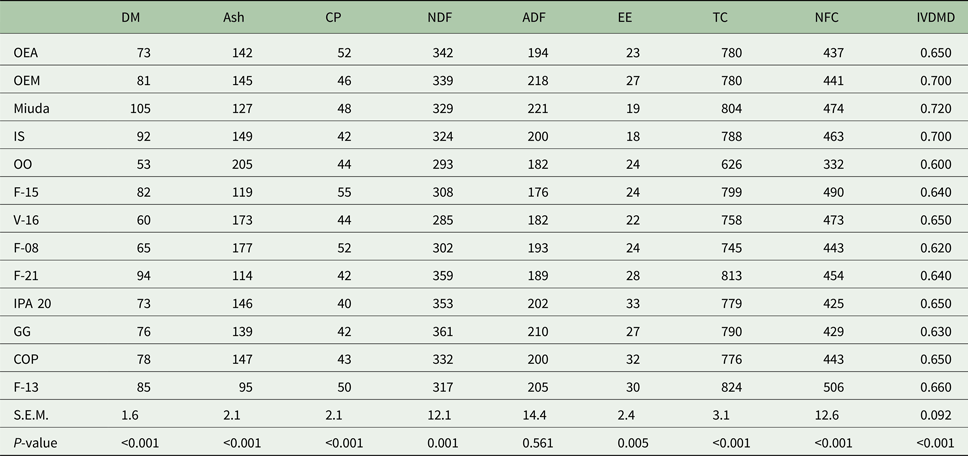
DM, dry matter; CP, crude protein; NDF, neutral detergent fiber; ADF, acid detergent fiber; EE, ether extract; TC, total carbohydrates; NFC, non-fibrous carbohydrates; IVDMD, in vitro dry matter digestibility; OEA, Orelha de elefante africana; OEM, Orelha de elefante mexicana; IS, IPA Sertania; OO, Orelha de onça; GG, Gigante; COP, Copena F1; s.e.m., standard error of mean; P, probability (if treatments differ at P < 0.05 by Scott-Knott test).
In vitro dry matter digestibility, in vitro gas fermentation and degradation kinetics
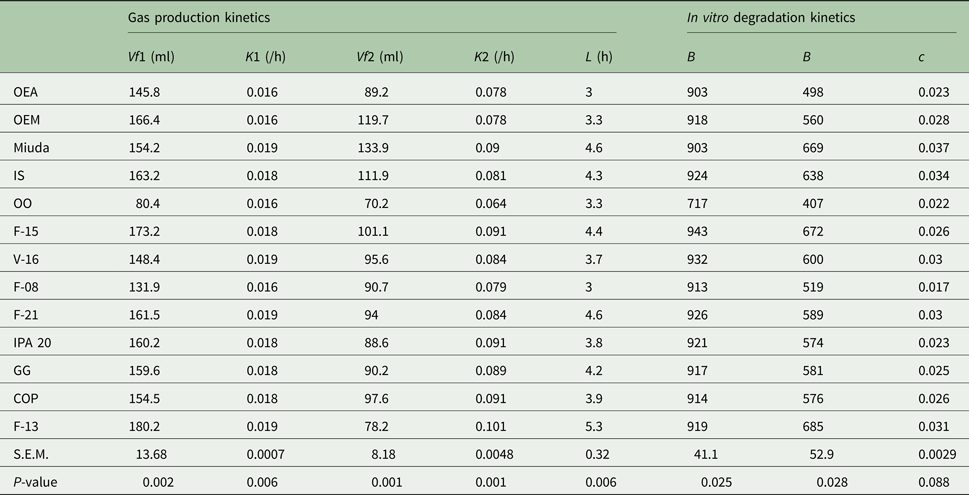
The genotypes OEM, Miuda and IS had greater (P < 0.05) IVDMD coefficient that ranged from 0.600 to 0.720 (Table 2). A larger variation in gas production kinetics was detected among treatments, with the OO genotype having the lowest (P < 0.05) gas production relative to the fermentation of NFC (Vf1). Degradation rates of NFC (K1) varied from 0.016 to 0.019/h. Gas production relative to the fermentation of FC (Vf2) varied from 70.2 to 134 ml with Miuda producing 91% more gas (P < 0.05) than OO. Lag time (L) varied from 3.0 to 5.3 h (Table 3).
Table 3. Parameters of in vitro degradation kinetics of DM and gas production kinetics of non-fibre carbohydrates (NFC) and of fibre carbohydrates (FC), relative to 13 spineless cactus genotypes

Vf1, maximum volume of gases from NFC; K1, degradation rate of NFC; Vf2, maximum volume of gases from FC; K2, degradation rate of FC; L, lag time; b, potential DM degradation; B, insoluble but potentially degradable DM fraction; c, degradation rate of fraction B; OEA, Orelha de elefante africana; OEM, Orelha de elefante mexicana; IS, IPA Sertania; OO, Orelha de onça; GG, Gigante; COP, Copena F1; s.e.m., standard error of mean; P, probability (if treatments differ at P < 0.05 by Scott-Knott test).
The potentially degradable DM fraction (b) varied from 717 to 943 g/kg DM and differed among treatments (P < 0.05), with OO genotype being inferior to the others. Insoluble but potentially degradable DM fraction (B) ranged from 407 to 685 g/kg DM and was greater (P < 0.05) in Miuda, IS, V-16, F-21 and F-13 than the others. Degradation rates (c) averaged 0.027/h and were similar among genotypes (Table 3).
Multivariate analyses
The first three canonical variables (i.e. CV1 = 0.58; CV2 = 0.04 and CV3 = 0.009) explained 0.98 of total variance, thus they were used for identification of characters with greater ability to discriminate among the genotypes based on nutritional parameters. Variables TC, NFC, Vf1, K2 and b were considered important for discrimination among genotypes since these had higher canonical coefficients in the first canonical variable. Variable TC had the greatest canonical coefficient (0.98) in the canonical variable of highest eigenvalue (0.58 of total variance), presenting itself as the main discriminating factor among genotypes. Non—fibrous carbohydrates, Vf1, K2 and b′ showed canonical coefficients of 0.78, 0.73, 0.68 and 0.70, respectively, in the first canonical variable. Despite having a greater canonical coefficient (0.78) in a third canonical variable, CP contributed significantly to discrimination among genotypes.
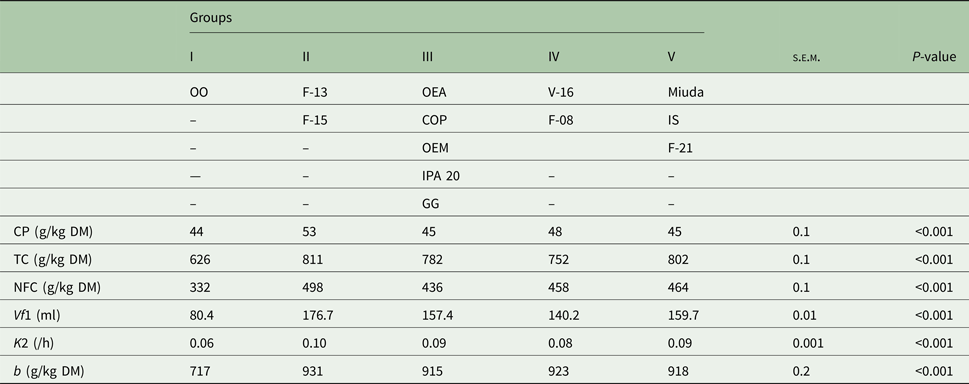
Five distinct groups were formed at a level of 81% similarity (Fig. 1). Group I was totally dissimilar from the other groups with the genotype OO as its single component. Group II, composed by F-13 and F-15, showed 90% similarity. Group III (OEA, OEM, COP, IPA 20 and GG) and Group IV (V-16 and F-08) displayed similarities of 88 and 86%, respectively. Group V (Miuda, IS and F-21) exhibited greater similarity (92%) as compared with the other groups (Fig. 1). Differences (P < 0.05) were observed for the variables among groups (Table 4). Group II (F-13 and F-15) was particularly notable relative to the other groups since it had greater CP, TC, NFC, Vf1, K2 and b′. Group I (OO) showed the lowest value for all variables.
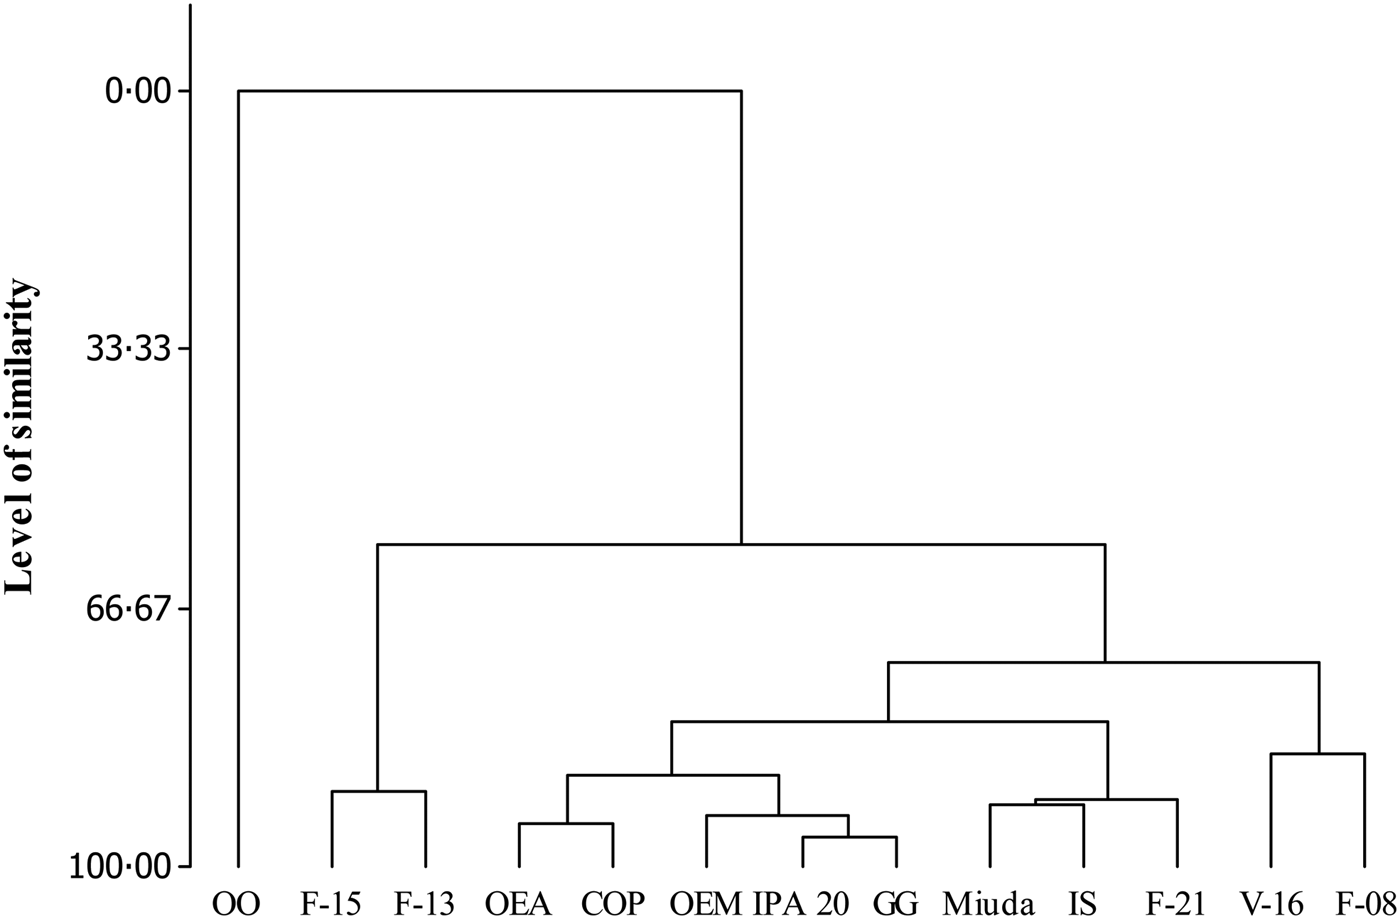
Fig. 1. Similarity dendrogram for the nutritional value of the 13 spineless cactus genotypes.
Table 4. Groups of genotypes of spineless cactus obtained by the complete linkage method and the average of the variables in each group

CP, crude protein; TC, total carbohydrates; NFC, non-fibrous carbohydrates; Vf1, maximum volume of gases from NFC; K2, degradation rate of FC; b, potential DM degradation; OEA, Orelha de elefante africana; OEM, Orelha de elefante mexicana; IS, IPA Sertania; OO, Orelha de onça; GG, Gigante; COP, Copena F1; s.e.m., standard error of mean; P, probability (if treatments differ at P < 0.05 by Tukey test).
Discussion
Studies have suggested spineless cactus as a feed for livestock in arid regions owing to its desirable nutritional characteristics such as high total carbohydrate concentration and DM digestibility, and potential to yield high biomass in these regions (Ben Salem et al., Reference Ben Salem, Nefzaoui and Ben Salem2002; Gebremariam et al., Reference Gebremariam, Melaku and Yami2006). The current work examined 13 genotypes of spineless cactus planted in a Brazilian semi-arid region and used multivariate analysis of chemical composition, IVDMD, gas production and in vitro DM digestion kinetic parameters in order to select the most promising genotypes to be used in animal feeding.
Ash concentration was greater than those reported for spineless cactus cultivars from other locations in north-eastern Brazil (Batista et al., Reference Batista2003a, Reference Batista2003b); however, it was lower than Ayadi et al. (Reference Ayadi2009) observed in Tunisia. Mondragón-Jacobo and Pérez-González (Reference Mondragón-Jacobo and Pérez-González2002) indicated that ash concentration of spineless cactus could be as high as 300 g/kg DM. Factors such as soil mineral and moisture concentrations can significantly affect ash and mineral concentrations of spineless cactus. Water deficiency and high levels of minerals in the soil tend to push cacti to accumulate these compounds in their cladodes (Nobel, Reference Nobel, Mondragón-Jacobo and Pérez-González2002).
In general, cactus is characterized by a low CP concentration. Average values of 39 g/kg and 58 g/kg have been reported by Costa et al. (Reference Costa2013) and Abidi et al. (Reference Abidi2009), respectively. However, higher CP values were reported by Batista et al. (Reference Batista2003a, Reference Batistab) (60–77 g/kg) for several cactus cultivars from north-eastern Brazil, and Ayadi et al. (Reference Ayadi2009) showed CP concentration of 88 g/kg in cladodes of Tunisian O. ficus indica. Crude protein concentration of cactus is affected by soil moisture and N concentration, as well as N fertilization (Nefzaoui and Ben Salem, Reference Nefzaoui, Ben Salem, Mondragón-Jacobo and Pérez-González2002; Dubeux et al., Reference Dubeux2006). Due to a low CP concentration, N supplementation is required to improve animal performance fed diets containing cactus (Ben Salem et al., Reference Ben Salem, Nefzaoui and Ben Salem2002; Misra et al., Reference Misra2006).
Several authors (Batista et al., Reference Batista2003a, Reference Batista2003b; Gebremariam et al., Reference Gebremariam, Melaku and Yami2006; Abidi et al., Reference Abidi2009) showed that spineless cactus has low concentrations of fibrous fractions (NDF ranged between 186 and 392 g/kg, while ADF concentration ranged from 113 g/kg to 248 g/kg), results that are similar to the current study. This characteristic of low NDF and ADF concentrations is associated with high non-structural carbohydrate concentration, making the spineless cactus a valuable source of fermentable carbohydrates for ruminants. On average, cactus TC concentration ranged from 62 to 84 g/kg DM, while NFC range from 31 to 58 g/kg DM (Tegegne et al., Reference Tegegne, Kijora and Peters2007; Costa et al., Reference Costa2013; Tosto et al., Reference Tosto2015). Results from the current study were within these ranges. Batista et al. (Reference Batista2003a) reported that rapidly (i.e. sugars and organic acids) and intermediately (i.e. starch) degradable carbohydrate fractions constituted 0.42 and 0.19, respectively, of the total carbohydrates in cactus.
The forage cactus contains high levels of pectin (Batista et al., Reference Batista2003a), which contributes to a greater production of acetate. Lower gas production is observed when propionate is formed, due to the absence of CO2 production.
However, when fermentation is directed toward the formation of acetate and butyrate, CO2 is produced, consequently increasing the volume of gases. In such cases, the fermentation of the forage cactus results in the production of gases derived from NFCs, due to the fermentative property of pectin.
In regard to IVDMD, Brazilian spineless cactus genotypes exhibited similar averages to those reported by Pinos-Rodríguez et al. (Reference Pinos-Rodríguez2010) who described IVDMD of 0.66 for cladodes up to 90 days of maturity and grown in Mexico. These cactus genotypes had IVDMD levels that allowed them to be fed to ruminants as tropical forages without negatively affecting performance/intake, considering that diet digestibility coefficient lower than 0.650 would reduce feed intake due to physical limitations in the rumen (Conrad et al., Reference Conrad, Pratt and Hibbs1964).
It is likely that a greater ash concentration and lower NFC concentration contributed to lowering the IVDMD, gas production and DM degradation of the OO genotype. The opposite occurred with the genotypes Miuda and IS since their greater NFC concentration resulted in a greater amount of fermentable substrate at any time, and consequently contributed positively to increasing IVDMD, B and c. These results are in agreement with other studies, where c for spineless cactus ranged from 0.06 to 0.3/h (Abidi et al., Reference Abidi2009; Luz et al., Reference Luz2014; Tosto et al., Reference Tosto2015).
All cactus genotypes had high potential DM fermentation with little difference among them. This is probably related to the low ADF concentration observed in all genotypes. In agreement with the current results, Batista et al. (Reference Batista2003b) and Tosto et al. (Reference Tosto2015) reported Vf1 of 195–222 ml for different spineless cactus. High gas production and DM degradation of cacti are likely due to their high non-structural carbohydrate and low lignin concentrations, which probably explains the high degradation rate of the slowly degradable DM fraction. High degradation rates (7.0–10.0%/h) of potentially degradable DM for different cactus cultivars have also been reported by Batista et al. (Reference Batista2003b).
The Group II, which included F-13 and F-15 genotypes, stood out dramatically from the remaining genotypes since it showed greater values for all variables used to evaluate clustering. Despite the absence of prior nutritional information about these two genotypes, the results observed in the current study indicate their potential for use in the feeding of ruminants, since they were nutritionally superior to other genotypes traditionally used, such as giant and miuda. In contrast to Group II, the elevated ash concentration and the lower carbohydrate concentration of the OO genotype resulted in lower DM degradation rates and consequently, in lower nutrient availability per unit time. Apparently, the resistance factors, as lignification, silicification or thicker epidermal cells, did not influence the nutritional value of genotypes or the formation of groups, since Group III contained both resistant and susceptible genotypes. These results point to the need for further studies that indicate the understanding of the influence of these resistance factors on the nutritional value and the digestibility of cactus genotypes.
The genotypes studied exhibit variation in the nutritional characteristics evaluated and were grouped into distinct sub-groups. Genotypes F-13 and F-15 stood out among the genotypes evaluated, providing evidence that they have significant promise for utilization in ruminant feeding programmes. The orelha de onça genotype was inferior to the other genotypes due to its chemical composition and consequently its nutritional parameters. Spineless cactus genotypes resistant to the carmine cochineal showed nutritional characteristics similar to or better than traditionally used susceptible cactus genotypes. In vivo studies should be performed in the future to determine animal response to these cactus genotypes in order to better assess their fodder potential.
Furthermore, there is a need for more agronomic evaluation studies using these resistant genotypes, where the plants must undergo several abiotic stress conditions, different management conditions, environments and, especially, the study of the correlation of productive adaptability with nutritional characteristics.
Financial support
This research received no specific grant from any funding agency, commercial or not-for-profit sectors.
Conflicts of interest
None.
Ethical standards
Not applicable.